What is LabCanvas? One workspace for scientific illustration, data and presentation
A guide to LabCanvas: ten connected apps for figures, molecules, 3D crystals, graphs, slides and posters, the workflows between them, ready-made templates, and why one editable canvas makes scientific illustration faster to learn and easier to change.
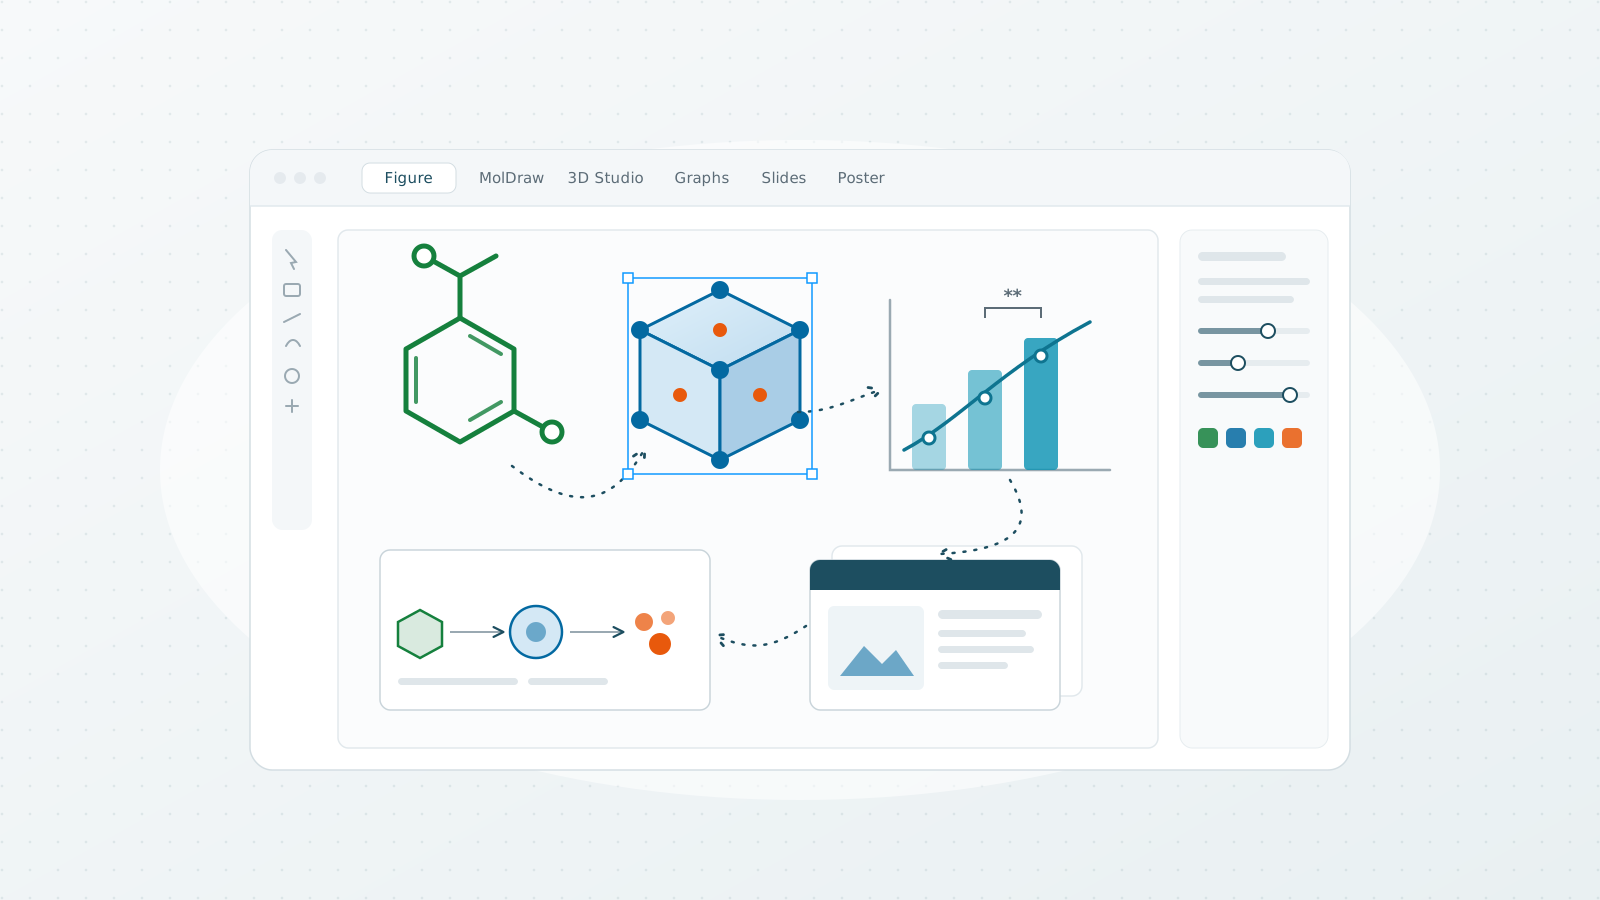
LabCanvas is a browser workspace for the visual side of research: figures and graphical abstracts, chemical structures, 3D crystals and nanomaterials, protein structures, graphs and statistics, slides and posters. It is ten apps that share one canvas, so whatever you make in one of them can be placed, edited and reused in the others.
This article explains what each app does, how they connect, what the templates are for, and why we built it as one connected tool instead of another single-purpose one.
The problem: a figure passes through too many tools
Ask a chemist or materials scientist how a paper figure gets made and you often hear the same chain:
- Draw structures in a chemical drawing program and export a picture.
- Render a crystal or nanostructure in a separate 3D tool and export another.
- Make the graphs in a plotting program, then fix the fonts by hand.
- Assemble everything in a general illustration program, where nothing is editable any more.
- Rebuild half of it in PowerPoint for the group meeting, and again on a poster for the conference.
Each step works, but every hand-over turns something editable into a flat picture. When a reviewer asks for a different colour scheme, a corrected bond angle or one more data point, you go back to the start of the chain. Each tool also has its own interface to learn, its own file format and its own export settings.
The idea: one canvas, many specialised apps
LabCanvas keeps the specialised tools, because drawing a reaction scheme and fitting a dose–response curve really are different jobs, but puts them on one shared canvas with one interface. A molecule from MolDraw, a render from the 3D Studio and a graph from the statistics app all land in your figure as layers you can still change. The same figure then goes onto a slide or a poster without exporting anything.
| Before | With LabCanvas |
|---|---|
| Five or six programs, each with its own interface | Ten apps with the same toolbar, panels and shortcuts |
| Pictures pasted between tools | Live layers that stay editable |
| Redraw the figure for slides and posters | The same figure on the canvas, the slide and the poster |
| Search databases in another tab, download, import | PubChem, the RCSB PDB and crystal files opened inside the apps |
| Start every graphical abstract from a blank page | Templates of real syntheses, with the papers they follow |
The ten apps
Figure editor
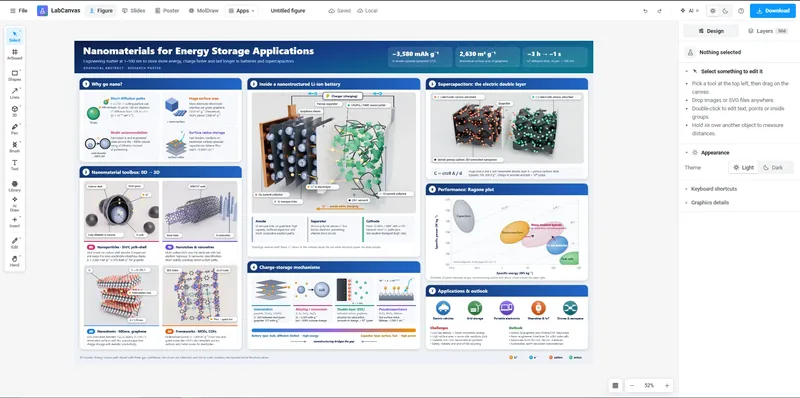
The centre of LabCanvas. It has the vector tools you would expect from a professional illustration program (pen, shapes, boolean operations, gradients, scientific brushes for DNA, membranes and proteins) plus more than 150 science objects: liposomes, nanoparticles, crystals, cells, viruses, hydrogels and lab glassware that snaps together joint by joint. Each object is drawn by a generator, so the number of layers in a vesicle, the size of a pore or the density of a ligand shell is a setting, not something you redraw. Equations are typeset with LaTeX and stay vector; tables have publication styles. Export is set in millimetres and dpi, so a figure leaves at exactly the width and resolution a journal asks for.
MolDraw
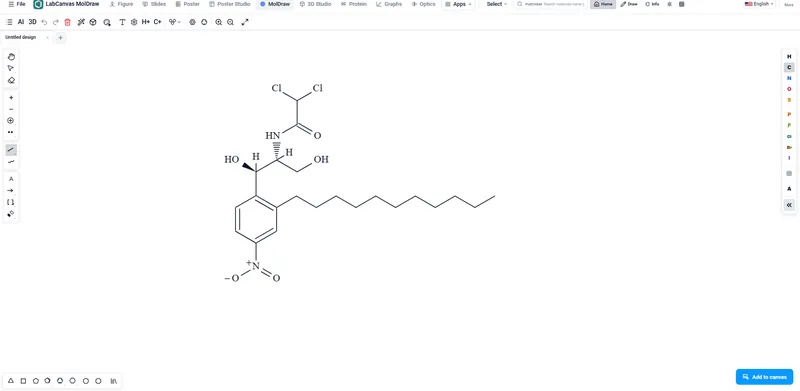
A chemical structure editor for molecules and reactions: atoms, bonds, rings, charges, stereo bonds and reaction arrows, with templates for common rings and groups. Start from a PubChem structure instead of drawing from scratch, check it in 3D, and send the scheme to your figure as a crisp vector layer.
3D Studio
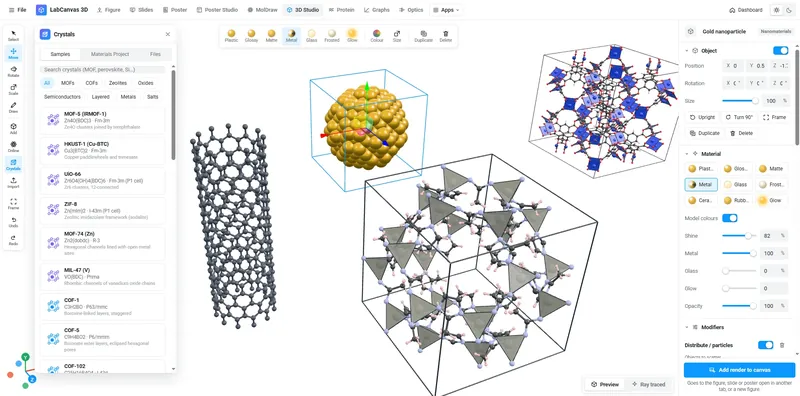
Build nanomaterials and devices from parameters (nanoparticles, core–shell structures, porous scaffolds, MOFs, nanotubes, 2D materials, batteries and solar cells) or open crystal structures and molecules. Every model has sliders, and the ray-traced render drops straight into your figure. For materials chemists this replaces the separate visualisation program and the screenshot step.
Protein viewer
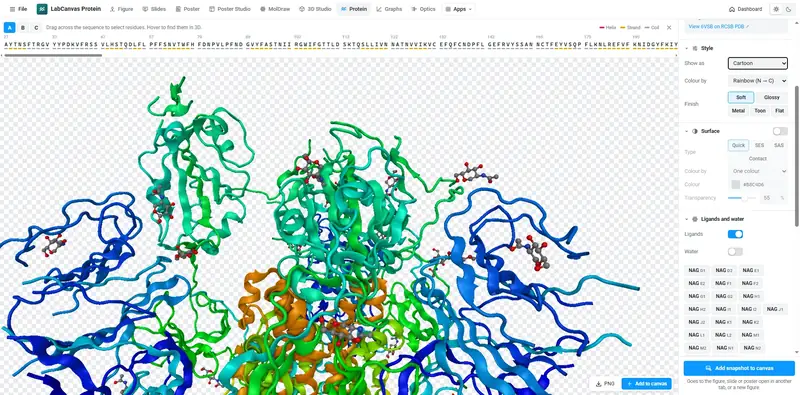
Type a PDB ID or open your own PDB or mmCIF file, select residues on the sequence, switch between cartoon, surface and ball-and-stick, and take a transparent snapshot for your figure. Useful for chemical biology, catalysis by enzymes and anyone whose materials meet biology.
Graphs and statistics
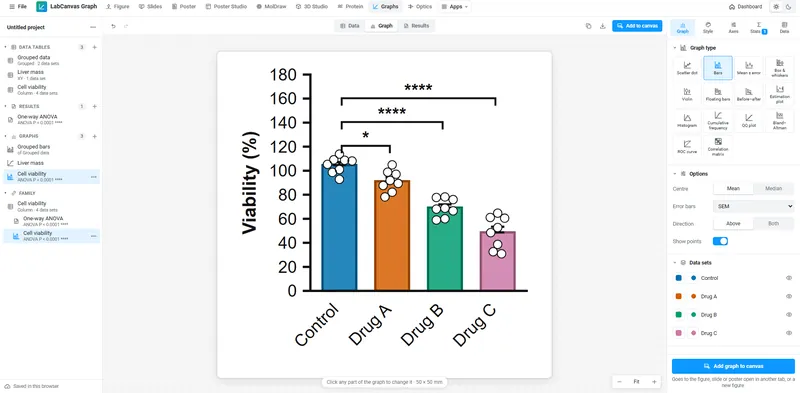
Data tables in the style of the statistics programs scientists already know: column, XY, grouped, survival and contingency tables, with t tests, ANOVA and post-hoc tests, curve fits and log-rank tests, checked against SciPy and statsmodels. The graph stays linked to its data, so a corrected value updates the figure it sits in.
Slides, Poster and Poster Studio
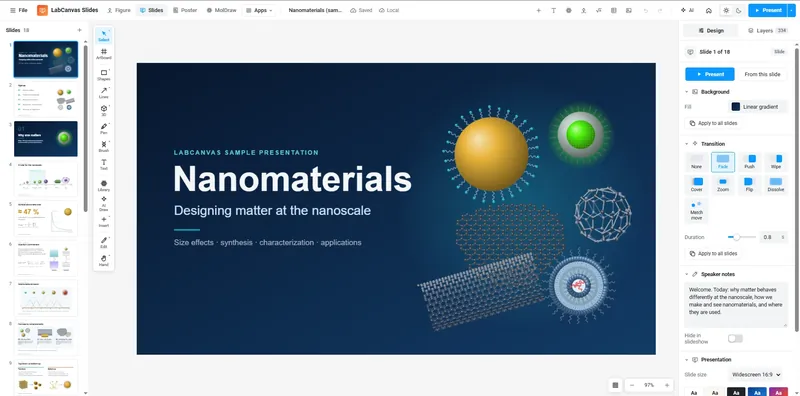
Slides is a presentation app built on the figure editor: a slide strip, layouts, themes, transitions, speaker notes and one vector PDF at the end. Poster lays out blocks in columns that re-flow when you move or resize them; Poster Studio offers ready-made poster designs with a header, logos and boxes you drag into place. Because they share the canvas, the figure you made for the paper is the figure on your slide and your poster, not a copy that drifts out of date.
Optics and the Pixel editor
Optics builds optical setups on a breadboard (lasers, lenses, mirrors, gratings, detectors) with the beam path traced live, for clean schematics of spectroscopy and imaging setups. The Pixel editor handles micrographs and photos in place: crop, levels, curves, false-colour lookup tables and retouching, without leaving your figure. SEM and TEM images can be cleaned up exactly where they sit in a panel.
Workflows that cross the apps
The apps are most useful together. Some common paths:
- Structure to graphical abstract. Draw the precursor in MolDraw, build the product's crystal or nanostructure in the 3D Studio, and arrange both with arrows, conditions and labels in the figure editor at the size the journal's table-of-contents graphic needs.
- Data to figure to talk. Paste your XRD, spectroscopy or kinetics data into the graphs app, run the fit, place the graph in a multi-panel figure, then put the same figure on a slide for group meeting.
- CIF to poster. Open a crystal structure, render it, and drop it into a poster block that re-flows around it.
- Micrograph to panel. Crop and adjust an SEM image in the Pixel editor, add a scale bar and labels, and line it up with the other panels.
At each step the work stays editable. If a supervisor asks for a different colour for the oxygen atoms, you change it once.
Templates: start from a real synthesis
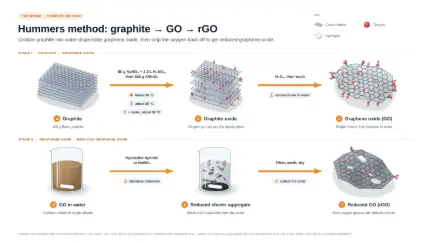
A blank page is the slowest way to start a graphical abstract. LabCanvas includes templates of real syntheses drawn in the same visual style: graphene by mechanical, liquid-phase and electrochemical exfoliation, Hummers' method and CVD growth; nanomaterials such as Turkevich gold, seed-mediated gold nanorods, Stöber silica, MCM-41, ZIF-8 and UiO-66, MXenes, magnetite and carbon dots; and full figures on graphene oxide characterisation, nanomaterials for energy storage and targeted drug delivery.
Every template is made of normal, editable layers, and each one lists the papers it follows, with DOIs where they exist. Change the reagents, re-label the steps, swap a nanoparticle for your own and the figure is yours. Templates open from the editor's Templates panel, and admins can add new ones from any design.
Why this approach works
Editability. Objects are generated from parameters and graphs are linked to data, so revisions are edits, not redraws. Nothing is flattened until you export.
Customisation. Every colour, size and label is a setting. Themes and styles apply across a figure, a deck or a poster, which keeps a paper's figures consistent.
One interface, a short learning curve. The toolbar, the layers panel, selection, alignment and shortcuts are the same in every app. Learn the figure editor and you already know most of Slides and Poster.
Connected databases. Structures come from PubChem, proteins from the RCSB PDB and crystals from structure files, inside the apps that use them, so there is no download-and-import step.
Optimised workflows. Renders, graphs and edited images go straight onto the canvas you are working on. Figures move to slides and posters without exporting.
Optimised templates. Templates are laid out at 16:9, ready for slides and graphical abstracts, and the artboard presets cover journal table-of-contents sizes, slide formats and standard poster sizes.
Journal-ready output. Set the width in millimetres and the resolution in dpi and export TIFF, PDF, SVG, PNG, JPEG or WebP; the file carries its DPI, so it opens at the right size.
An assistant that edits with you. The built-in AI assistant works through the same actions as the toolbar and creates real layers, and an MCP server lets agents such as Claude build figures, slides and 3D scenes in your open apps.
Who it is for
LabCanvas is built for researchers who make their own figures: PhD students and postdocs preparing papers and talks, group leaders assembling reviews and grant figures, and R&D teams who present results every week. It is especially at home in chemistry and materials science, where one figure often combines structures, crystals, micrographs and data.
Getting started
Open the dashboard, pick an app or a template, and start. Your designs are saved to your account and open on any computer. If you want a guided start, the onboarding asks four quick questions and points you to the right app; the features page describes every app in more depth, and the documentation covers the details.
Try it in LabCanvas
Every app is free to start in your browser. Create an account and begin.
Open the dashboard