The LabCanvas Pixel editor: edit micrographs and photos inside your figure
How to adjust microscopy images and photos in the LabCanvas Pixel editor: crop, levels, curves and exposure, false-colour lookup tables, healing and clone stamp, selections and masks, with an edit log for your methods section.
Contents
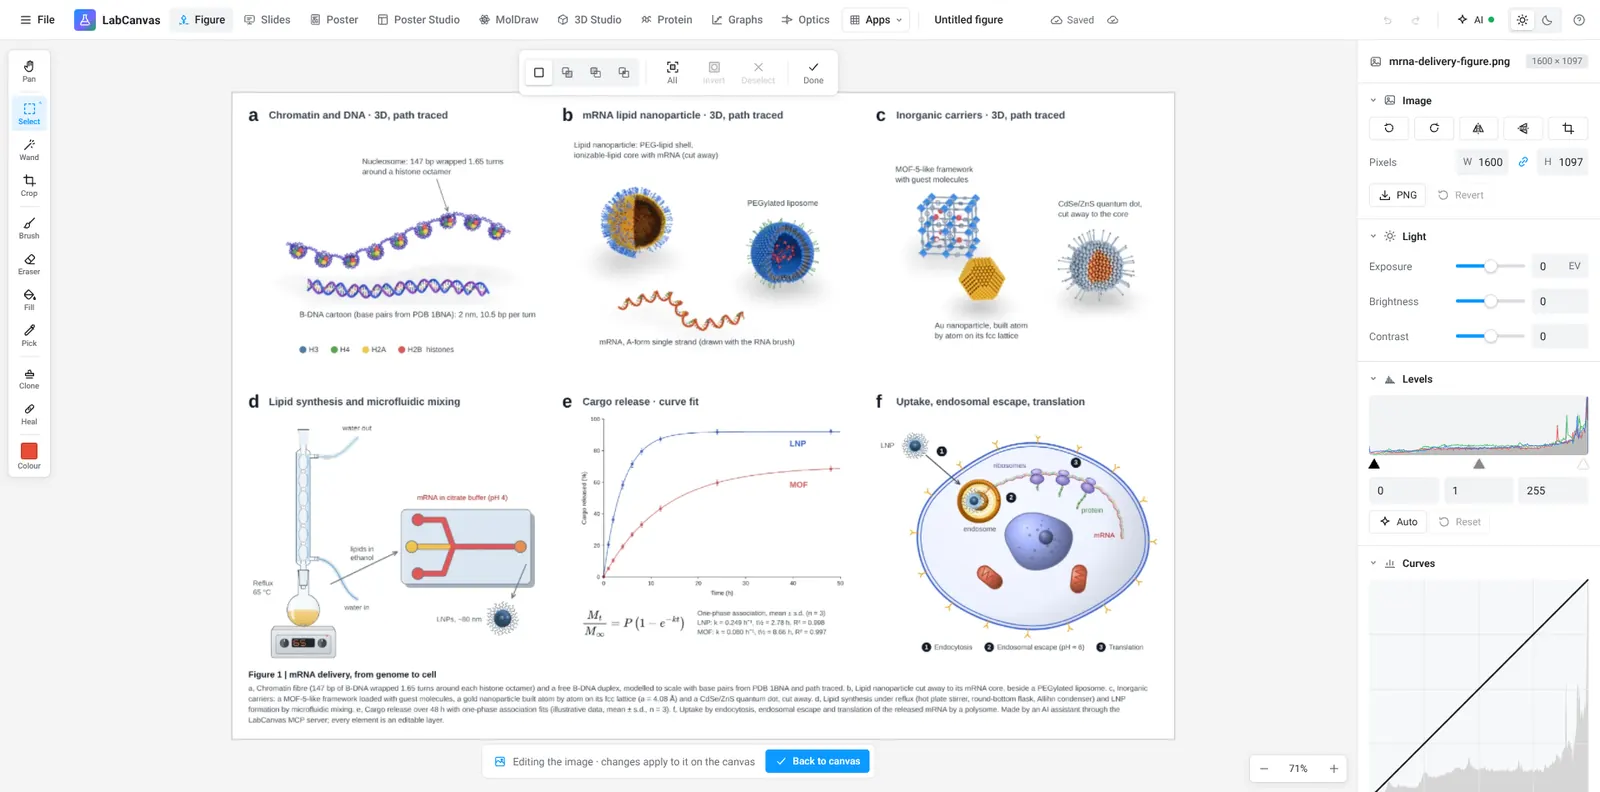
The LabCanvas Pixel editor edits the raster images in a figure, such as micrographs, gels and photos, without leaving the figure. It has crop, levels, curves and exposure, false-colour lookup tables, healing and clone stamp, selections and masks, and it keeps a log of every edit for your methods section. The edits flow back into the figure layer.
What it is for
- Micrographs: crop to the region of interest, set levels so the signal fills the range, apply a lookup table.
- Multi-panel figures: apply the same adjustments to every panel so the images stay comparable.
- Photos of setups and samples: straighten, crop, correct exposure, remove dust from the background.
Tools
| Tool | What it does |
|---|---|
| Crop and rotate | Frame the region of interest, straighten the image |
| Levels and curves | Set black and white points and the tone curve |
| Exposure | Brightness, contrast and exposure |
| Lookup tables | False-colour maps for single-channel images |
| Healing and clone stamp | Retouch photos of setups (not data) |
| Selections and masks | Limit an adjustment to part of a photo |
| Edit log | Every edit listed, for the methods section |
How to adjust a micrograph for a figure
- Place the image in your figure, right-click it and choose to edit it (or open the Pixel editor).
- Crop to the region of interest.
- Use Levels so the signal uses the full range without clipping.
- Apply a lookup table if the image is a single channel.
- Go back to the figure; the panel is updated. Copy the edit log into your methods.
Image integrity
Scientific images are data. Adjust the whole image evenly, keep the original file, never remove or add features in a data image, and describe the processing. The edit log makes the last step easy. The editorial guidelines explain how LabCanvas handles accuracy in its own content.
Frequently asked questions
Do I need to leave my figure to edit an image?
Which adjustments are there?
Is it acceptable to edit microscopy images for a paper?
What is the edit log for?
Can I edit several panels the same way?
Try it in LabCanvas
Every app is free to start in your browser. Create an account and begin.
Open Pixel editorKeep reading
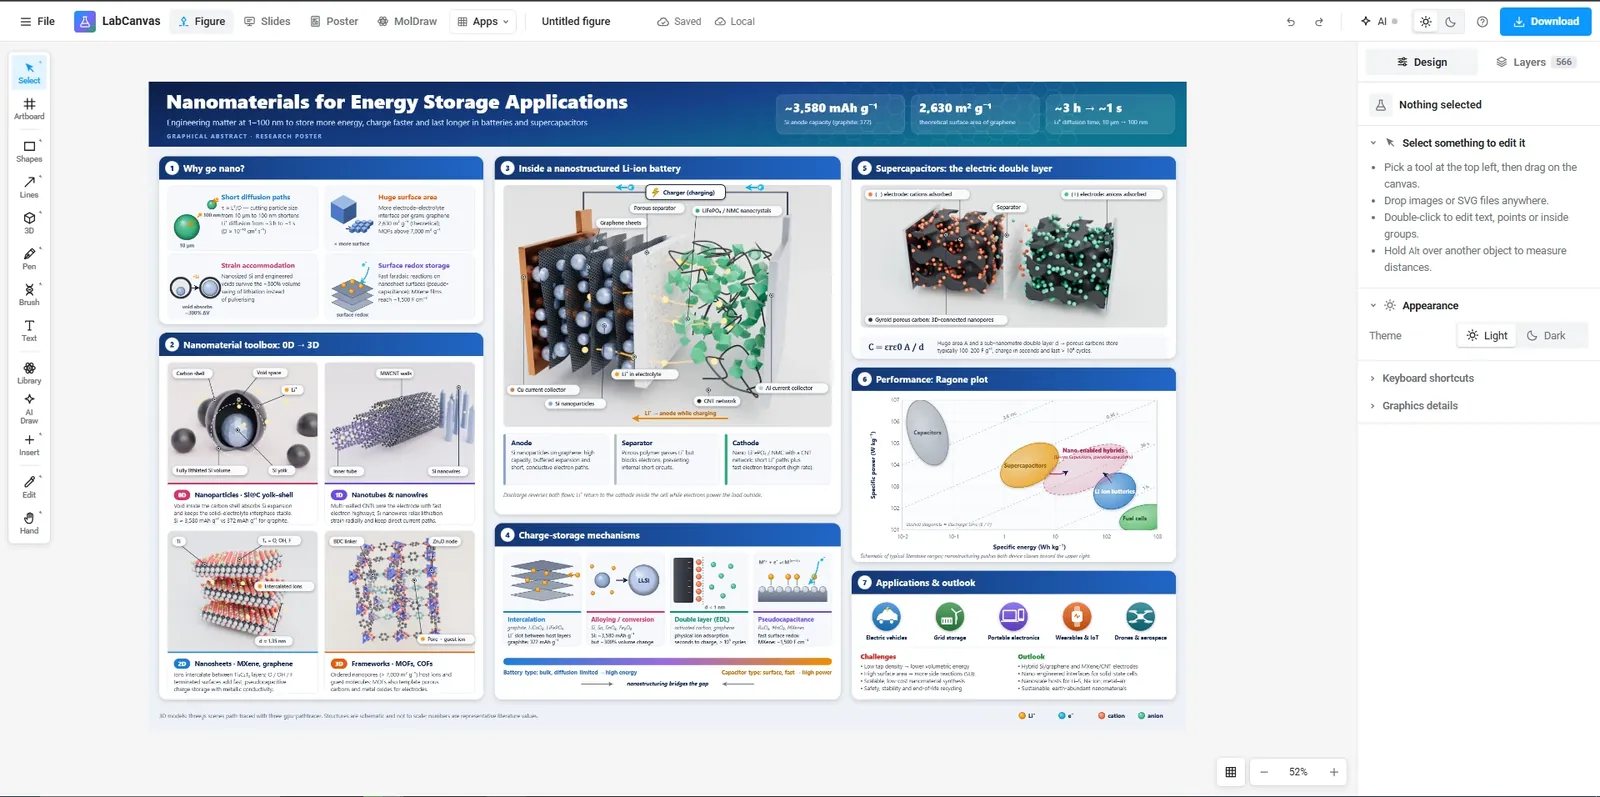
The LabCanvas Figure editor: vector scientific illustration in your browser
How to make journal figures and graphical abstracts in the LabCanvas Figure editor: vector tools, 700+ adjustable science objects, lab glassware that connects, LaTeX equations, and export at the width and DPI your journal asks for.
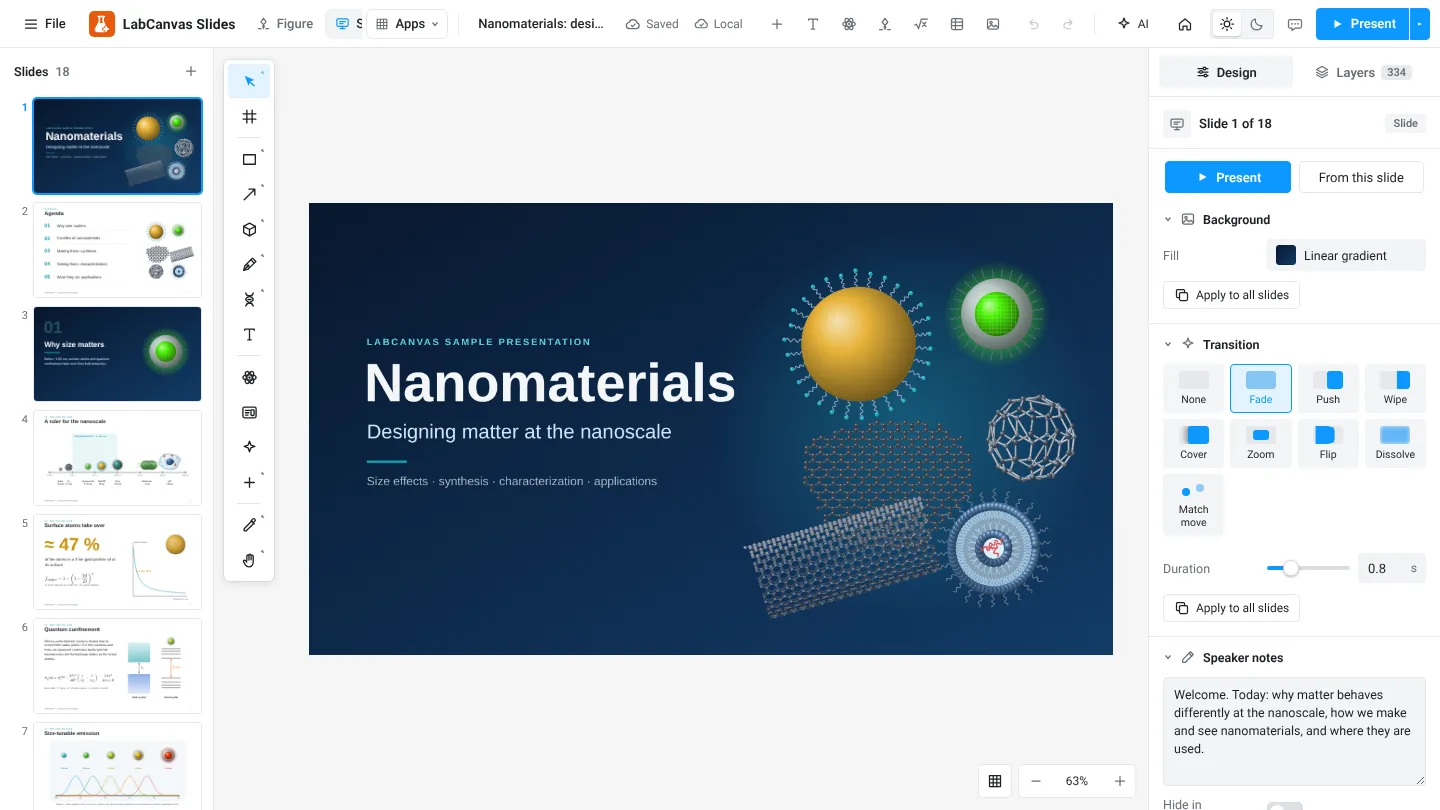
LabCanvas Slides: scientific presentations built from editable figures
How to build lab meetings, conference talks and lectures in LabCanvas Slides: a slide strip, layouts and themes, transitions and motion paths, speaker notes, full-screen presenting and a vector PDF of the deck.
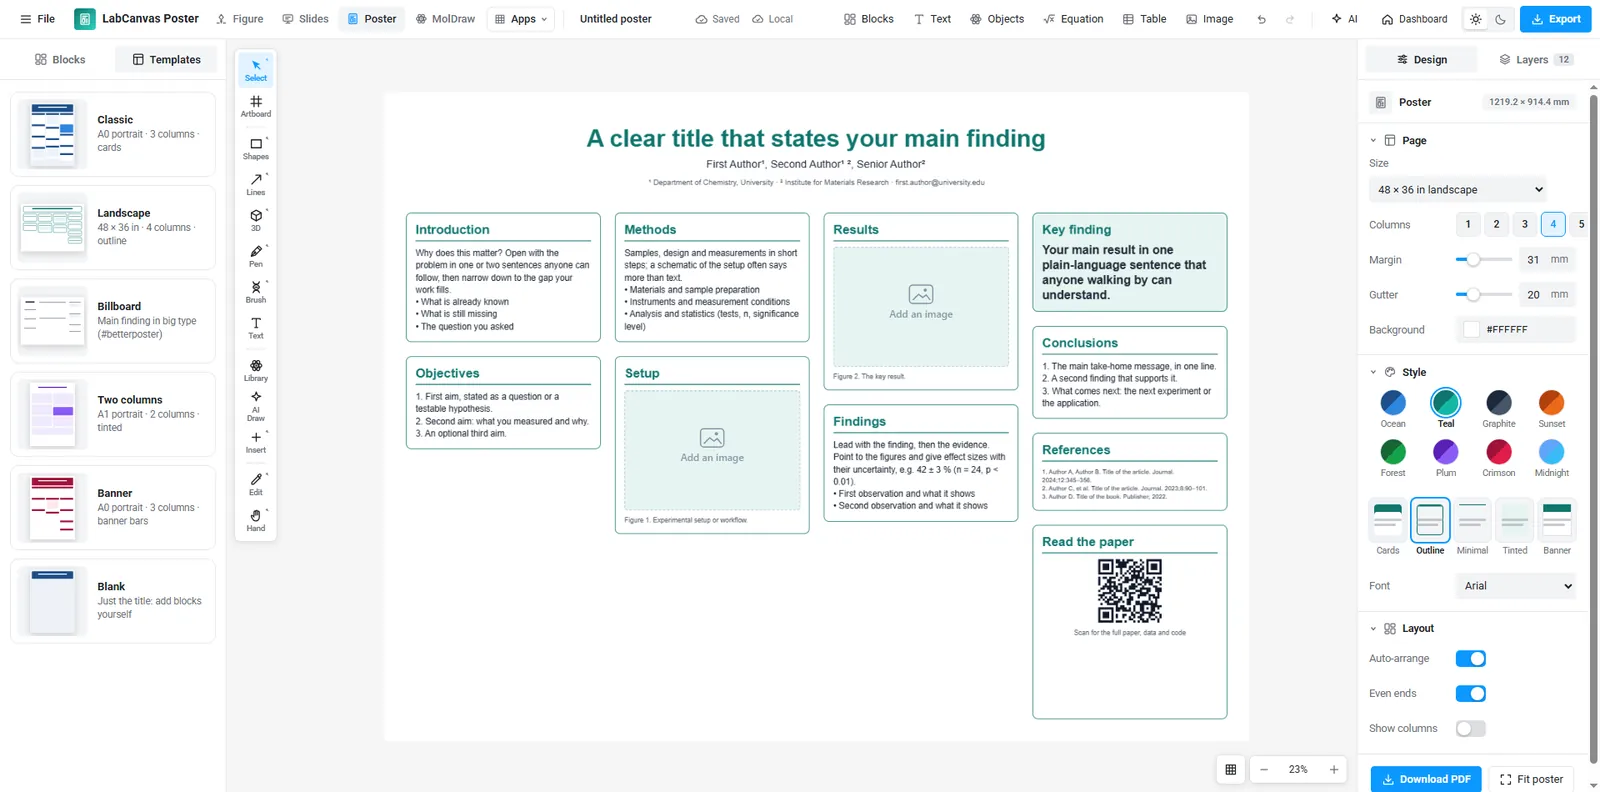
LabCanvas Research Poster: conference posters that arrange themselves
How to make an A0, A1 or 48 × 36 in research poster in LabCanvas Research Poster: blocks that stack in columns and re-flow their text, themes and block styles, QR codes, and a print-ready vector PDF.