LabCanvas Slides: scientific presentations built from editable figures
How to build lab meetings, conference talks and lectures in LabCanvas Slides: a slide strip, layouts and themes, transitions and motion paths, speaker notes, full-screen presenting and a vector PDF of the deck.
Contents
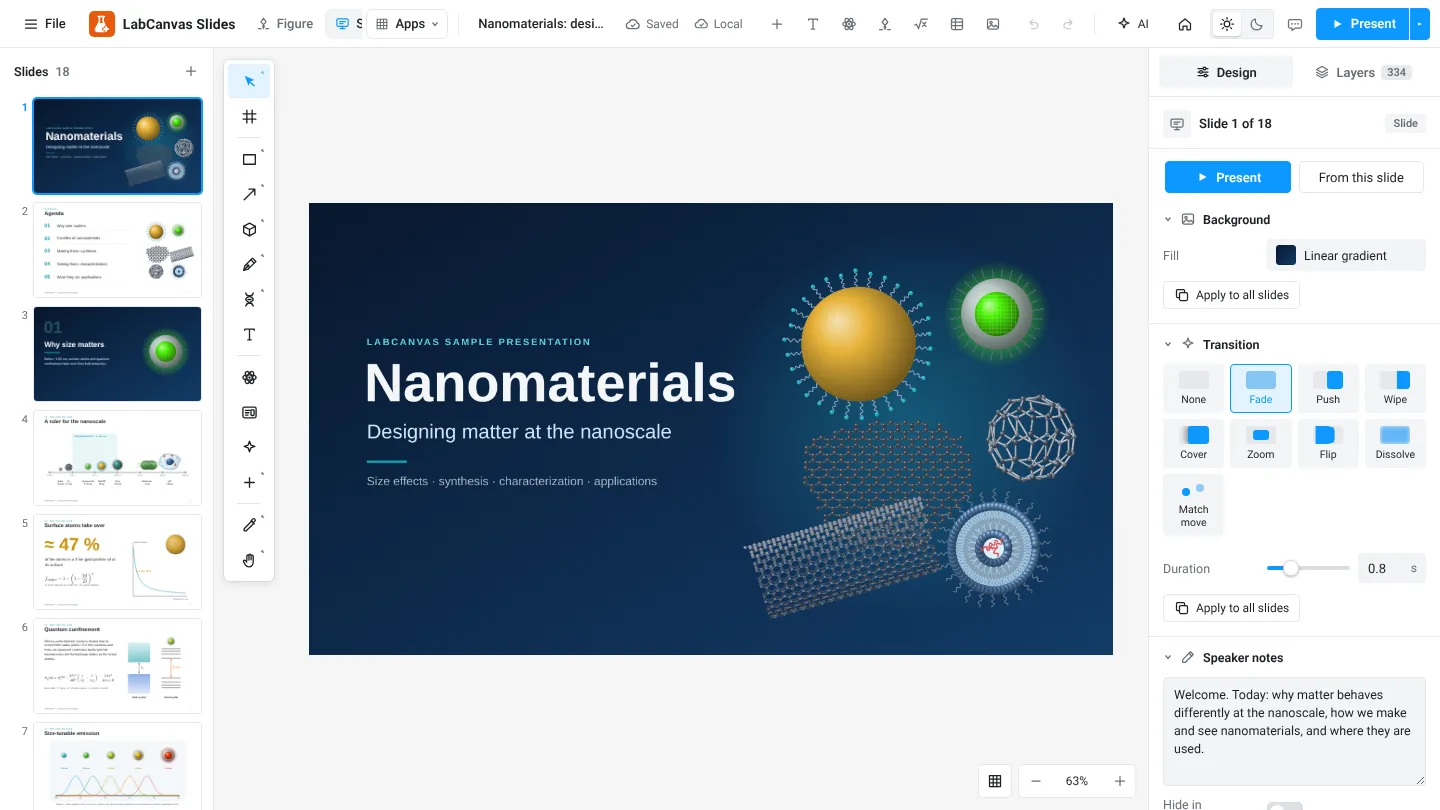
LabCanvas Slides is a presentation app built on the LabCanvas Figure editor. Every drawing tool, science object, equation and graph works on a slide, so the figures in a talk are the same editable figures as in the paper. It has a PowerPoint-style slide strip, layouts and themes, transitions with match move and motion paths, speaker notes, full-screen presenting and export of the whole deck as one vector PDF.
Why build talks on a figure editor
Scientific talks are mostly figures. In a usual workflow the figure is made in one program and pasted into PowerPoint as a picture, so every correction means going back, exporting again and replacing the picture. In Slides the figure stays a figure: change a colour, move a label or update a graph on the slide itself.
What is in the app
| Part | What it does |
|---|---|
| Slide strip | Add (Ctrl+M), duplicate, reorder and hide slides |
| Layouts and themes | Title, section, content and picture layouts; colour themes for the deck |
| Transitions | Fade, push, wipe, cover, zoom, flip, dissolve and match move |
| Builds and motion paths | Objects appear in steps and can travel along a path |
| Speaker notes | Notes per slide, shown while you present |
| Export | The whole deck as one vector PDF, or a slide as PNG |
How to build a talk
- Open Slides from the dashboard or the Apps menu.
- Add slides with Ctrl+M and pick a layout.
- Paste figures from the Figure editor, or draw on the slide with the same tools and Library.
- Choose a transition and write speaker notes in the slide panel.
- Press F5 to present, or export the deck as one PDF for the conference computer.
Figures that suit slides
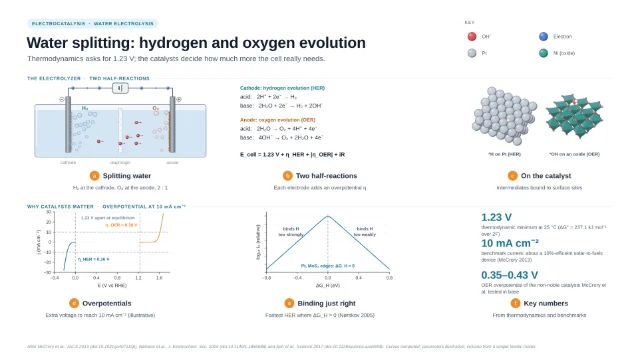
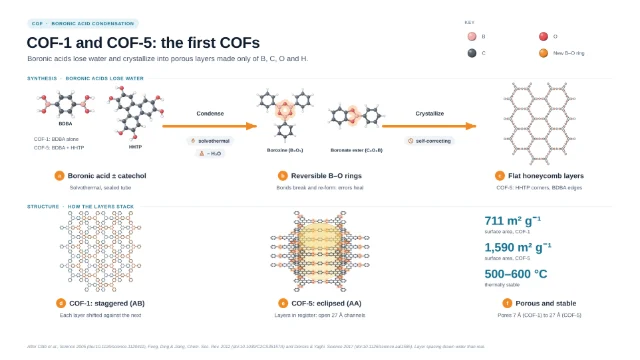
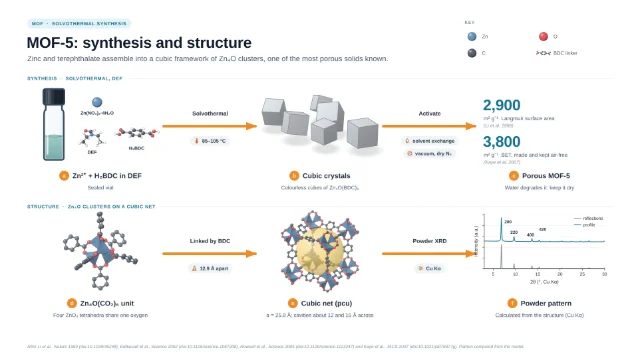
Graphical abstracts and schematics read well from the back of a room. Start from a template and simplify it for the slide.
Tips for scientific talks
- One message per slide: a title that states the finding, then the figure that shows it.
- Build complex figures in steps so the audience follows the logic.
- Use match move between two slides that show the same object to keep the viewer oriented.
- Export a PDF backup in case the conference computer has no internet connection.
Frequently asked questions
Can I open PowerPoint files in LabCanvas Slides?
Which transitions are there?
How do I present?
Can I reuse a figure from the Figure editor?
Is there a sample presentation?
Try it in LabCanvas
Every app is free to start in your browser. Create an account and begin.
Open SlidesKeep reading
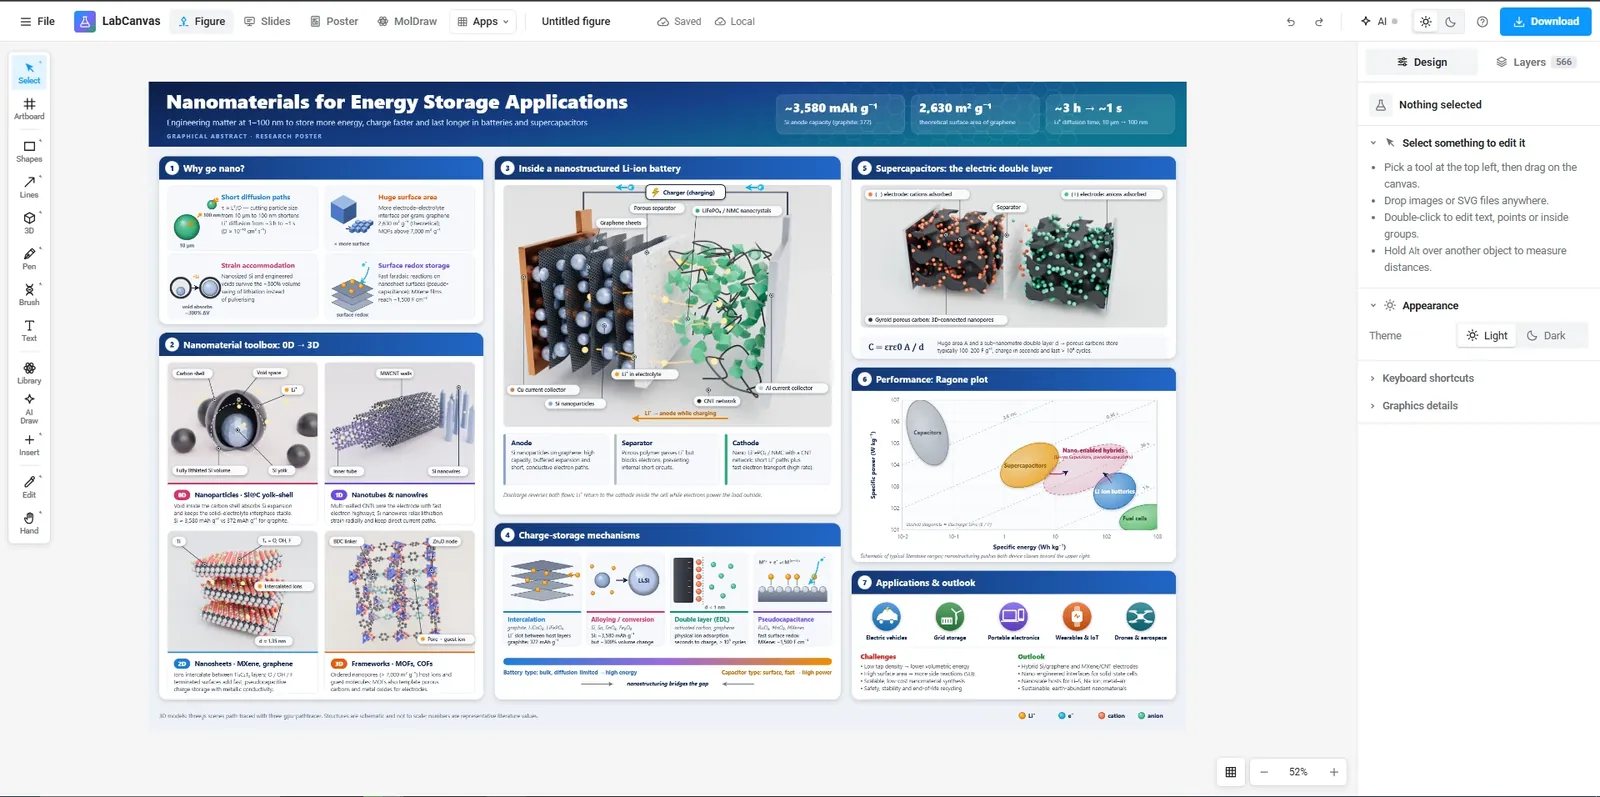
The LabCanvas Figure editor: vector scientific illustration in your browser
How to make journal figures and graphical abstracts in the LabCanvas Figure editor: vector tools, 700+ adjustable science objects, lab glassware that connects, LaTeX equations, and export at the width and DPI your journal asks for.
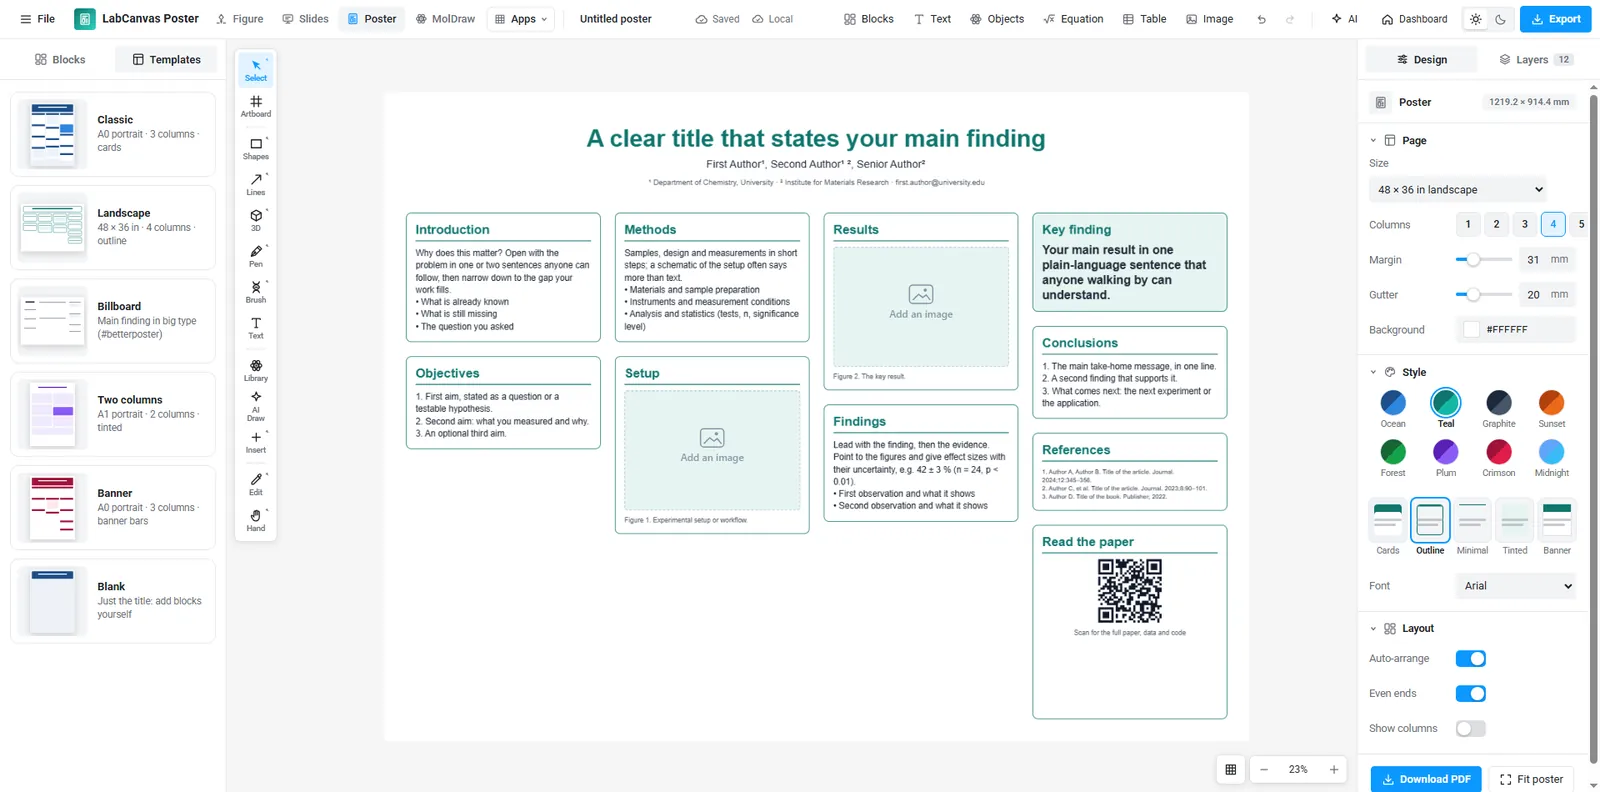
LabCanvas Research Poster: conference posters that arrange themselves
How to make an A0, A1 or 48 × 36 in research poster in LabCanvas Research Poster: blocks that stack in columns and re-flow their text, themes and block styles, QR codes, and a print-ready vector PDF.
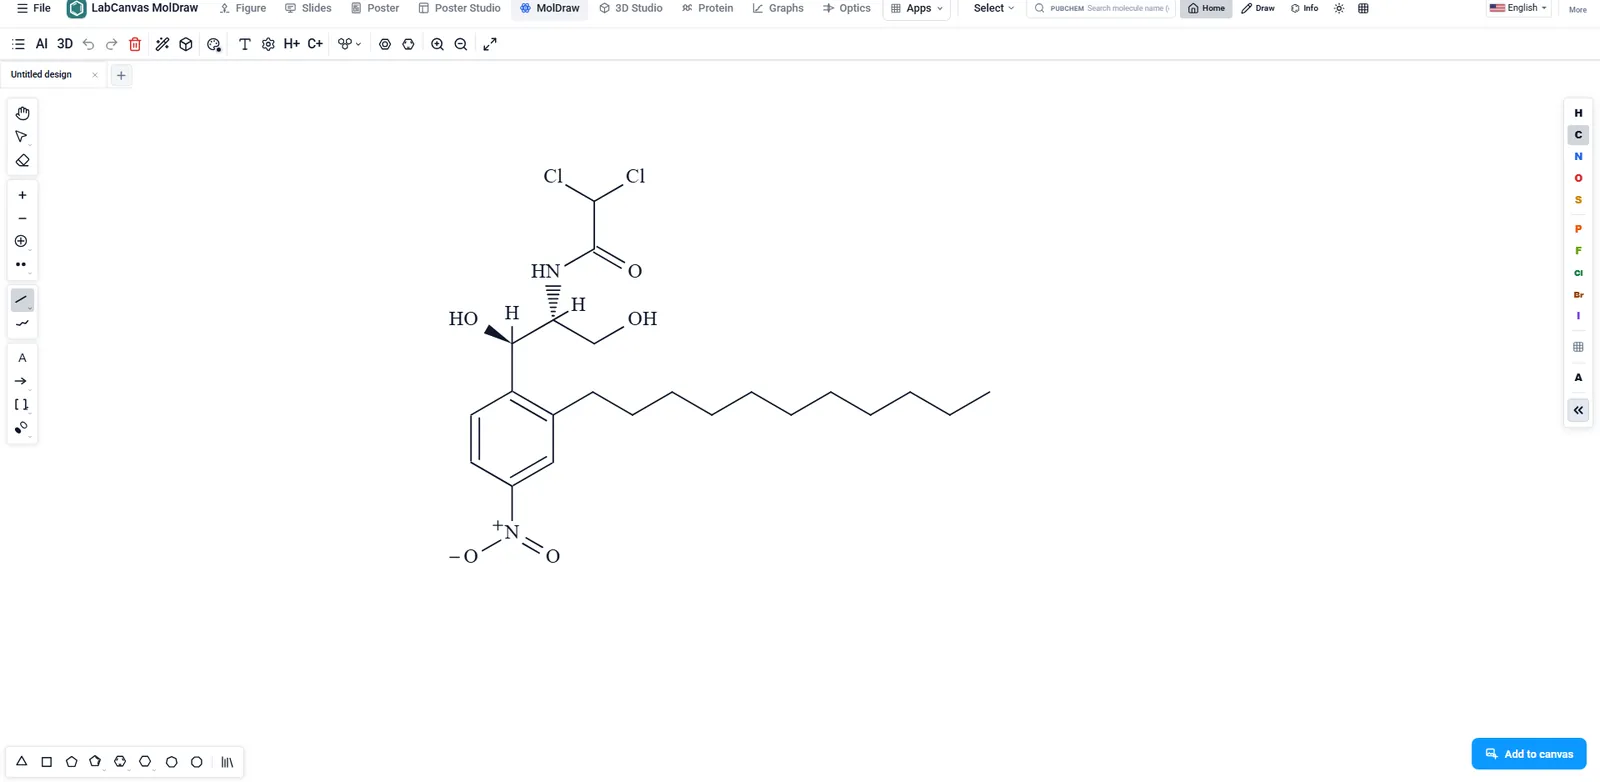
MolDraw: draw chemical structures and reactions, then see them in 3D
How to draw molecules and reaction schemes in LabCanvas MolDraw: atoms, bonds, rings and charges, reaction arrows, structures from PubChem, SMILES, a 3D view of the same molecule, and placing structures in figures.