The LabCanvas Figure editor: vector scientific illustration in your browser
How to make journal figures and graphical abstracts in the LabCanvas Figure editor: vector tools, 700+ adjustable science objects, lab glassware that connects, LaTeX equations, and export at the width and DPI your journal asks for.
Contents
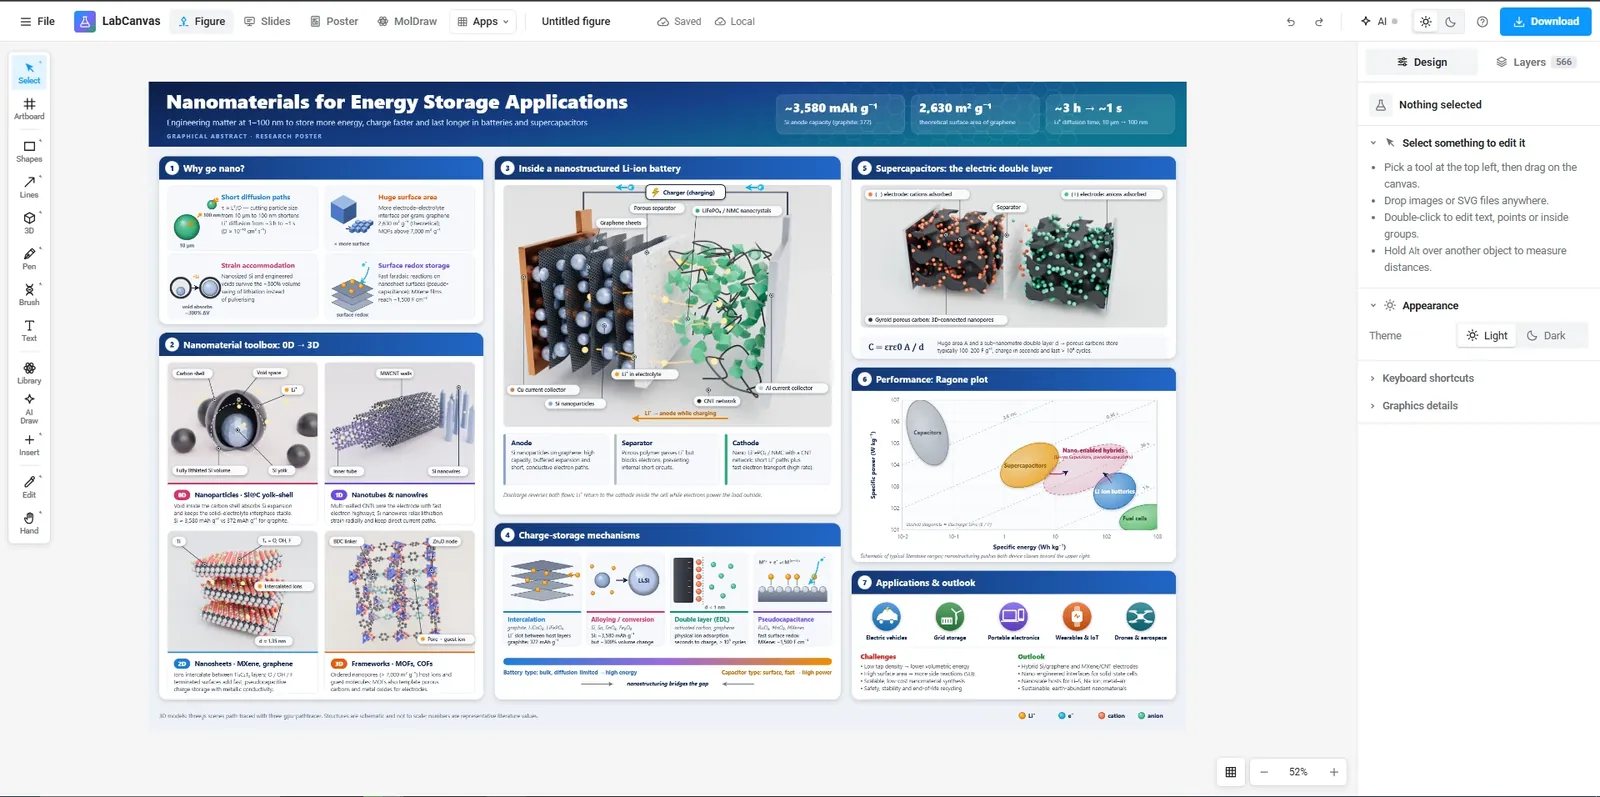
The LabCanvas Figure editor is a vector drawing app for scientific figures that runs in the browser. It combines the tools of a general illustration program (pen, Pathfinder, gradients, masks) with things scientists draw every week: 700+ adjustable science objects, lab glassware that snaps together, scientific brushes such as a DNA double helix, LaTeX equations and tables. Figures export at the exact width and resolution a journal asks for.
What you can make with it
The editor is built for the figures that go into papers, theses and grant applications:
- Graphical abstracts and TOC graphics, drawn from objects and arrows, or started from a template.
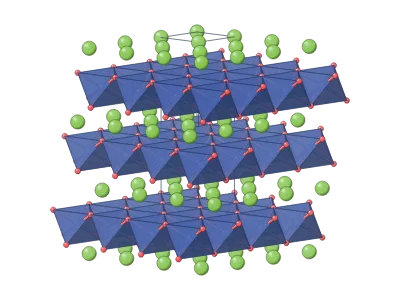
- Schematics of syntheses and devices: a reaction flask on a hot plate, a coin cell, a membrane module.
- Mechanism figures with molecules from PubChem, proteins from the PDB and labelled pathways.
- Multi-panel figures with panel letters, aligned graphs from Graphs & statistics and micrographs edited in the Pixel editor.
Science objects you can adjust
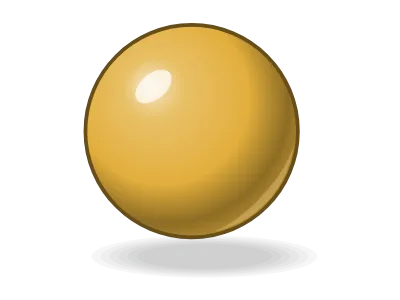
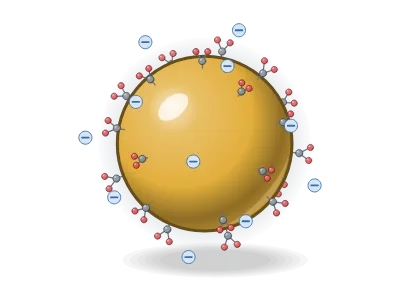
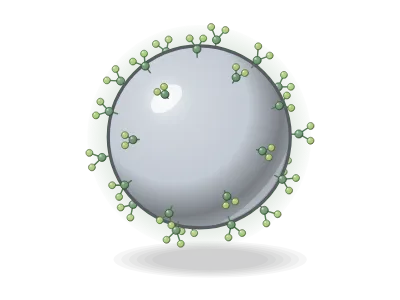
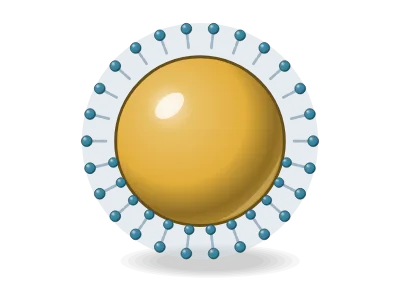
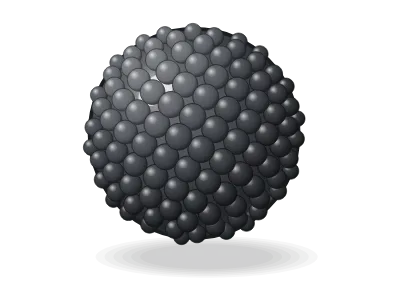
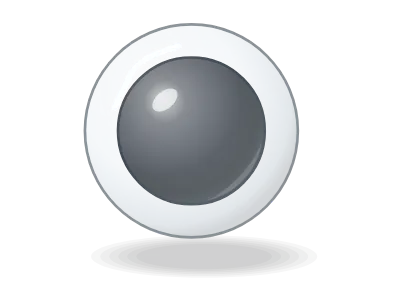
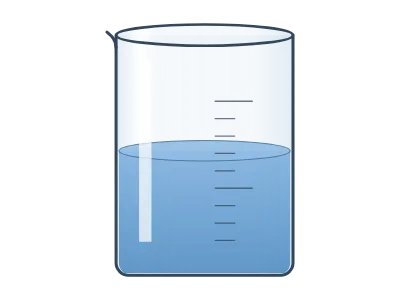
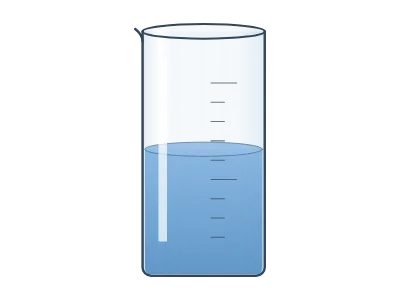
Every object in the Library is drawn by a generator: a small program that turns settings into a drawing. A liposome has settings for its size, its bilayer and its cargo; a nanoparticle for its core, shell and ligands; a beaker for its volume, graduations and liquid. Change a setting and the drawing follows, so one object covers many variants.
Nanomaterials
Lab glassware and instruments
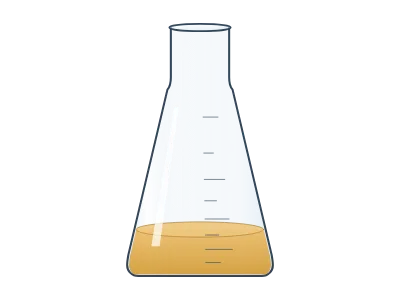
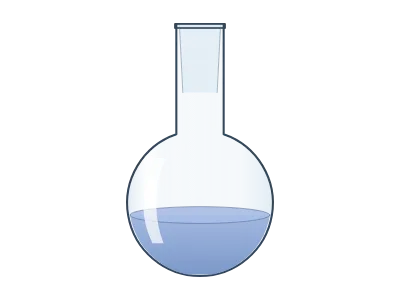
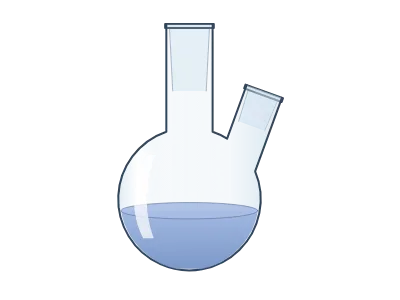
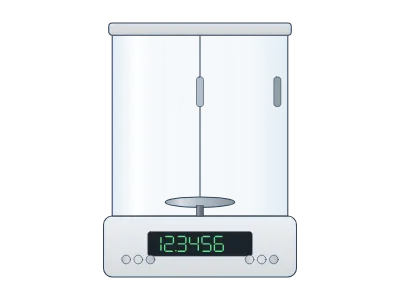
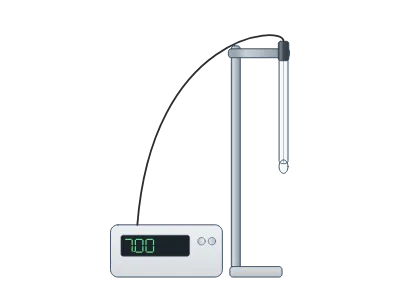
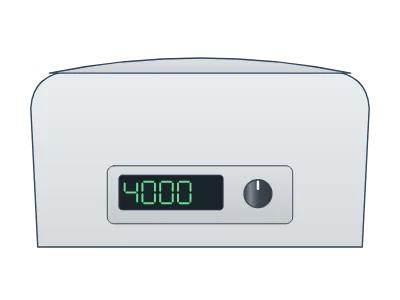
Glassware is drawn at real proportions. Joints snap onto each other and tubing follows the hose barbs, so a distillation or Schlenk setup stays assembled while you move it.

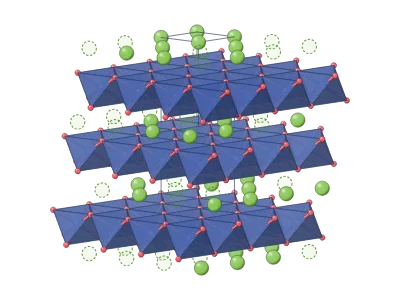
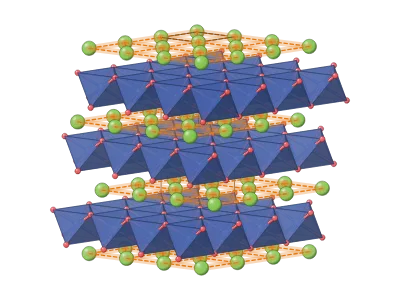
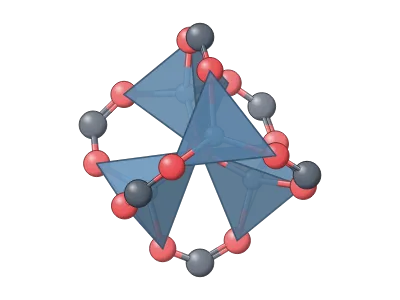
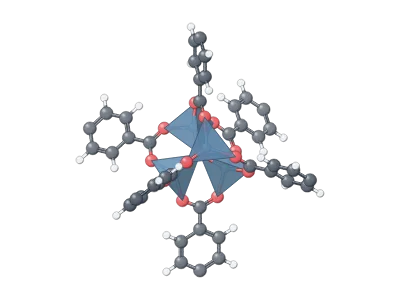
Batteries, devices and frameworks
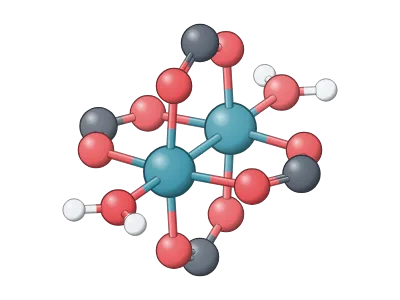
Tools for vector drawing
| Tool | What it does |
|---|---|
| Pen and pencil | Bézier paths, smoothed freehand lines |
| Pathfinder | Union, subtract, intersect, divide and more |
| Scientific brushes | DNA (B, A or Z form), RNA, α-helices, β-strands, lipid bilayers and bead chains along any path |
| Equations | LaTeX typeset into vector outlines, chemistry with mhchem |
| Tables | Editable tables with booktabs styles |
| Lens | A magnifier callout that enlarges part of the figure |
| Artboards | Several figures, or several panels, on one canvas |
How to make a journal figure, step by step
- Open the dashboard and start a new figure, or open a template.
- Press Shift+O (or click Library) and drag objects onto the canvas; adjust them in the Design panel.
- Draw arrows and labels with the Arrow and Text tools; group each panel.
- Add panel letters and align the panels with Arrange.
- Click Download, choose TIFF or PDF, the column width in millimetres and 300–600 dpi.
Templates of real work
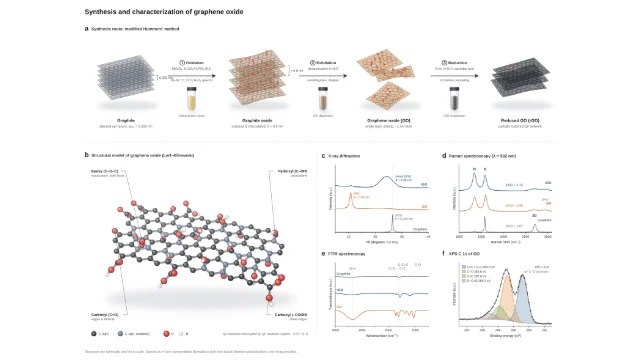
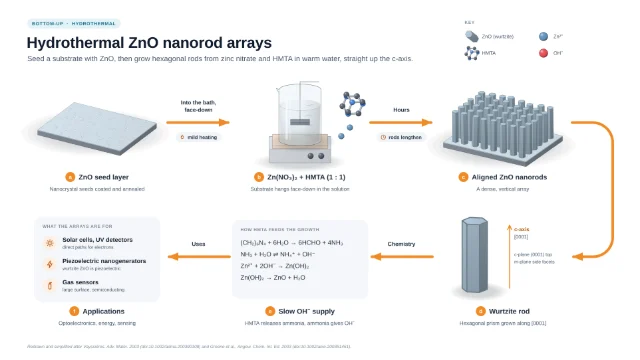
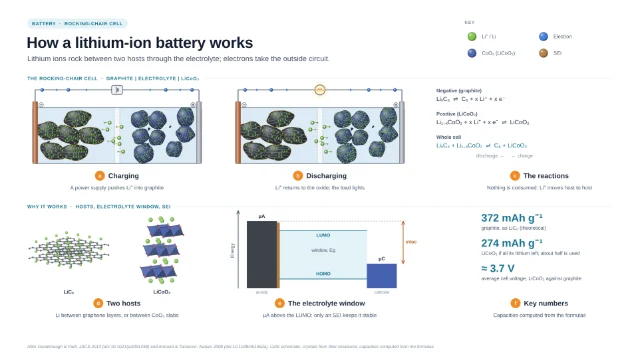
The template library holds graphical abstracts of published syntheses and devices, each built from editable objects and listing the papers it follows. Open one and it becomes your own copy.
How it fits with the other apps
The Figure editor is the shared canvas of LabCanvas. Slides and Research Poster use the same editor, so a figure moves onto a slide or a poster without exporting it. Renders from the 3D Studio, setups from Optics and graphs from Graphs & statistics arrive as layers you can still change.
Frequently asked questions
Is the LabCanvas Figure editor free?
Which file formats can I export for a journal?
Can I edit the science objects after I place them?
Can I draw a molecule or add a protein?
Does it work like Adobe Illustrator?
Try it in LabCanvas
Every app is free to start in your browser. Create an account and begin.
Open Figure editorKeep reading
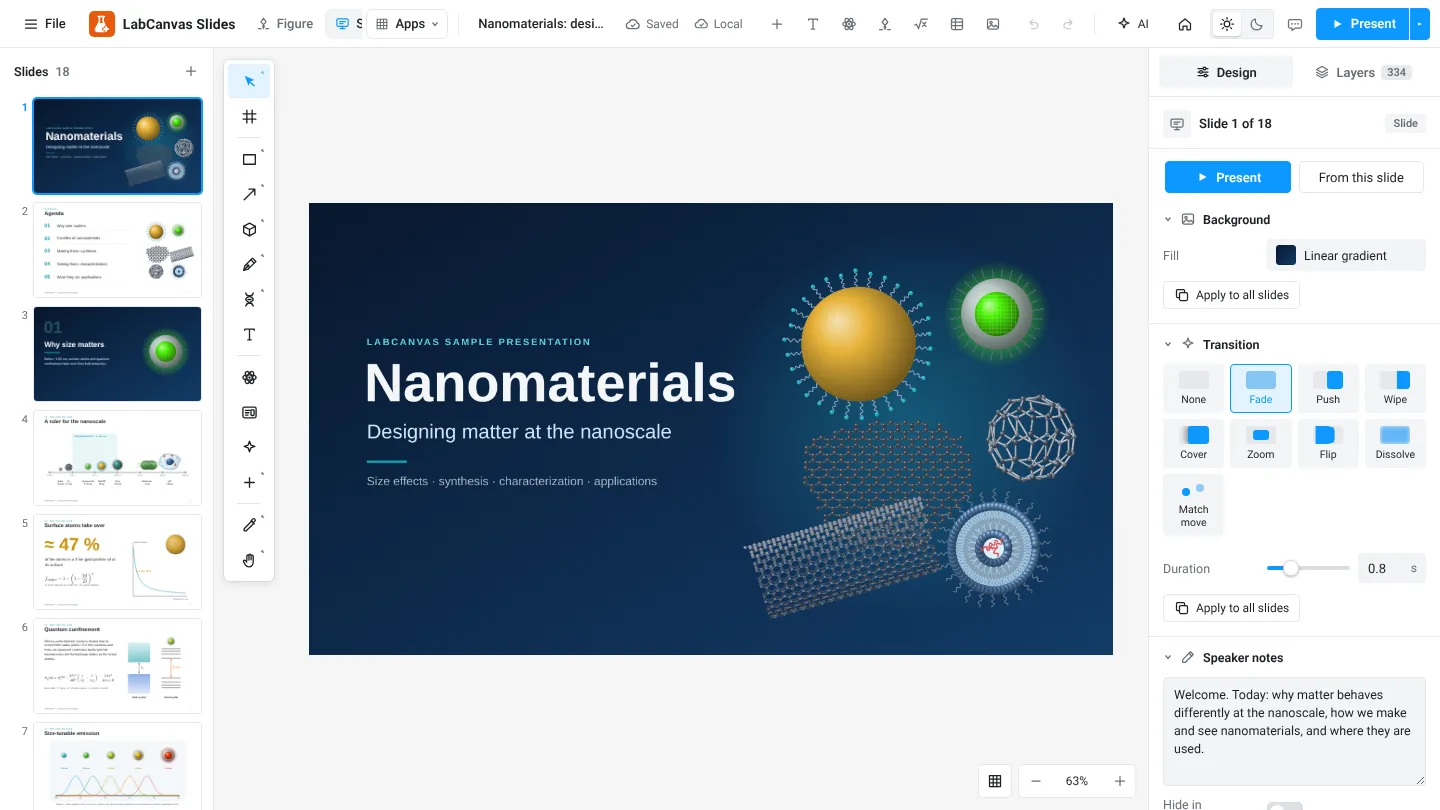
LabCanvas Slides: scientific presentations built from editable figures
How to build lab meetings, conference talks and lectures in LabCanvas Slides: a slide strip, layouts and themes, transitions and motion paths, speaker notes, full-screen presenting and a vector PDF of the deck.
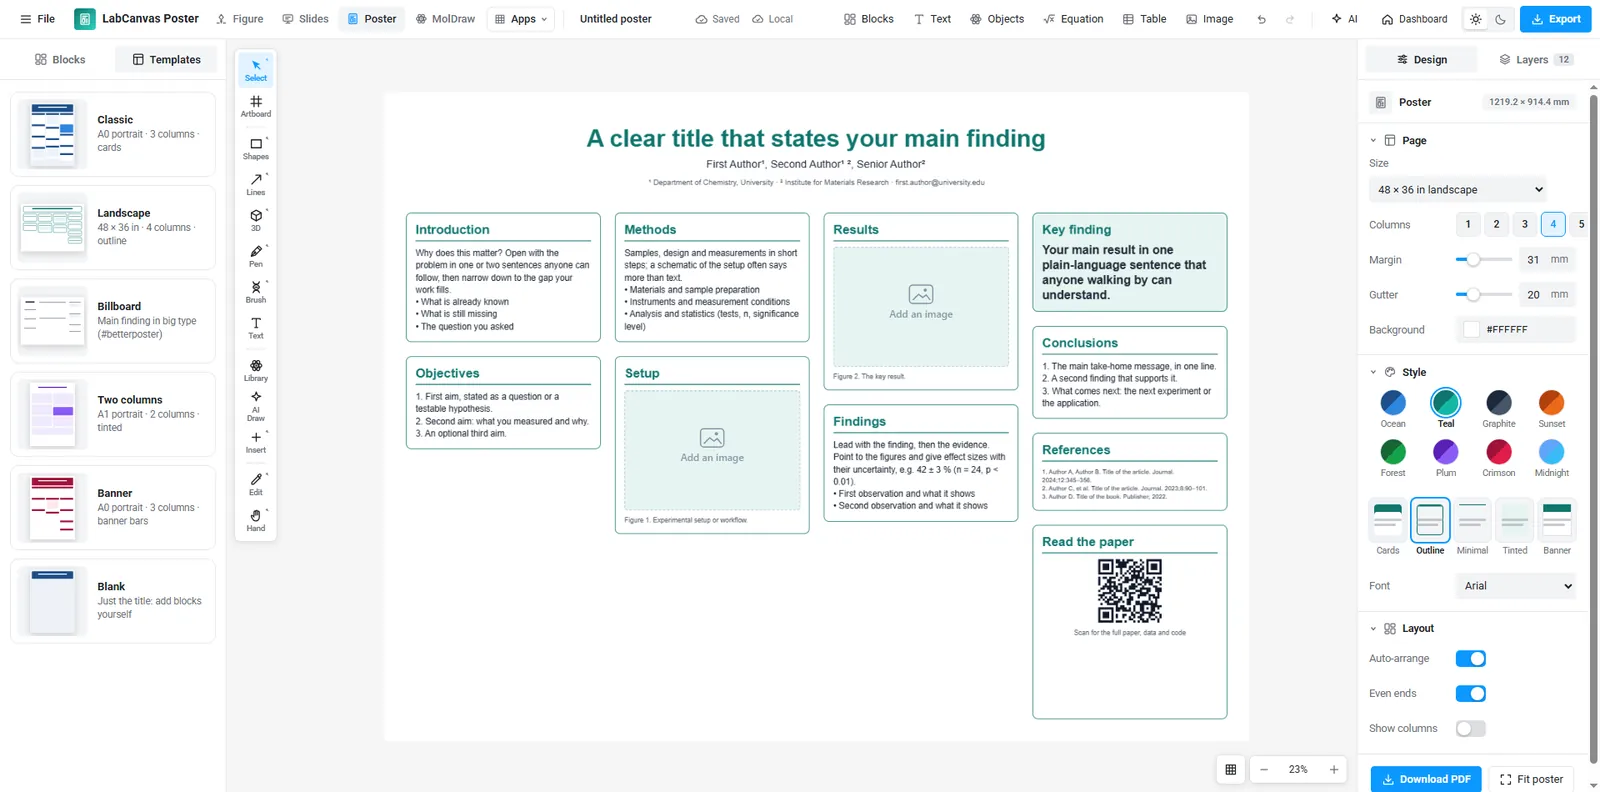
LabCanvas Research Poster: conference posters that arrange themselves
How to make an A0, A1 or 48 × 36 in research poster in LabCanvas Research Poster: blocks that stack in columns and re-flow their text, themes and block styles, QR codes, and a print-ready vector PDF.
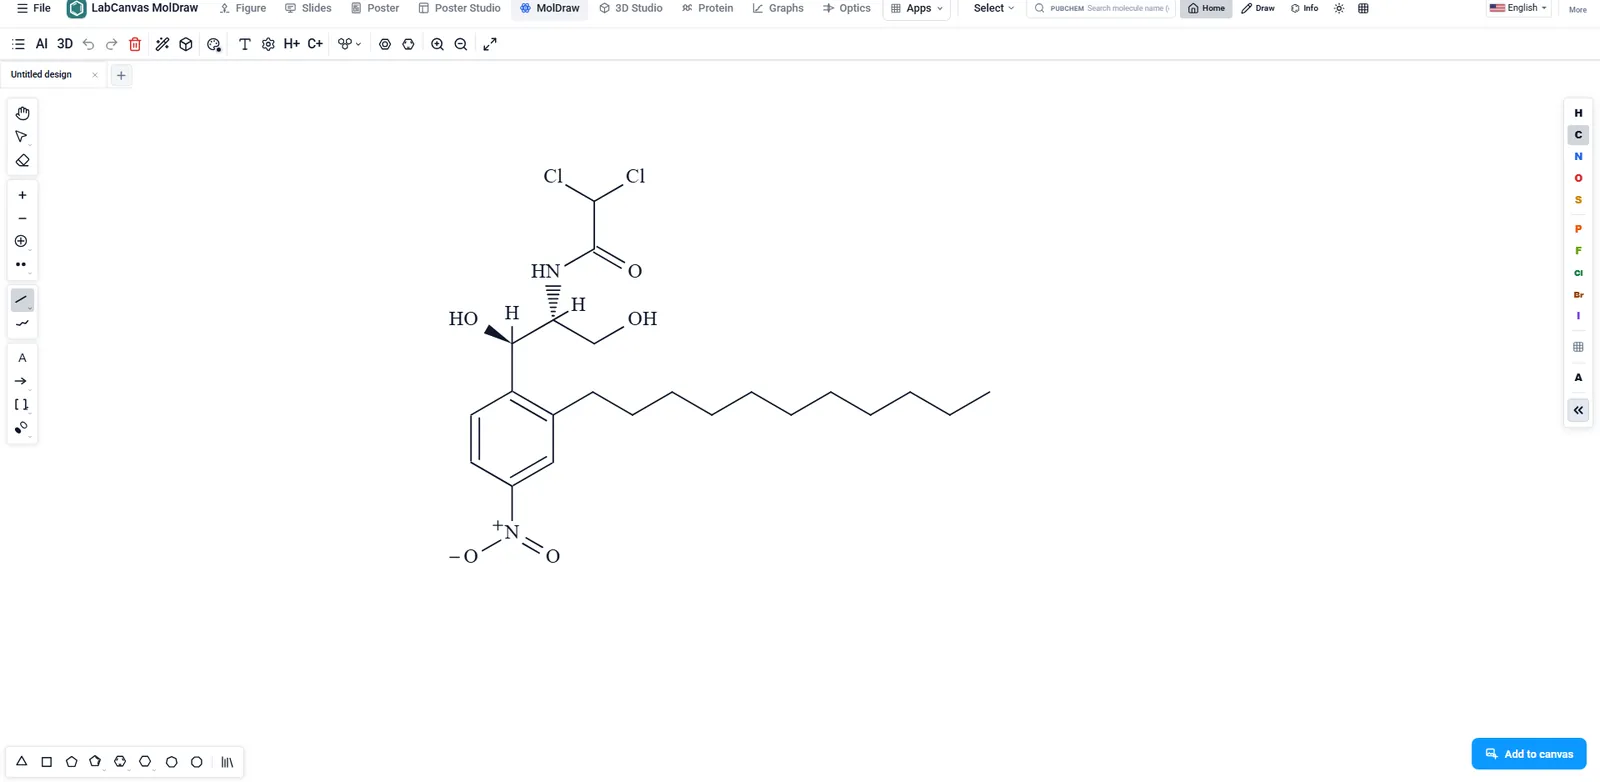
MolDraw: draw chemical structures and reactions, then see them in 3D
How to draw molecules and reaction schemes in LabCanvas MolDraw: atoms, bonds, rings and charges, reaction arrows, structures from PubChem, SMILES, a 3D view of the same molecule, and placing structures in figures.