Graphical abstract template · Multipanel figures · Worked examples
Four-panel figure: battery cathode performance
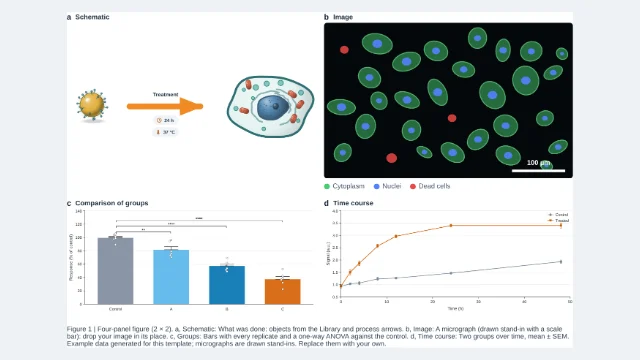
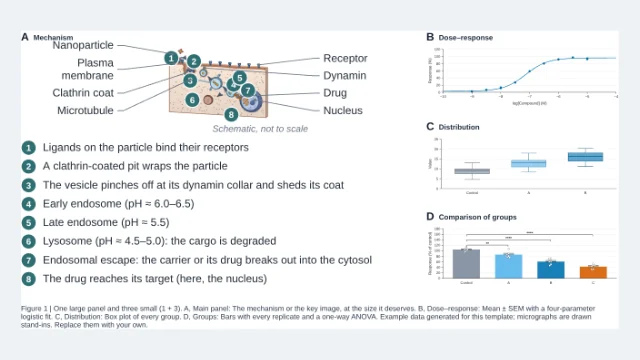
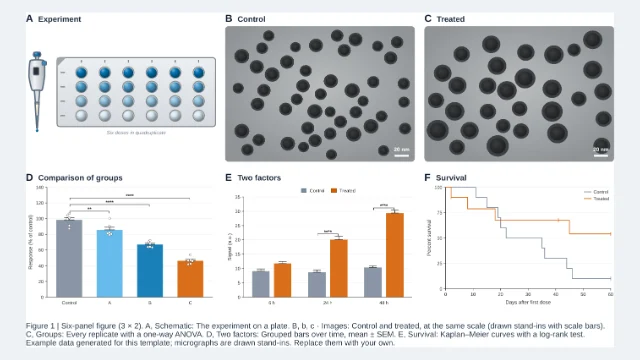
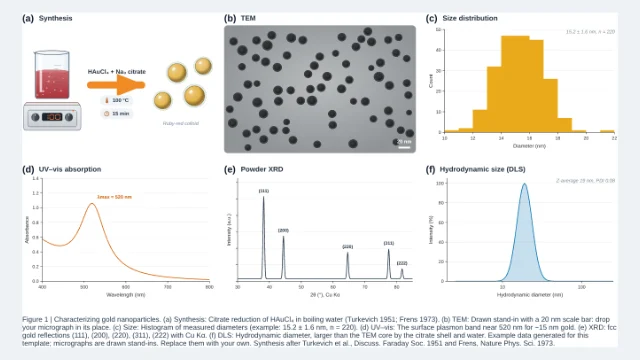
An electrochemistry figure for a cathode material: the cell, discharge profiles over cycling, capacity at rising C-rates and back, and long-term cycling with Coulombic efficiency on a second axis.
Updated 2 cited papers24 editable layers

At a glance
- Category
- Multipanel figures
- Method
- Worked examples
- Product
- A 2 × 2 figure (a–d) for a battery-materials paper
- Key result
- Example curves from simple models with capacities typical of Ni-rich NMC (about 200 mAh g⁻¹ at 0.1C); not measurements
- Figure
- 646.3 × 399.16 px (16:9), 24 editable layers, 1 generated objects
Step by step
- a · CellThe cell and its parts (graphite anode, layered-oxide cathode, liquid electrolyte)
- b · ProfilesDischarge curves at cycles 1, 50 and 100 between 3.0 and 4.3 V
- c · RateCapacity at 0.1C to 5C and back to 0.1C
- d · CyclingCapacity retention and Coulombic efficiency (right axis) over 200 cycles
Strengths
- The four panels most battery papers show
- Two-axis cycling graph ready to edit
Limitations
- Example values only
Uses
- Cathode and anode papers
- Electrolyte and coating studies
Papers this template follows
- Noh, Youn, Yoon & Sun, “Comparison of the structural and electrochemical properties of layered Li[NixCoyMnz]O2 (x = 1/3, 0.5, 0.6, 0.7, 0.8 and 0.85) cathode material for lithium-ion batteries”, J. Power Sources 2013. doi:10.1016/j.jpowsour.2013.01.063primary
- Rougier, Droettboom & Bourne, “Ten simple rules for better figures”, PLoS Comput. Biol. 2014. doi:10.1371/journal.pcbi.1003833review
Example data generated for this template. Replace it with your own. Capacity scale after Noh et al., J. Power Sources 2013.
How templates are written and checked: editorial guidelines.
Questions
What does the “Four-panel figure: battery cathode performance” template show?
An electrochemistry figure for a cathode material: the cell, discharge profiles over cycling, capacity at rising C-rates and back, and long-term cycling with Coulombic efficiency on a second axis.
What are the steps shown in “Four-panel figure: battery cathode performance”?
1. a · Cell: The cell and its parts (graphite anode, layered-oxide cathode, liquid electrolyte). 2. b · Profiles: Discharge curves at cycles 1, 50 and 100 between 3.0 and 4.3 V. 3. c · Rate: Capacity at 0.1C to 5C and back to 0.1C. 4. d · Cycling: Capacity retention and Coulombic efficiency (right axis) over 200 cycles.
Which papers is “Four-panel figure: battery cathode performance” based on?
Noh, Youn, Yoon & Sun, “Comparison of the structural and electrochemical properties of layered Li[NixCoyMnz]O2 (x = 1/3, 0.5, 0.6, 0.7, 0.8 and 0.85) cathode material for lithium-ion batteries”, J. Power Sources 2013 (doi:10.1016/j.jpowsour.2013.01.063); Rougier, Droettboom & Bourne, “Ten simple rules for better figures”, PLoS Comput. Biol. 2014 (doi:10.1371/journal.pcbi.1003833).
Can I edit the “Four-panel figure: battery cathode performance” template?
Yes. Open it in the LabCanvas editor: all 24 layers are editable, including 1 generated objects (structures, plots, equipment) with their own settings. Change the text, colours and layout, then export PNG, TIFF, SVG or PDF.
Do I need an account to use this template?
Not to view it here. To open and edit it, sign in to LabCanvas or create a free account (the free plan keeps up to 3 designs). Downloading the figure is part of LabCanvas Pro (US$19 a month or US$199 a year).