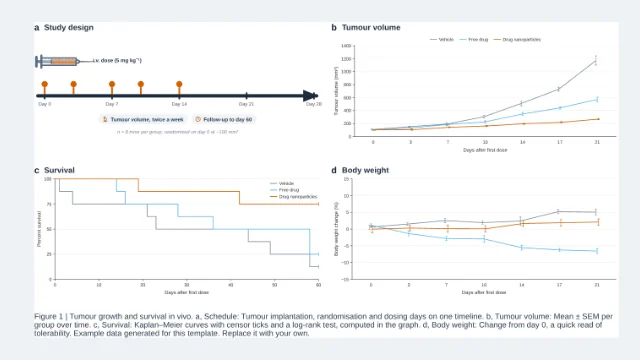
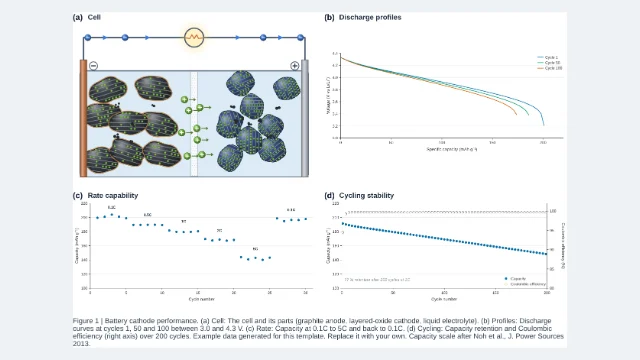
Graphical abstract template · Multipanel figures · Layouts
One large panel and three small (1 + 3)
A large panel for the main schematic or image on the left, and three graphs stacked on the right: the layout for a figure that leads with a mechanism and backs it with data.
Updated 2 cited papers17 editable layers

At a glance
- Category
- Multipanel figures
- Method
- Layouts
- Product
- A figure with one large panel (a) and three stacked panels (b–d)
- Key result
- Neutral example data
- Figure
- 657.64 × 404.58 px (16:9), 17 editable layers, 1 generated objects
Step by step
- a · Main panelThe mechanism or the key image, at the size it deserves
- b · Dose–responseMean ± SEM with a four-parameter logistic fit
- c · DistributionBox plot of every group
- d · GroupsBars with every replicate and a one-way ANOVA
Strengths
- Panels aligned on one grid with the same letter style
- Graphs linked to their data: double-click to edit
Limitations
- Example content: replace every panel with your own
Uses
- Papers, theses and grant applications
- Supporting information
Papers this template follows
- Rougier, Droettboom & Bourne, “Ten simple rules for better figures”, PLoS Comput. Biol. 2014. doi:10.1371/journal.pcbi.1003833review
- Weissgerber, Milic, Winham & Garovic, “Beyond bar and line graphs: time for a new data presentation paradigm”, PLoS Biol. 2015. doi:10.1371/journal.pbio.1002128review
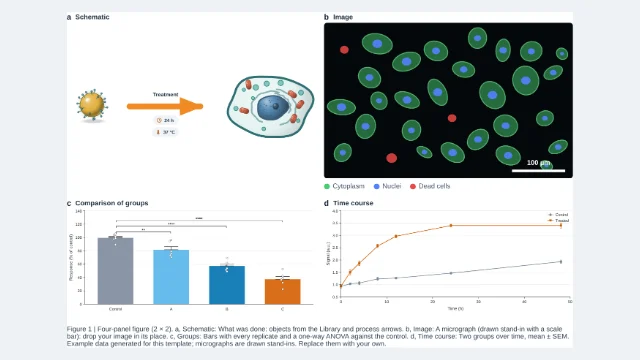
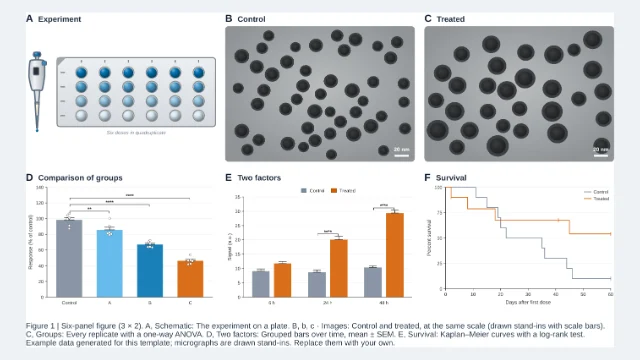
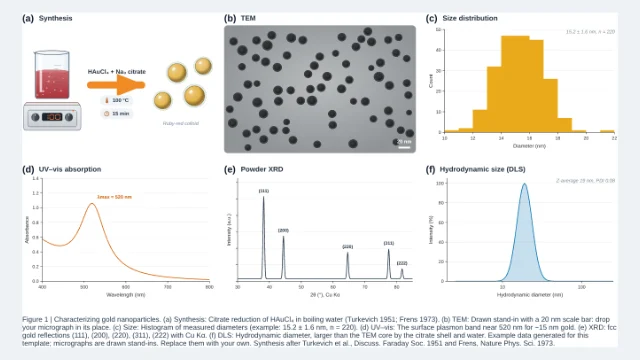
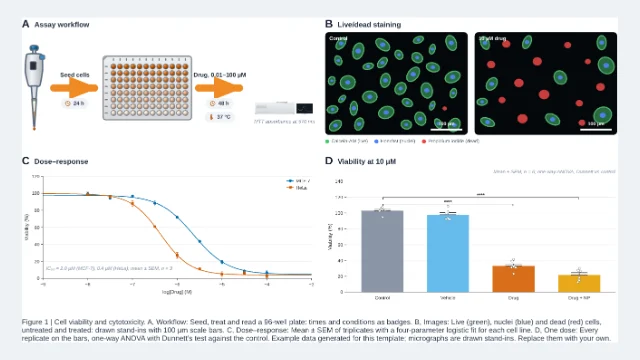
Example data generated for this template; micrographs are drawn stand-ins. Replace them with your own.
How templates are written and checked: editorial guidelines.
Questions
What does the “One large panel and three small (1 + 3)” template show?
A large panel for the main schematic or image on the left, and three graphs stacked on the right: the layout for a figure that leads with a mechanism and backs it with data.
What are the steps shown in “One large panel and three small (1 + 3)”?
1. a · Main panel: The mechanism or the key image, at the size it deserves. 2. b · Dose–response: Mean ± SEM with a four-parameter logistic fit. 3. c · Distribution: Box plot of every group. 4. d · Groups: Bars with every replicate and a one-way ANOVA.
Which papers is “One large panel and three small (1 + 3)” based on?
Rougier, Droettboom & Bourne, “Ten simple rules for better figures”, PLoS Comput. Biol. 2014 (doi:10.1371/journal.pcbi.1003833); Weissgerber, Milic, Winham & Garovic, “Beyond bar and line graphs: time for a new data presentation paradigm”, PLoS Biol. 2015 (doi:10.1371/journal.pbio.1002128).
Can I edit the “One large panel and three small (1 + 3)” template?
Yes. Open it in the LabCanvas editor: all 17 layers are editable, including 1 generated objects (structures, plots, equipment) with their own settings. Change the text, colours and layout, then export PNG, TIFF, SVG or PDF.
Do I need an account to use this template?
Not to view it here. To open and edit it, sign in to LabCanvas or create a free account (the free plan keeps up to 3 designs). Downloading the figure is part of LabCanvas Pro (US$19 a month or US$199 a year).