Graphical abstract template · Nanomaterial guides · Composition and structure
What nanoparticles are made of: STEM, ICP-MS and magnetometry
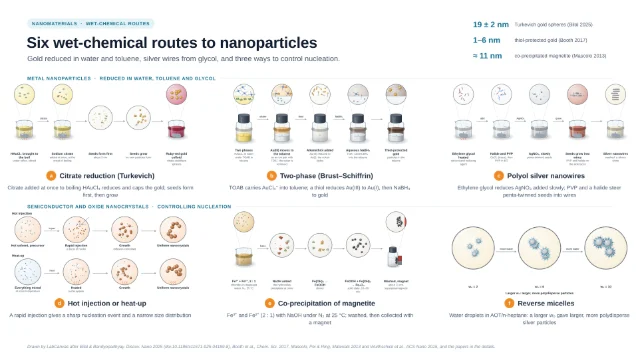
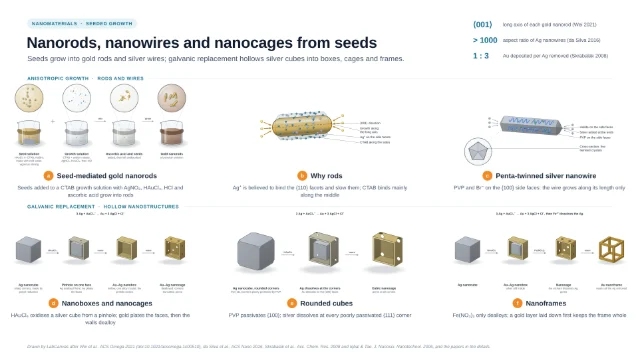
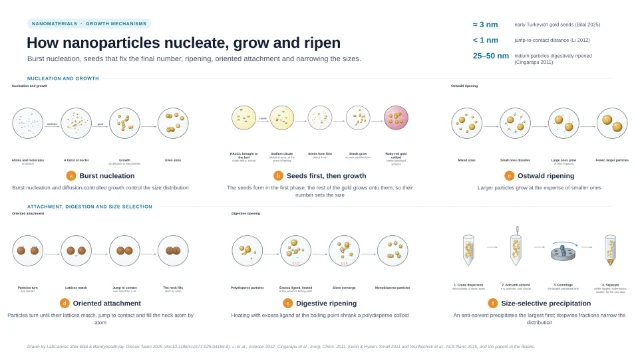
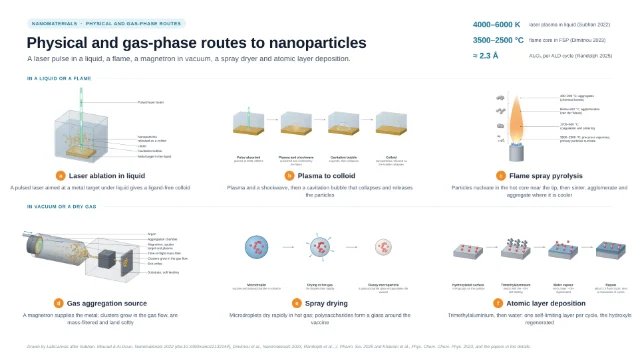
Six principles for finding what nanoparticles are made of and how their elements are arranged: preparing a TEM grid, HAADF-STEM with its Z-contrast, EDS detectors around the specimen, ICP-MS from acid digestion to the plasma, single-particle ICP-MS and the vibrating-sample magnetometer. Instruments and principles only, with every caption quoted from the cited papers.
Updated 10 cited papers45 editable layers

At a glance
- Category
- Nanomaterial guides
- Method
- Composition and structure
- Starting materials
- Nanoparticles drop-cast on a grid, digested in acid, or held still in a magnetometer
- Product
- Arrangement of the elements in each particle, the metal content, particle mass and number, and the magnetisation
- Key result
- Instruments and principles drawn by LabCanvas from the cited papers; no micrograph, spectrum or magnetisation loop is shown
- Figure
- 1920 × 1080 px (16:9), 45 editable layers, 6 generated objects
Step by step
- Preparing a TEM gridA drop of the dispersion on a 3 mm Au grid coated with a holey carbon film, the grid on a tissue that absorbed the liquid flowing through the film, left to dry in air for a few minutes; smaller particles tend to settle on the film, biasing TEM sizes toward smaller particles, and aggregates can come from drying (Tuoriniemi 2014)
- HAADF-STEMCombined with EDX mapping, the atomic-number (Z) contrast of HAADF-STEM characterises how the two metals are arranged in bimetallic Pd–Au particles, and HAADF-STEM tomography shows them in 3D (Tran 2012); Z-contrast can read nanoparticle barcodes built from different elements (Chen 2015)
- Mapping the elementsX-ray (XEDS) detectors can be arranged symmetrically around the specimen; XEDS adds information where Z-contrast is low (Genc 2013)
- ICP-MSAu nanoparticles and Au–Ag nanoshells were mineralised in aqua regia with HF at 65 °C for 4 h (Faucher 2018); CTAB-capped gold nanorods were decomposed in a microwave with reverse aqua regia and H₂SO₄ (Godoy 2021); tissues were homogenised and lysed with aqua regia (Sonavane 2008). After dilution the liquid is nebulised with argon; the aerosol passes a spray chamber (90–98 % ends as waste) to the plasma (≈ 7500 K), where it is desolvated, vaporised, atomised and ionised, and the ions are separated by mass-to-charge ratio (Resano 2022)
- Single-particle ICP-MSEach particle that reaches the plasma gives a burst of ions, detected as a short pulse above the background; the pulse intensity is proportional to the mass of the analyte in the particle and the number of pulses to the number concentration; transport efficiency is never 100 % (Resano 2022)
- Vibrating-sample magnetometryVSM and SQUID magnetometry measure the magnetisation of magnetic nanoparticles under varying magnetic fields and temperatures (Amorim 2025); in lymph nodes the iron content was quantified from the magnetic moment curve with the Langevin model, the tissue fixed tightly and the vibration amplitude kept small (Visscher 2013)
Limitations
- TEM sizes are biased toward smaller particles, and aggregates can come from drying (Tuoriniemi 2014)
- Not every particle reaches the plasma in single-particle ICP-MS (Resano 2022)
Papers this template follows
- Tuoriniemi et al., “Intermethod comparison of the particle size distributions of colloidal silica nanoparticles”, Sci. Technol. Adv. Mater. 2014. doi:10.1088/1468-6996/15/3/035009primary
- Tran et al., “Configuration of microbially synthesized Pd–Au nanoparticles studied by STEM-based techniques”, Nanotechnology 2012. doi:10.1088/0957-4484/23/5/055701primary
- Genc et al., “XEDS STEM tomography for 3D chemical characterization of nanoscale particles”, Ultramicroscopy 2013. doi:10.1016/j.ultramic.2013.03.023primary
- Resano et al., “Living in a transient world: ICP-MS reinvented via time-resolved analysis for monitoring single events”, Chem. Sci. 2022. doi:10.1039/d1sc05452jprimary
- Amorim, “A compendium of magnetic nanoparticle essentials: a comprehensive guide for beginners and experts”, Pharmaceutics 2025. doi:10.3390/pharmaceutics17010137primary
- Chen et al., “Rare earth core/shell nanobarcodes for multiplexed trace biodetection”, Anal. Chem. 2015. doi:10.1021/acs.analchem.5b00944further reading
- Faucher et al., “Gold and silver quantification from gold-silver nanoshells in HaCaT cells”, J. Trace Elem. Med. Biol. 2018. doi:10.1016/j.jtemb.2018.01.017further reading
- Godoy et al., “Evaluating the total gold concentration in metallic nanoparticles with a high content of organic matter through microwave-assisted decomposition platform and plasma-based spectrometric techniques (ICP-MS and ICP OES)”, Talanta 2021. doi:10.1016/j.talanta.2020.121808further reading
- Sonavane, Tomoda & Makino, “Biodistribution of colloidal gold nanoparticles after intravenous administration: effect of particle size”, Colloids Surf. B 2008. doi:10.1016/j.colsurfb.2008.07.004further reading
- Visscher et al., “Quantitative analysis of superparamagnetic contrast agent in sentinel lymph nodes using ex vivo vibrating sample magnetometry”, IEEE Trans. Biomed. Eng. 2013. doi:10.1109/TBME.2013.2261893further reading
Drawn by LabCanvas after Resano et al., Chem. Sci. 2022 (doi:10.1039/d1sc05452j), Tuoriniemi et al., Sci. Technol. Adv. Mater. 2014, Tran et al., Nanotechnology 2012 and Genc et al., Ultramicroscopy 2013, and the papers in the details.
How templates are written and checked: editorial guidelines.
Questions
What does the “What nanoparticles are made of: STEM, ICP-MS and magnetometry” template show?
Six principles for finding what nanoparticles are made of and how their elements are arranged: preparing a TEM grid, HAADF-STEM with its Z-contrast, EDS detectors around the specimen, ICP-MS from acid digestion to the plasma, single-particle ICP-MS and the vibrating-sample magnetometer. Instruments and principles only, with every caption quoted from the cited papers.
What are the steps shown in “What nanoparticles are made of: STEM, ICP-MS and magnetometry”?
1. Preparing a TEM grid: A drop of the dispersion on a 3 mm Au grid coated with a holey carbon film, the grid on a tissue that absorbed the liquid flowing through the film, left to dry in air for a few minutes; smaller particles tend to settle on the film, biasing TEM sizes toward smaller particles, and aggregates can come from drying (Tuoriniemi 2014). 2. HAADF-STEM: Combined with EDX mapping, the atomic-number (Z) contrast of HAADF-STEM characterises how the two metals are arranged in bimetallic Pd–Au particles, and HAADF-STEM tomography shows them in 3D (Tran 2012); Z-contrast can read nanoparticle barcodes built from different elements (Chen 2015). 3. Mapping the elements: X-ray (XEDS) detectors can be arranged symmetrically around the specimen; XEDS adds information where Z-contrast is low (Genc 2013). 4. ICP-MS: Au nanoparticles and Au–Ag nanoshells were mineralised in aqua regia with HF at 65 °C for 4 h (Faucher 2018); CTAB-capped gold nanorods were decomposed in a microwave with reverse aqua regia and H₂SO₄ (Godoy 2021); tissues were homogenised and lysed with aqua regia (Sonavane 2008). After dilution the liquid is nebulised with argon; the aerosol passes a spray chamber (90–98 % ends as waste) to the plasma (≈ 7500 K), where it is desolvated, vaporised, atomised and ionised, and the ions are separated by mass-to-charge ratio (Resano 2022). 5. Single-particle ICP-MS: Each particle that reaches the plasma gives a burst of ions, detected as a short pulse above the background; the pulse intensity is proportional to the mass of the analyte in the particle and the number of pulses to the number concentration; transport efficiency is never 100 % (Resano 2022). 6. Vibrating-sample magnetometry: VSM and SQUID magnetometry measure the magnetisation of magnetic nanoparticles under varying magnetic fields and temperatures (Amorim 2025); in lymph nodes the iron content was quantified from the magnetic moment curve with the Langevin model, the tissue fixed tightly and the vibration amplitude kept small (Visscher 2013).
What are the starting materials and the product?
Starting materials: Nanoparticles drop-cast on a grid, digested in acid, or held still in a magnetometer. Product: Arrangement of the elements in each particle, the metal content, particle mass and number, and the magnetisation.
Which papers is “What nanoparticles are made of: STEM, ICP-MS and magnetometry” based on?
Tuoriniemi et al., “Intermethod comparison of the particle size distributions of colloidal silica nanoparticles”, Sci. Technol. Adv. Mater. 2014 (doi:10.1088/1468-6996/15/3/035009); Tran et al., “Configuration of microbially synthesized Pd–Au nanoparticles studied by STEM-based techniques”, Nanotechnology 2012 (doi:10.1088/0957-4484/23/5/055701); Genc et al., “XEDS STEM tomography for 3D chemical characterization of nanoscale particles”, Ultramicroscopy 2013 (doi:10.1016/j.ultramic.2013.03.023); Resano et al., “Living in a transient world: ICP-MS reinvented via time-resolved analysis for monitoring single events”, Chem. Sci. 2022 (doi:10.1039/d1sc05452j); Amorim, “A compendium of magnetic nanoparticle essentials: a comprehensive guide for beginners and experts”, Pharmaceutics 2025 (doi:10.3390/pharmaceutics17010137); Chen et al., “Rare earth core/shell nanobarcodes for multiplexed trace biodetection”, Anal. Chem. 2015 (doi:10.1021/acs.analchem.5b00944); Faucher et al., “Gold and silver quantification from gold-silver nanoshells in HaCaT cells”, J. Trace Elem. Med. Biol. 2018 (doi:10.1016/j.jtemb.2018.01.017); Godoy et al., “Evaluating the total gold concentration in metallic nanoparticles with a high content of organic matter through microwave-assisted decomposition platform and plasma-based spectrometric techniques (ICP-MS and ICP OES)”, Talanta 2021 (doi:10.1016/j.talanta.2020.121808); Sonavane, Tomoda & Makino, “Biodistribution of colloidal gold nanoparticles after intravenous administration: effect of particle size”, Colloids Surf. B 2008 (doi:10.1016/j.colsurfb.2008.07.004); Visscher et al., “Quantitative analysis of superparamagnetic contrast agent in sentinel lymph nodes using ex vivo vibrating sample magnetometry”, IEEE Trans. Biomed. Eng. 2013 (doi:10.1109/TBME.2013.2261893).
Can I edit the “What nanoparticles are made of: STEM, ICP-MS and magnetometry” template?
Yes. Open it in the LabCanvas editor: all 45 layers are editable, including 6 generated objects (structures, plots, equipment) with their own settings. Change the text, colours and layout, then export PNG, TIFF, SVG or PDF.
Do I need an account to use this template?
Not to view it here. To open and edit it, sign in to LabCanvas or create a free account (the free plan keeps up to 3 designs). Downloading the figure is part of LabCanvas Pro (US$19 a month or US$199 a year).