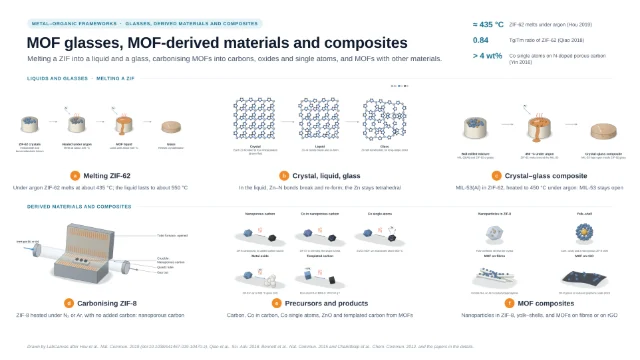
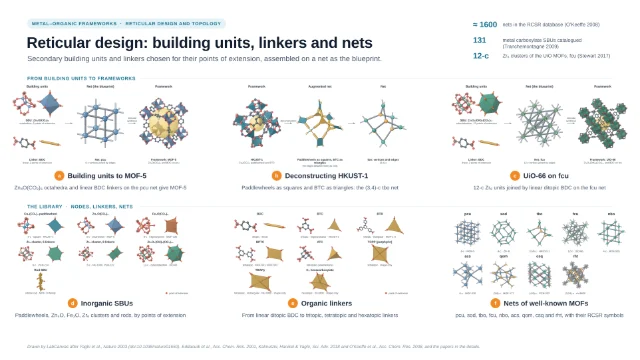
Graphical abstract template · MOF guides · MOF characterization methods
Characterizing MOFs: pores, structure, defects and uptake
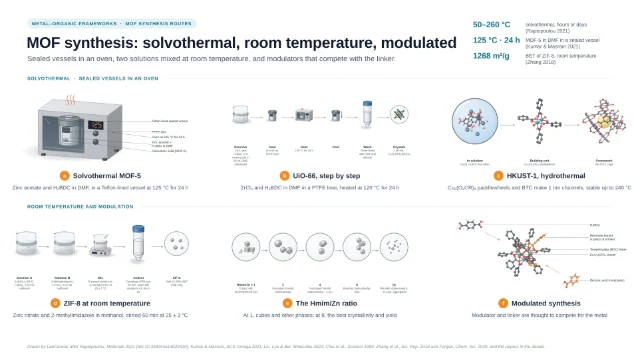
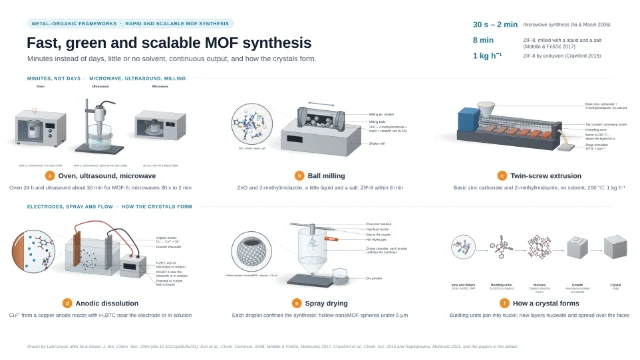
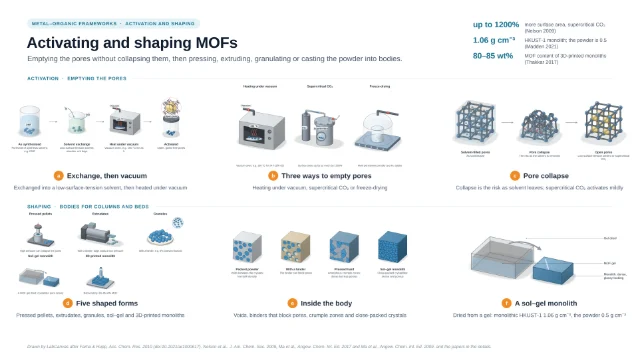
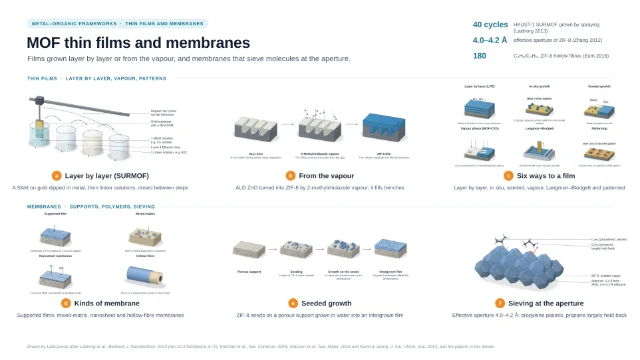
MOF characterization set-ups on one page: a volumetric gas sorption analyser with its degassing and free-space steps, 3D electron diffraction of a nanocrystal at a low dose, digestion ¹H NMR to count linkers and capping groups, a single crystal in a gas cell for in situ diffraction, a breakthrough rig for dry and humid gas mixtures, and gravimetric water sorption. The set-ups and numbers are quoted from the cited papers; no panel is measured data.
Updated 23 cited papers45 editable layers

At a glance
- Category
- MOF guides
- Method
- MOF characterization methods
- Product
- Porosity, structure, composition, gas binding, breakthrough and water uptake of MOFs
- Key result
- Instruments, cells and crystals drawn by LabCanvas after the cited set-ups; no panel is an isotherm, diffraction pattern, spectrum, thermogram or breakthrough curve
- Figure
- 1920 × 1080 px (16:9), 45 editable layers, 6 generated objects
Step by step
- Gas sorptionFor Co₂(dobdc), 30–100 mg went into a pre-weighed analysis tube that was capped, heated to 180 °C under dynamic vacuum until the outgas rate fell below 3 μbar min⁻¹, weighed again and returned to the analysis port; warm and cold free space were measured with helium, and N₂ isotherms at 77 K in liquid nitrogen (Gonzalez 2017). N₂ at 77 K suits pores wider than 0.7 nm, Ar at 87.3 K is preferred below 0.7 nm and CO₂ at 273 K serves pores below 0.45 nm; the degassing temperature should stay below 75% of the MOF’s decomposition temperature (Abid 2024). Even when all four consistency criteria are met, BET can overestimate the monolayer loading in MOFs that combine mesopores with large micropores (Gómez-Gualdrón 2016); given the same 18 isotherms, 61 labs reported a wide range of BET areas, and the BETSI software assigns the area unambiguously (Osterrieth 2022). In some MOFs adsorption occurs by pore filling rather than layer formation (Walton & Snurr 2007)
- Structure from nanocrystalsSingle-crystal XRD needs a large, high-quality crystal (more than 100 μm); otherwise high-resolution PXRD with computation is used, and PXRD gives only the average over the crystallites in the beam (Abid 2024). A typical 200 μm crystal weighs about 500 ng (Gonzalez 2017); synchrotron radiation resolved hard crystalline-sponge cases in under an hour of data collection (Ramadhar 2015), and SQUEEZE calculates the contribution of seriously disordered solvent to the structure factors (Spek 2015). 3D electron diffraction records diffraction patterns while the crystal is tilted, giving single-crystal data from nanocrystals (Gemmi 2019); MicroED uses an ultra-low electron dose at cryogenic temperatures, and because radiolysis, knock-on damage and heating all depend on dose, a low dose is the general remedy for beam damage in MOFs (Zheng 2023)
- Digestion ¹H NMRNode ligands are identified and quantified especially by IR and by ¹H NMR of MOFs digested in NaOH/D₂O; formate and acetate come from the modulators formic and acetic acid (formate also from decomposed DMF), and as minor, irregularly placed components they may not show up in XRD crystal structures (Yang & Gates 2021). Digestion NMR supported by TGA showed fluorinated Ce-UiO-66 to be free of defects (Nerli 2025); in situ solution ¹H NMR showed monocarboxylates at the defect sites of UiO-66 exchanged in preference to the linkers (Taddei 2018). TGA counts defects on the assumption that no metal centres are missing; for two formic-acid UiO-66 samples the difference was about 3% by TGA and 5% by ¹H NMR (Yost 2024)
- Gas in a single crystalIn a gas cell built at an ALS beamline, a crystal on a loop (with minimal epoxy, so the pores stayed open) sat in a quartz capillary with an O-ring seal and ball valves, joined by PTFE tubing to a gas-dosing manifold; it was evacuated at 180 °C, checked, then dosed, and in Co₂(dobdc) every gas bound first to the exposed Co(II) site, N₂ end-on with Co–N = 2.236(6) Å (Gonzalez 2017). For in situ PXRD a powder in a gas-filled capillary turned on a spinner, and in situ IR of a pellet under CO₂ doses showed a band at 2361 cm⁻¹ (Cavallo 2023). CO₂ coordinates end-on to the open Ni sites of Ni₂(dhtp) (Dietzel 2008); neutron powder diffraction placed O₂ side-on at the open Fe(II) sites of Fe₂(dobdc) (Bloch 2011); CO₂ inserts into the metal–amine bonds of diamine-appended MOFs, forming ammonium carbamate chains (McDonald 2015)
- Breakthrough rig143 mg of MOF powder was packed in stainless steel tubing and held with quartz wool; mass flow controllers set the flows, bubblers made the humid stream, heating tapes with PID controllers set the temperature, and a mass spectrometer measured the gas leaving the bed. The feed was 14% CO₂ and 2% He in N₂, helium as a tracer; the uptake from a breakthrough curve agreed with the single-gas isotherms, and at 70% relative humidity water took more than 20 min to break through, He, CO₂ and N₂ less than a minute (Sarswat 2025). Structured CALF-20 physisorbed CO₂ in preference below 40% relative humidity (Lin 2021); breakthrough data on Fe₂(dobdc) validated simulations (Bloch 2012)
- Water sorptionWater isotherms of MUF-16 were measured gravimetrically after activating the sample in situ at 150 °C for at least 12 h under nitrogen flow; each relative humidity, from 5 to 70%, counted as equilibrated when the weight changed by less than 0.0001% in 5 min, and loadings were also measured on the way down (Sarswat 2025). Gravimetry suits vapour adsorption at room temperature (Abid 2024). In MOF-303 the first water binds to the polar linkers, then forms isolated clusters, chains and a network (Hanikel 2021); good water adsorbents need the right condensation pressure, uptake capacity, and recyclability with water stability (Furukawa 2014), and a MOF-801 device harvested 2.8 litres of water per kilogram of MOF a day at relative humidity as low as 20% (Kim 2017)
Strengths
- The BETSI software assigns the BET area unambiguously (Osterrieth 2022)
- A gas cell follows the structure at every stage of evacuation and dosing (Gonzalez 2017)
- The uptake from a breakthrough curve agreed with the single-gas isotherms (Sarswat 2025)
Limitations
- BET can overestimate the monolayer loading in MOFs with mesopores and large micropores (Gómez-Gualdrón 2016)
- Single-crystal XRD needs crystals larger than 100 μm; PXRD gives only an average (Abid 2024)
- TGA counts defects on the assumption that no metal centres are missing (Yost 2024)
Papers this template follows
- Gonzalez et al., “Structural characterization of framework–gas interactions in the metal-organic framework Co₂(dobdc) by in situ single-crystal X-ray diffraction”, Chem. Sci. 2017. doi:10.1039/c7sc00449dprimary
- Abid et al., “Physiochemical characterization of metal organic framework materials: a mini review”, Heliyon 2024. doi:10.1016/j.heliyon.2023.e23840primary
- Gómez-Gualdrón et al., “Application of consistency criteria to calculate BET areas of micro- and mesoporous metal-organic frameworks”, J. Am. Chem. Soc. 2016. doi:10.1021/jacs.5b10266primary
- Osterrieth et al., “How reproducible are surface areas calculated from the BET equation?”, Adv. Mater. 2022. doi:10.1002/adma.202201502primary
- Walton & Snurr, “Applicability of the BET method for determining surface areas of microporous metal-organic frameworks”, J. Am. Chem. Soc. 2007. doi:10.1021/ja071174kprimary
- Ramadhar et al., “Analysis of rapidly synthesized guest-filled porous complexes with synchrotron radiation: practical guidelines for the crystalline sponge method”, Acta Crystallogr. A 2015. doi:10.1107/S2053273314019573primary
- Spek, “PLATON SQUEEZE: a tool for the calculation of the disordered solvent contribution to the calculated structure factors”, Acta Crystallogr. C 2015. doi:10.1107/S2053229614024929primary
- Gemmi et al., “3D electron diffraction: the nanocrystallography revolution”, ACS Cent. Sci. 2019. doi:10.1021/acscentsci.9b00394primary
- Zheng et al., “Research progress on metal-organic frameworks by advanced transmission electron microscopy”, Nanomaterials 2023. doi:10.3390/nano13111742primary
- Yang & Gates, “Elucidating and tuning catalytic sites on zirconium- and aluminum-containing nodes of stable metal-organic frameworks”, Acc. Chem. Res. 2021. doi:10.1021/acs.accounts.1c00029primary
- Nerli et al., “Systematic assessment of the structural impact of linker fluorination in Ce-based UiO-66”, Inorg. Chem. 2025. doi:10.1021/acs.inorgchem.5c03047primary
- Taddei et al., “Post-synthetic ligand exchange in zirconium-based metal-organic frameworks: beware of the defects!”, Angew. Chem. Int. Ed. 2018. doi:10.1002/anie.201806910primary
- Yost et al., “Hydrolysis of dimethyl phosphite by Zr- and Hf-UiO-66”, ACS Omega 2024. doi:10.1021/acsomega.4c04872primary
- Cavallo et al., “Cooperative CO₂ adsorption mechanism in a perfluorinated Ce-based metal organic framework”, J. Mater. Chem. A 2023. doi:10.1039/d2ta09746jprimary
- Dietzel et al., “Adsorption properties and structure of CO₂ adsorbed on open coordination sites of metal-organic framework Ni₂(dhtp) from gas adsorption, IR spectroscopy and X-ray diffraction”, Chem. Commun. 2008. doi:10.1039/b810574jprimary
- Bloch et al., “Selective binding of O₂ over N₂ in a redox-active metal-organic framework with open iron(II) coordination sites”, J. Am. Chem. Soc. 2011. doi:10.1021/ja205976vprimary
- McDonald et al., “Cooperative insertion of CO₂ in diamine-appended metal-organic frameworks”, Nature 2015. doi:10.1038/nature14327primary
- Sarswat et al., “Simulated moving bed process for CO₂ capture from humid postcombustion flue gases using MUF-16”, ACS Appl. Mater. Interfaces 2025. doi:10.1021/acsami.5c16139primary
- Lin et al., “A scalable metal-organic framework as a durable physisorbent for carbon dioxide capture”, Science 2021. doi:10.1126/science.abi7281primary
- Bloch et al., “Hydrocarbon separations in a metal-organic framework with open iron(II) coordination sites”, Science 2012. doi:10.1126/science.1217544primary
- Hanikel et al., “Evolution of water structures in metal-organic frameworks for improved atmospheric water harvesting”, Science 2021. doi:10.1126/science.abj0890primary
- Furukawa et al., “Water adsorption in porous metal-organic frameworks and related materials”, J. Am. Chem. Soc. 2014. doi:10.1021/ja500330aprimary
- Kim et al., “Water harvesting from air with metal-organic frameworks powered by natural sunlight”, Science 2017. doi:10.1126/science.aam8743primary
Drawn by LabCanvas after Gonzalez et al., Chem. Sci. 2017 (doi:10.1039/c7sc00449d), Abid et al., Heliyon 2024, Osterrieth et al., Adv. Mater. 2022, Gemmi et al., ACS Cent. Sci. 2019 and Zheng et al., Nanomaterials 2023, and the papers in the details.
How templates are written and checked: editorial guidelines.
Questions
What does the “Characterizing MOFs: pores, structure, defects and uptake” template show?
MOF characterization set-ups on one page: a volumetric gas sorption analyser with its degassing and free-space steps, 3D electron diffraction of a nanocrystal at a low dose, digestion ¹H NMR to count linkers and capping groups, a single crystal in a gas cell for in situ diffraction, a breakthrough rig for dry and humid gas mixtures, and gravimetric water sorption. The set-ups and numbers are quoted from the cited papers; no panel is measured data.
What are the steps shown in “Characterizing MOFs: pores, structure, defects and uptake”?
1. Gas sorption: For Co₂(dobdc), 30–100 mg went into a pre-weighed analysis tube that was capped, heated to 180 °C under dynamic vacuum until the outgas rate fell below 3 μbar min⁻¹, weighed again and returned to the analysis port; warm and cold free space were measured with helium, and N₂ isotherms at 77 K in liquid nitrogen (Gonzalez 2017). N₂ at 77 K suits pores wider than 0.7 nm, Ar at 87.3 K is preferred below 0.7 nm and CO₂ at 273 K serves pores below 0.45 nm; the degassing temperature should stay below 75% of the MOF’s decomposition temperature (Abid 2024). Even when all four consistency criteria are met, BET can overestimate the monolayer loading in MOFs that combine mesopores with large micropores (Gómez-Gualdrón 2016); given the same 18 isotherms, 61 labs reported a wide range of BET areas, and the BETSI software assigns the area unambiguously (Osterrieth 2022). In some MOFs adsorption occurs by pore filling rather than layer formation (Walton & Snurr 2007). 2. Structure from nanocrystals: Single-crystal XRD needs a large, high-quality crystal (more than 100 μm); otherwise high-resolution PXRD with computation is used, and PXRD gives only the average over the crystallites in the beam (Abid 2024). A typical 200 μm crystal weighs about 500 ng (Gonzalez 2017); synchrotron radiation resolved hard crystalline-sponge cases in under an hour of data collection (Ramadhar 2015), and SQUEEZE calculates the contribution of seriously disordered solvent to the structure factors (Spek 2015). 3D electron diffraction records diffraction patterns while the crystal is tilted, giving single-crystal data from nanocrystals (Gemmi 2019); MicroED uses an ultra-low electron dose at cryogenic temperatures, and because radiolysis, knock-on damage and heating all depend on dose, a low dose is the general remedy for beam damage in MOFs (Zheng 2023). 3. Digestion ¹H NMR: Node ligands are identified and quantified especially by IR and by ¹H NMR of MOFs digested in NaOH/D₂O; formate and acetate come from the modulators formic and acetic acid (formate also from decomposed DMF), and as minor, irregularly placed components they may not show up in XRD crystal structures (Yang & Gates 2021). Digestion NMR supported by TGA showed fluorinated Ce-UiO-66 to be free of defects (Nerli 2025); in situ solution ¹H NMR showed monocarboxylates at the defect sites of UiO-66 exchanged in preference to the linkers (Taddei 2018). TGA counts defects on the assumption that no metal centres are missing; for two formic-acid UiO-66 samples the difference was about 3% by TGA and 5% by ¹H NMR (Yost 2024). 4. Gas in a single crystal: In a gas cell built at an ALS beamline, a crystal on a loop (with minimal epoxy, so the pores stayed open) sat in a quartz capillary with an O-ring seal and ball valves, joined by PTFE tubing to a gas-dosing manifold; it was evacuated at 180 °C, checked, then dosed, and in Co₂(dobdc) every gas bound first to the exposed Co(II) site, N₂ end-on with Co–N = 2.236(6) Å (Gonzalez 2017). For in situ PXRD a powder in a gas-filled capillary turned on a spinner, and in situ IR of a pellet under CO₂ doses showed a band at 2361 cm⁻¹ (Cavallo 2023). CO₂ coordinates end-on to the open Ni sites of Ni₂(dhtp) (Dietzel 2008); neutron powder diffraction placed O₂ side-on at the open Fe(II) sites of Fe₂(dobdc) (Bloch 2011); CO₂ inserts into the metal–amine bonds of diamine-appended MOFs, forming ammonium carbamate chains (McDonald 2015). 5. Breakthrough rig: 143 mg of MOF powder was packed in stainless steel tubing and held with quartz wool; mass flow controllers set the flows, bubblers made the humid stream, heating tapes with PID controllers set the temperature, and a mass spectrometer measured the gas leaving the bed. The feed was 14% CO₂ and 2% He in N₂, helium as a tracer; the uptake from a breakthrough curve agreed with the single-gas isotherms, and at 70% relative humidity water took more than 20 min to break through, He, CO₂ and N₂ less than a minute (Sarswat 2025). Structured CALF-20 physisorbed CO₂ in preference below 40% relative humidity (Lin 2021); breakthrough data on Fe₂(dobdc) validated simulations (Bloch 2012). 6. Water sorption: Water isotherms of MUF-16 were measured gravimetrically after activating the sample in situ at 150 °C for at least 12 h under nitrogen flow; each relative humidity, from 5 to 70%, counted as equilibrated when the weight changed by less than 0.0001% in 5 min, and loadings were also measured on the way down (Sarswat 2025). Gravimetry suits vapour adsorption at room temperature (Abid 2024). In MOF-303 the first water binds to the polar linkers, then forms isolated clusters, chains and a network (Hanikel 2021); good water adsorbents need the right condensation pressure, uptake capacity, and recyclability with water stability (Furukawa 2014), and a MOF-801 device harvested 2.8 litres of water per kilogram of MOF a day at relative humidity as low as 20% (Kim 2017).
Which papers is “Characterizing MOFs: pores, structure, defects and uptake” based on?
Gonzalez et al., “Structural characterization of framework–gas interactions in the metal-organic framework Co₂(dobdc) by in situ single-crystal X-ray diffraction”, Chem. Sci. 2017 (doi:10.1039/c7sc00449d); Abid et al., “Physiochemical characterization of metal organic framework materials: a mini review”, Heliyon 2024 (doi:10.1016/j.heliyon.2023.e23840); Gómez-Gualdrón et al., “Application of consistency criteria to calculate BET areas of micro- and mesoporous metal-organic frameworks”, J. Am. Chem. Soc. 2016 (doi:10.1021/jacs.5b10266); Osterrieth et al., “How reproducible are surface areas calculated from the BET equation?”, Adv. Mater. 2022 (doi:10.1002/adma.202201502); Walton & Snurr, “Applicability of the BET method for determining surface areas of microporous metal-organic frameworks”, J. Am. Chem. Soc. 2007 (doi:10.1021/ja071174k); Ramadhar et al., “Analysis of rapidly synthesized guest-filled porous complexes with synchrotron radiation: practical guidelines for the crystalline sponge method”, Acta Crystallogr. A 2015 (doi:10.1107/S2053273314019573); Spek, “PLATON SQUEEZE: a tool for the calculation of the disordered solvent contribution to the calculated structure factors”, Acta Crystallogr. C 2015 (doi:10.1107/S2053229614024929); Gemmi et al., “3D electron diffraction: the nanocrystallography revolution”, ACS Cent. Sci. 2019 (doi:10.1021/acscentsci.9b00394); Zheng et al., “Research progress on metal-organic frameworks by advanced transmission electron microscopy”, Nanomaterials 2023 (doi:10.3390/nano13111742); Yang & Gates, “Elucidating and tuning catalytic sites on zirconium- and aluminum-containing nodes of stable metal-organic frameworks”, Acc. Chem. Res. 2021 (doi:10.1021/acs.accounts.1c00029); Nerli et al., “Systematic assessment of the structural impact of linker fluorination in Ce-based UiO-66”, Inorg. Chem. 2025 (doi:10.1021/acs.inorgchem.5c03047); Taddei et al., “Post-synthetic ligand exchange in zirconium-based metal-organic frameworks: beware of the defects!”, Angew. Chem. Int. Ed. 2018 (doi:10.1002/anie.201806910); Yost et al., “Hydrolysis of dimethyl phosphite by Zr- and Hf-UiO-66”, ACS Omega 2024 (doi:10.1021/acsomega.4c04872); Cavallo et al., “Cooperative CO₂ adsorption mechanism in a perfluorinated Ce-based metal organic framework”, J. Mater. Chem. A 2023 (doi:10.1039/d2ta09746j); Dietzel et al., “Adsorption properties and structure of CO₂ adsorbed on open coordination sites of metal-organic framework Ni₂(dhtp) from gas adsorption, IR spectroscopy and X-ray diffraction”, Chem. Commun. 2008 (doi:10.1039/b810574j); Bloch et al., “Selective binding of O₂ over N₂ in a redox-active metal-organic framework with open iron(II) coordination sites”, J. Am. Chem. Soc. 2011 (doi:10.1021/ja205976v); McDonald et al., “Cooperative insertion of CO₂ in diamine-appended metal-organic frameworks”, Nature 2015 (doi:10.1038/nature14327); Sarswat et al., “Simulated moving bed process for CO₂ capture from humid postcombustion flue gases using MUF-16”, ACS Appl. Mater. Interfaces 2025 (doi:10.1021/acsami.5c16139); Lin et al., “A scalable metal-organic framework as a durable physisorbent for carbon dioxide capture”, Science 2021 (doi:10.1126/science.abi7281); Bloch et al., “Hydrocarbon separations in a metal-organic framework with open iron(II) coordination sites”, Science 2012 (doi:10.1126/science.1217544); Hanikel et al., “Evolution of water structures in metal-organic frameworks for improved atmospheric water harvesting”, Science 2021 (doi:10.1126/science.abj0890); Furukawa et al., “Water adsorption in porous metal-organic frameworks and related materials”, J. Am. Chem. Soc. 2014 (doi:10.1021/ja500330a); Kim et al., “Water harvesting from air with metal-organic frameworks powered by natural sunlight”, Science 2017 (doi:10.1126/science.aam8743).
Can I edit the “Characterizing MOFs: pores, structure, defects and uptake” template?
Yes. Open it in the LabCanvas editor: all 45 layers are editable, including 6 generated objects (structures, plots, equipment) with their own settings. Change the text, colours and layout, then export PNG, TIFF, SVG or PDF.
Do I need an account to use this template?
Not to view it here. To open and edit it, sign in to LabCanvas or create a free account (the free plan keeps up to 3 designs). Downloading the figure is part of LabCanvas Pro (US$19 a month or US$199 a year).