Graphical abstract template · Graphical abstracts · Graphical abstract
Nanoparticle characterization at a glance: TEM, DLS, zeta potential, UV–vis and XRD
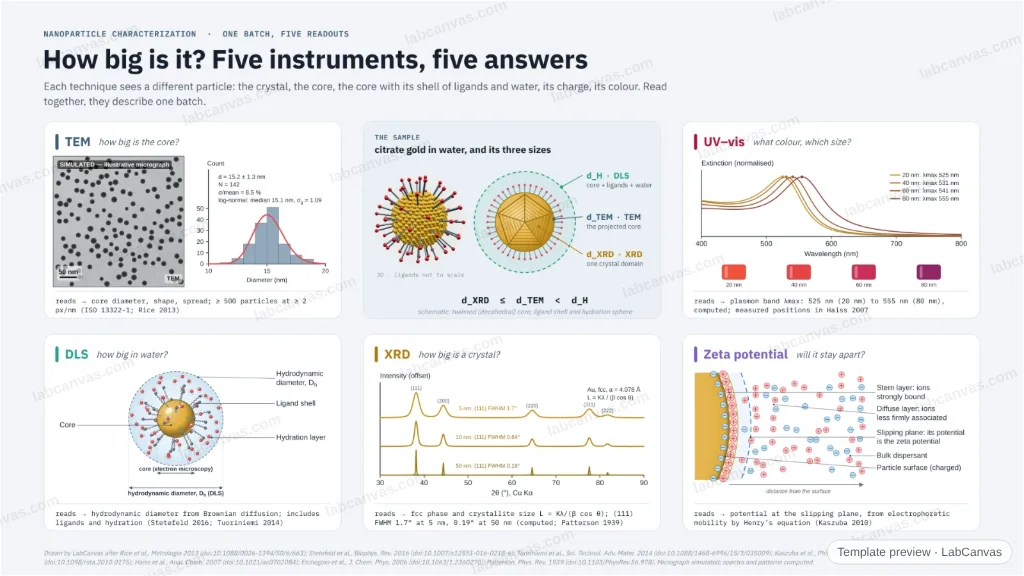
One batch of gold nanoparticles read five ways: TEM counts the cores and their spread, DLS measures the larger hydrodynamic sphere, the zeta potential reports the charge at the slipping plane, UV–vis finds the plasmon band and XRD sizes the crystallites from peak widths. A concentric diagram shows why the three “sizes” differ.
Updated 7 cited papers223 editable layers
At a glance
- Category
- Graphical abstracts
- Method
- Graphical abstract
- Starting materials
- A batch of citrate-capped gold nanoparticles in water
- Product
- Core size and spread, hydrodynamic size, surface charge, plasmon band and crystallite size
- Key result
- TEM: ≥ 500 particles, ≥ 2 px/nm (Rice et al. 2013); computed λmax 525 nm (20 nm), 541 nm (60 nm); computed (111) FWHM 1.7° at 5 nm, 0.19° at 50 nm
- Figure
- 1920 × 1080 px (16:9), 223 editable layers, 3 generated objects
Step by step
- TEMCount at least 500 particles at ≥ 2 px/nm (ISO 13322-1) and fit the distribution, usually lognormal; touching particles are left out (Rice et al. 2013)
- DLSBrownian diffusion gives the hydrodynamic diameter (Stetefeld et al. 2016), usually larger than the TEM core because it includes ligands and hydration (Tuoriniemi et al. 2014)
- Zeta potentialThe potential at the slipping plane of the double layer, from the electrophoretic mobility through Henry’s equation (Kaszuba et al. 2010)
- UV–visThe plasmon band of gold, computed here near 525 nm for 20 nm spheres and red-shifting with size, as measured by Haiss et al. (2007)
- XRDfcc gold (111) at 38.2° 2θ; peak width gives the crystallite size by Scherrer’s β = Kλ/(L cos θ) (Patterson 1939)
Uses
- Graphical abstracts and SI figures on nanoparticle characterization
- Teaching what each sizing technique measures
- Methods slides for nanomaterials papers
Papers this template follows
- Rice et al., “Particle size distributions by transmission electron microscopy: an interlaboratory comparison case study”, Metrologia 2013. doi:10.1088/0026-1394/50/6/663primary
- Stetefeld, McKenna & Patel, “Dynamic light scattering: a practical guide and applications in biomedical sciences”, Biophys. Rev. 2016. doi:10.1007/s12551-016-0218-6review
- Tuoriniemi et al., “Intermethod comparison of the particle size distributions of colloidal silica nanoparticles”, Sci. Technol. Adv. Mater. 2014. doi:10.1088/1468-6996/15/3/035009primary
- Kaszuba et al., “High-concentration zeta potential measurements using light-scattering techniques”, Phil. Trans. R. Soc. A 2010. doi:10.1098/rsta.2010.0175primary
- Haiss et al., “Determination of size and concentration of gold nanoparticles from UV−Vis spectra”, Anal. Chem. 2007. doi:10.1021/ac0702084primary
- Etchegoin, Le Ru & Meyer, “An analytic model for the optical properties of gold”, J. Chem. Phys. 2006. doi:10.1063/1.2360270method origin
- Patterson, “The Scherrer formula for X-ray particle size determination”, Phys. Rev. 1939. doi:10.1103/PhysRev.56.978method origin
Drawn by LabCanvas after Rice et al., Metrologia 2013 (doi:10.1088/0026-1394/50/6/663); Stetefeld et al., Biophys. Rev. 2016 (doi:10.1007/s12551-016-0218-6); Tuoriniemi et al., Sci. Technol. Adv. Mater. 2014 (doi:10.1088/1468-6996/15/3/035009); Kaszuba et al., Phil. Trans. R. Soc. A 2010 (doi:10.1098/rsta.2010.0175); Haiss et al., Anal. Chem. 2007 (doi:10.1021/ac0702084); Etchegoin et al., J. Chem. Phys. 2006 (doi:10.1063/1.2360270); Patterson, Phys. Rev. 1939 (doi:10.1103/PhysRev.56.978). Micrograph simulated; spectra and patterns computed.
How templates are written and checked: editorial guidelines.
Questions
What does the “Nanoparticle characterization at a glance: TEM, DLS, zeta potential, UV–vis and XRD” template show?
One batch of gold nanoparticles read five ways: TEM counts the cores and their spread, DLS measures the larger hydrodynamic sphere, the zeta potential reports the charge at the slipping plane, UV–vis finds the plasmon band and XRD sizes the crystallites from peak widths. A concentric diagram shows why the three “sizes” differ.
What are the steps shown in “Nanoparticle characterization at a glance: TEM, DLS, zeta potential, UV–vis and XRD”?
1. TEM: Count at least 500 particles at ≥ 2 px/nm (ISO 13322-1) and fit the distribution, usually lognormal; touching particles are left out (Rice et al. 2013). 2. DLS: Brownian diffusion gives the hydrodynamic diameter (Stetefeld et al. 2016), usually larger than the TEM core because it includes ligands and hydration (Tuoriniemi et al. 2014). 3. Zeta potential: The potential at the slipping plane of the double layer, from the electrophoretic mobility through Henry’s equation (Kaszuba et al. 2010). 4. UV–vis: The plasmon band of gold, computed here near 525 nm for 20 nm spheres and red-shifting with size, as measured by Haiss et al. (2007). 5. XRD: fcc gold (111) at 38.2° 2θ; peak width gives the crystallite size by Scherrer’s β = Kλ/(L cos θ) (Patterson 1939).
What are the starting materials and the product?
Starting materials: A batch of citrate-capped gold nanoparticles in water. Product: Core size and spread, hydrodynamic size, surface charge, plasmon band and crystallite size.
Which papers is “Nanoparticle characterization at a glance: TEM, DLS, zeta potential, UV–vis and XRD” based on?
Rice et al., “Particle size distributions by transmission electron microscopy: an interlaboratory comparison case study”, Metrologia 2013 (doi:10.1088/0026-1394/50/6/663); Stetefeld, McKenna & Patel, “Dynamic light scattering: a practical guide and applications in biomedical sciences”, Biophys. Rev. 2016 (doi:10.1007/s12551-016-0218-6); Tuoriniemi et al., “Intermethod comparison of the particle size distributions of colloidal silica nanoparticles”, Sci. Technol. Adv. Mater. 2014 (doi:10.1088/1468-6996/15/3/035009); Kaszuba et al., “High-concentration zeta potential measurements using light-scattering techniques”, Phil. Trans. R. Soc. A 2010 (doi:10.1098/rsta.2010.0175); Haiss et al., “Determination of size and concentration of gold nanoparticles from UV−Vis spectra”, Anal. Chem. 2007 (doi:10.1021/ac0702084); Etchegoin, Le Ru & Meyer, “An analytic model for the optical properties of gold”, J. Chem. Phys. 2006 (doi:10.1063/1.2360270); Patterson, “The Scherrer formula for X-ray particle size determination”, Phys. Rev. 1939 (doi:10.1103/PhysRev.56.978).
Can I edit the “Nanoparticle characterization at a glance: TEM, DLS, zeta potential, UV–vis and XRD” template?
Yes. Open it in the LabCanvas editor: all 223 layers are editable, including 3 generated objects (structures, plots, equipment) with their own settings. Change the text, colours and layout, then export PNG, TIFF or PDF at the width and DPI the journal asks for.
Do I need an account to use this template?
Not to view it here. To open and edit it, sign in to LabCanvas or create a free account (the free plan keeps up to 3 designs). Downloading the figure is part of LabCanvas Pro (US$19 a month or US$199 a year).