TikZ: what it is and how to use it in LaTeX
Quick answer
TikZ is a LaTeX package for drawing pictures with code. You describe lines, shapes and text with commands such as \draw and \node, and LaTeX typesets the picture with the fonts of your document. TikZ is the easy-to-use layer of PGF, the graphics system written by Till Tantau. To use it, load \usepackage{tikz} in the preamble and put the drawing commands inside a tikzpicture environment.
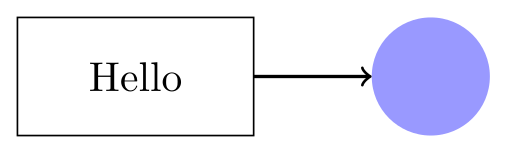
\usepackage{tikz}\begin{tikzpicture}
\draw (0,0) rectangle (2,1);
\node at (1,0.5) {Hello};
\draw[->, thick] (2,0.5) -- (3,0.5);
\fill[blue!40] (3.5,0.5) circle [radius=0.5];
\end{tikzpicture}Full document
\documentclass[border=4pt]{standalone}
\usepackage{tikz}
\begin{document}
\begin{tikzpicture}
  \draw (0,0) rectangle (2,1);
  \node at (1,0.5) {Hello};
  \draw[->, thick] (2,0.5) -- (3,0.5);
  \fill[blue!40] (3.5,0.5) circle [radius=0.5];
\end{tikzpicture}
\end{document}Contents
What TikZ is: PGF and TikZ
PGF and TikZ are one package with two names. PGF (for “portable graphics format”) is the graphics system: a system layer that hides the differences between output drivers such as pdfTeX and dvips, and a basic layer of commands such as \pgfpathcircle. TikZ is the frontend on top: a compact syntax in which \draw (0,0) -- (1,0) -- (1,1) -- cycle; is a whole triangle. The manual calls TikZ the only serious frontend for PGF; almost everyone writes TikZ and never touches the layers below.
The name is a recursive acronym: TikZ ist kein Zeichenprogramm, German for “TikZ is not a drawing program”. Till Tantau began it as LaTeX macros for the graphics in his PhD thesis; Mark Wibrow (the maths engine, shapes, decorations, matrices) and Christian Feuersänger (floating-point library, externalisation) joined the main team. On CTAN the package is called pgf. The current version is 3.1.12, released on 1 August 2026 and maintained by the PGF/TikZ team. The code may be used under the LaTeX Project Public License 1.3c or the GNU GPL 2, the manual under the GNU FDL 1.2 or the LPPL.
The manual is honest about the trade-off: you get precise positioning, macros and the typography of TeX, and you pay with a steep learning curve, no WYSIWYG view and a recompile for every change. That is why people pair it with a live preview (Overleaf, an editor with SyncTeX, or the TikZ editor on this site).
Many packages draw with TikZ underneath: pgfplots for plots with axes, tikz-cd for commutative diagrams, circuitikz for electrical circuits and chemfig for molecules. Learning TikZ makes all of them easier.
How to use TikZ in a LaTeX document
Three things go into a document that uses TikZ:
\usepackage{tikz}in the preamble. The package has no options, and loading it also loads PGF and the\foreachloop (pgffor).\usetikzlibrary{…}, also in the preamble and after\usepackage{tikz}, for any extra libraries: a comma-separated list such as\usetikzlibrary{positioning, arrows.meta}. Loading a library twice does nothing, so it is safe in shared preambles.- A
tikzpictureenvironment where the picture goes. All drawing commands live inside it (only\tikzsetmay stand outside), and each command ends with a semicolon. Options in square brackets after\begin{tikzpicture}apply to the whole picture. For a one-line picture there is the short form\tikz \draw (0,0) -- (1,0);.
A complete document, ready to compile with pdfLaTeX, LuaLaTeX or XeLaTeX:
\documentclass{article}
\usepackage{tikz}
\usetikzlibrary{arrows.meta}   % load only the libraries you use

\begin{document}
Text before the picture.

\begin{tikzpicture}
  \draw[-Stealth] (0,0) -- (2,0);
  \draw (3,0) circle [radius=0.5];
\end{tikzpicture}

Text after the picture.
\end{document}
The picture is set in the text like one large letter, so on a line of its own it starts where a paragraph would start. To centre it, number it and give it a caption, put it in a figure environment with \centering and \caption: see the tikzpicture environment.
For a figure on its own (to include with \includegraphics, or to upload separately), use the standalone class: \documentclass[border=4pt]{standalone} crops the page to the picture plus the border. Every “Full document” on these pages uses it, and the example below loads two libraries: positioning places a node right=of another, and arrows.meta provides the Stealth arrow tip.

\usepackage{tikz} \usetikzlibrary{positioning, arrows.meta}\begin{tikzpicture}[box/.style={draw, rounded corners, minimum height=8mm}]
\node[box] (sample) {Sample};
\node[box, right=of sample] (measure) {Measure};
\node[box, right=of measure] (plot) {Plot};
\draw[-Stealth] (sample) -- (measure);
\draw[-Stealth] (measure) -- (plot);
\end{tikzpicture}Full document
\documentclass[border=4pt]{standalone}
\usepackage{tikz}
\usetikzlibrary{positioning, arrows.meta}
\begin{document}
\begin{tikzpicture}[box/.style={draw, rounded corners, minimum height=8mm}]
  \node[box] (sample) {Sample};
  \node[box, right=of sample] (measure) {Measure};
  \node[box, right=of measure] (plot) {Plot};
  \draw[-Stealth] (sample) -- (measure);
  \draw[-Stealth] (measure) -- (plot);
\end{tikzpicture}
\end{document}How to draw your first TikZ figure, step by step
A small plot drawn by hand shows most of what you use every day. Build it in this order, compiling after each step:
- Start with a grid of help lines.
\draw[help lines] (0,0) grid (4,3);draws faint lines every centimetre, so you can see where each coordinate is. - Draw the axes.
--joins two points with a straight line and the option->puts an arrow tip at the end. - Add a curve and a point.
.. controls (1.5,3) and (2.5,0) ..draws a Bézier curve from the current point to the end point, pulled towards the two control points (it does not pass through them);circle [radius=2pt]draws a circle, and\fillfills it instead of stroking it. - Label it with nodes.
node[right] {$x$}after a coordinate puts text at that point of the path;above left,belowand the other placement options say on which side. Text in nodes is ordinary LaTeX, maths included. - Remove the help lines (or keep them while you work) and compile the final figure.
The point (2, 1.5) in step 3 is exactly on the curve: a cubic Bézier curve is at ⅛·start + ⅜·first control + ⅜·second control + ⅛·end halfway along, which here is (2, 1.5).
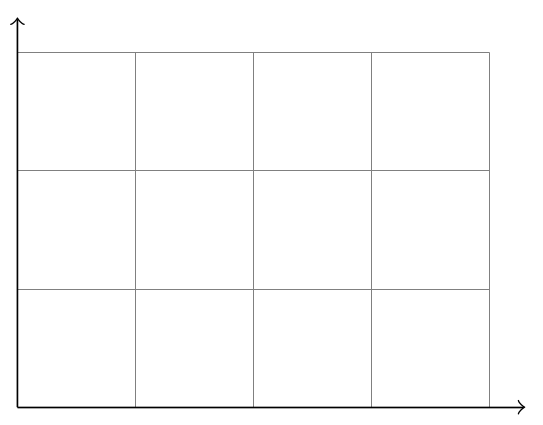
\usepackage{tikz}\begin{tikzpicture}
\draw[help lines] (0,0) grid (4,3);
\draw[->] (0,0) -- (4.3,0);
\draw[->] (0,0) -- (0,3.3);
\end{tikzpicture}Full document
\documentclass[border=4pt]{standalone}
\usepackage{tikz}
\begin{document}
\begin{tikzpicture}
  \draw[help lines] (0,0) grid (4,3);
  \draw[->] (0,0) -- (4.3,0);
  \draw[->] (0,0) -- (0,3.3);
\end{tikzpicture}
\end{document}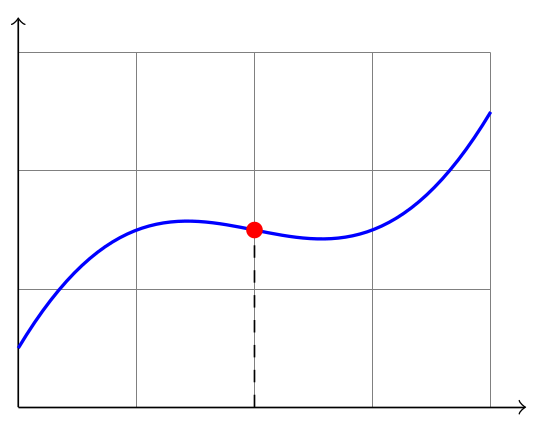
\usepackage{tikz}\begin{tikzpicture}
\draw[help lines] (0,0) grid (4,3);
\draw[->] (0,0) -- (4.3,0);
\draw[->] (0,0) -- (0,3.3);
\draw[thick, blue] (0,0.5) .. controls (1.5,3) and (2.5,0) .. (4,2.5);
\draw[dashed] (2,0) -- (2,1.5);
\fill[red] (2,1.5) circle [radius=2pt];
\end{tikzpicture}Full document
\documentclass[border=4pt]{standalone}
\usepackage{tikz}
\begin{document}
\begin{tikzpicture}
  \draw[help lines] (0,0) grid (4,3);
  \draw[->] (0,0) -- (4.3,0);
  \draw[->] (0,0) -- (0,3.3);
  \draw[thick, blue] (0,0.5) .. controls (1.5,3) and (2.5,0) .. (4,2.5);
  \draw[dashed] (2,0) -- (2,1.5);
  \fill[red] (2,1.5) circle [radius=2pt];
\end{tikzpicture}
\end{document}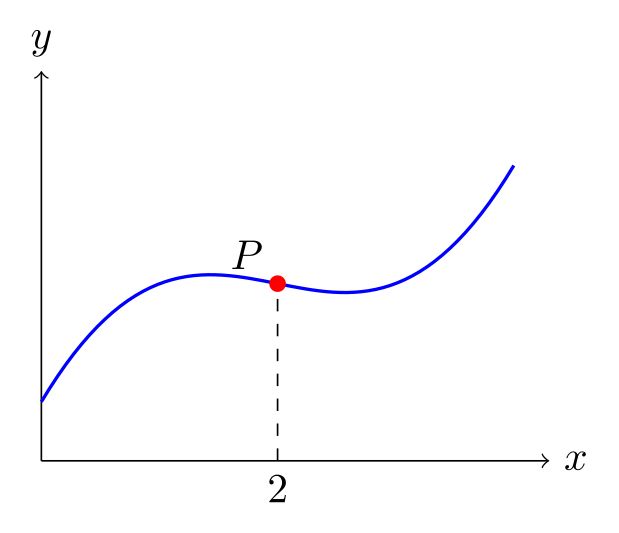
\usepackage{tikz}\begin{tikzpicture}
\draw[->] (0,0) -- (4.3,0) node[right] {$x$};
\draw[->] (0,0) -- (0,3.3) node[above] {$y$};
\draw[thick, blue] (0,0.5) .. controls (1.5,3) and (2.5,0) .. (4,2.5);
\draw[dashed] (2,0) node[below] {$2$} -- (2,1.5);
\fill[red] (2,1.5) circle [radius=2pt];
\node[above left] at (2,1.5) {$P$};
\end{tikzpicture}Full document
\documentclass[border=4pt]{standalone}
\usepackage{tikz}
\begin{document}
\begin{tikzpicture}
  \draw[->] (0,0) -- (4.3,0) node[right] {$x$};
  \draw[->] (0,0) -- (0,3.3) node[above] {$y$};
  \draw[thick, blue] (0,0.5) .. controls (1.5,3) and (2.5,0) .. (4,2.5);
  \draw[dashed] (2,0) node[below] {$2$} -- (2,1.5);
  \fill[red] (2,1.5) circle [radius=2pt];
  \node[above left] at (2,1.5) {$P$};
\end{tikzpicture}
\end{document}Coordinates and units at a glance
TikZ’s y axis points up, and a coordinate without units is measured in the picture’s unit vectors, which are 1 cm long unless you change them with the x= and y= options. The forms you will use most:
| You write | It means |
|---|---|
(2,1) | 2 units right and 1 up from the origin: 2 cm and 1 cm by default |
(2cm,5mm), (1in,10pt) | Explicit lengths, in any TeX unit |
(60:2), (60:2cm) | Polar: 2 units (or 2 cm) from the origin at 60° (0° points right, 90° up) |
++(1,0) | 1 unit right of the previous point, which then becomes the current point |
+(1,0) | 1 unit right of the previous point, without moving the current point |
(A), (A.north) | A named coordinate (\coordinate (A) at (1,2);) or a node, or one of a node’s anchors |
($(A)!0.5!(B)$) | Halfway from A to B: a coordinate calculation, which needs \usetikzlibrary{calc} |
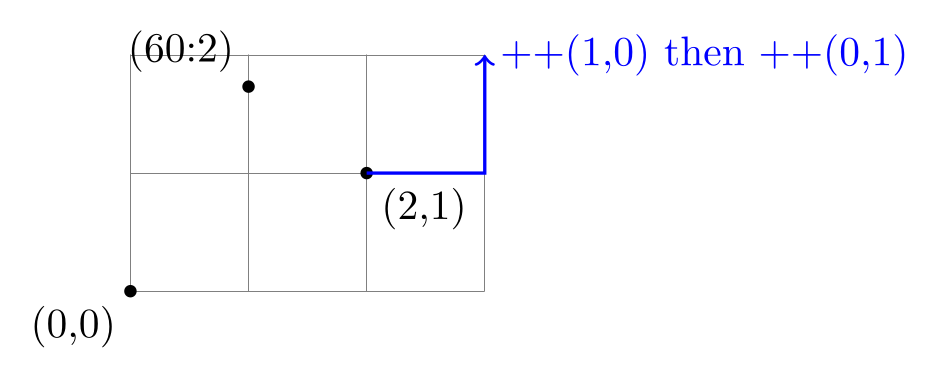
\usepackage{tikz}\begin{tikzpicture}
\draw[help lines] (0,0) grid (3,2);
\fill (0,0) circle [radius=1.5pt] node[below left] {(0,0)};
\fill (2,1) circle [radius=1.5pt] node[below right] {(2,1)};
\fill (60:2) circle [radius=1.5pt] node[above left] {(60:2)};
\draw[->, thick, blue] (2,1) -- ++(1,0) -- ++(0,1) node[right] {++(1,0) then ++(0,1)};
\end{tikzpicture}Full document
\documentclass[border=4pt]{standalone}
\usepackage{tikz}
\begin{document}
\begin{tikzpicture}
  \draw[help lines] (0,0) grid (3,2);
  \fill (0,0) circle [radius=1.5pt] node[below left] {(0,0)};
  \fill (2,1) circle [radius=1.5pt] node[below right] {(2,1)};
  \fill (60:2) circle [radius=1.5pt] node[above left] {(60:2)};
  \draw[->, thick, blue] (2,1) -- ++(1,0) -- ++(0,1) node[right] {++(1,0) then ++(0,1)};
\end{tikzpicture}
\end{document}Libraries, and plots with pgfplots
TikZ keeps its core small and puts extras in libraries. The ones you meet first:
arrows.meta: arrow tips such asStealthandLatexthat you can resize and recolour (the olderarrowslibrary is deprecated).positioning:right=of a,below=1cm of bandnode distance, for diagrams built from boxes.calc: computed coordinates such as midpoints and points part-way along a line.shapes.geometric: node shapes such asellipse,diamondandregular polygon.backgroundsandfit: drawing behind other elements, and frames that fit around a group of nodes.decorations.pathmorphinganddecorations.pathreplacing: zigzag and snake lines, and curly braces.
TikZ can plot a function itself, but for anything with axes, ticks, legends or data files the usual choice is pgfplots, a separate package built on TikZ. An axis environment sits inside the tikzpicture, and \pgfplotsset{compat=1.18} in the preamble selects the behaviour of pgfplots 1.18. Its maths is PGF’s, so sin(x) takes degrees.
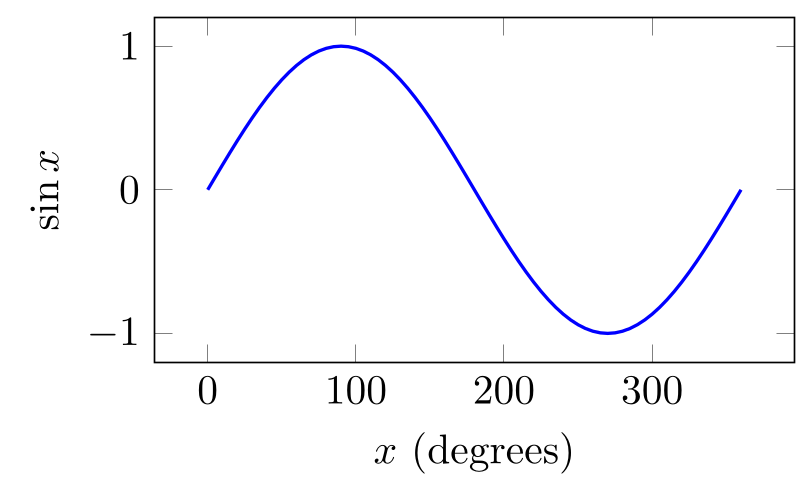
\usepackage{tikz} \usepackage{pgfplots} \pgfplotsset{compat=1.18}\begin{tikzpicture}
\begin{axis}[width=7cm, height=4.5cm, xlabel={$x$ (degrees)}, ylabel={$\sin x$}]
\addplot[blue, thick, domain=0:360, samples=73] {sin(x)};
\end{axis}
\end{tikzpicture}Full document
\documentclass[border=4pt]{standalone}
\usepackage{tikz}
\usepackage{pgfplots}
\pgfplotsset{compat=1.18}
\begin{document}
\begin{tikzpicture}
  \begin{axis}[width=7cm, height=4.5cm, xlabel={$x$ (degrees)}, ylabel={$\sin x$}]
    \addplot[blue, thick, domain=0:360, samples=73] {sin(x)};
  \end{axis}
\end{tikzpicture}
\end{document}TikZ on Overleaf and with a local TeX installation
Overleaf. Overleaf compiles with TeX Live, so TikZ and its libraries are already there: add \usepackage{tikz} and compile. New projects use the newest TeX Live on Overleaf’s servers, existing projects keep the version they were created with, and pdfLaTeX is the default compiler. You can change both in the project settings (the gear icon, then Compiler): switch to LuaLaTeX or XeLaTeX for system fonts, or to a newer TeX Live to get a newer PGF.
TeX Live and MacTeX. TeX Live’s default full scheme installs everything, TikZ included, and MacTeX is TeX Live for the Mac. PGF 3.1.12 needs at least TeX Live 2020. TeX Live 2026 came out on 1 March 2026; to bring a TeX Live installation up to date, run tlmgr update --all, or tlmgr update pgf for PGF alone.
MiKTeX. MiKTeX can install missing packages automatically: the first document that loads TikZ asks permission to install the pgf package.
To check which version you have, typeset \pgfversion (it expands to the version number), and compare it with the version on CTAN. To try code without installing anything, open it in the TikZ editor, which runs TeX Live 2026 with the common libraries, pgfplots, circuitikz, tikz-cd and chemfig loaded.
Every TikZ page on LabCanvas
Each guide follows the same pattern: a direct answer, then working code for every variant, each shown with the picture TeX Live made from it, the full document to copy, the errors you are likely to meet and the manual sections behind every statement.
Start here
- The tikzpicture environment: options, scaling and centringThe tikzpicture environment: its options, scale vs transform shape vs \resizebox, centring it in a figure with a caption, and inline TikZ with baseline.
- The PGF/TikZ manual: where to find it and which part to readWhere the official PGF/TikZ manual is (CTAN PDF, texdoc tikz, the tikz.dev HTML edition), which version it describes, and which section to read for each task.
Shapes, lines and text
- How to draw a rectangle in TikZ (with rounded corners and text)Draw rectangles in TikZ: the two-corner syntax, rounded corners (all or only some), text inside, exact node size, fill, opacity, squares and fit boxes.
- TikZ lines: dashed, dotted, thickness and line widthTikZ lines: dashed and dotted styles with their exact patterns, ultra thin to ultra thick widths, dash pattern, caps and joins, double lines, grids.
- TikZ arrows: arrow tips, sizes, curves and labelsAll TikZ arrow tips in one rendered table, arrows.meta sizing (length, width, scale, open, round), and curved, labelled, thick, block and squiggly arrows.
- How to make a text box in TikZTikZ text boxes: wrap text with text width, align it, set bold and font size, add titles, callouts and background boxes, and place text with anchors.
- Shadows in TikZ (and what overlay means)TikZ shadows: drop shadow, copy shadow and circular glow (shadows library), soft blur shadow (shadows.blur) and the overlay option, with rendered code.
Diagrams with TikZ packages
- Commutative diagrams with tikz-cdDraw commutative diagrams with tikz-cd: the tikzcd grid, \arrow directions, labels, arrow styles, pullbacks, exact sequences, snake lemma and editors.
- CircuiTikZ: drawing circuits in LaTeXDraw circuits in LaTeX with CircuiTikZ 1.8.7: the to[R=$R_1$] syntax, sources, switches, labels, ground, op-amps, transistors, logic gates, full examples.
Examples
- TikZ examples: 179 figures with code, by fieldA gallery of 179 TikZ and pgfplots figures with their full code, from open-source collections (MIT or CC0): physics, maths, machine learning, plots, diagrams.
More TikZ guides
- Bloch sphere in TikZ: drawing a qubit state in LaTeXA Bloch sphere in LaTeX with TikZ: shaded sphere, dashed back equator, axes, the six basis states, a state with θ and φ, tikz-3dplot and blochsphere.
- TikZ cheat sheetTikZ cheat sheet: paths, shapes, nodes, anchors, positioning, arrows, line styles, colours, coordinates, \foreach and styles, plus a printable A4 version.
- chemfig tutorial: drawing molecules and reactions in LaTeXchemfig 1.84 tutorial with code: bonds and angles, branches, rings and benzene, charges and lone pairs, wedges, \setchemfig options and reaction schemes.
- How to draw circles, ellipses and arcs in TikZDraw circles, ellipses and arcs in TikZ: circle[radius], ellipse radii, arc start/end angle and centre, half circles, sectors, pie charts and angle marks.
- TikZ colors: names, mixing, fill, shading and patternsTikZ colours with xcolor: every named colour (base and dvipsnames charts), red!30 mixing, custom colours, fill and filldraw, opacity, shading, patterns.
- Converting TikZ to SVG, EPS, PNG and PDF, and plots into TikZExport TikZ as a cropped PDF, convert it to SVG, PNG or EPS with pdftocairo, dvisvgm or Ghostscript, and the 2026 status of tikzplotlib and matlab2tikz.
- TikZ coordinates, paths, \foreach, scopes and stylesTikZ coordinates (polar, relative ++, named, calc, intersections), paths and controls, \foreach loops, scopes, \tikzset styles, decorations and grids.
- TikZ diagrams: block, cycle, flowchart, tree and moreHow to draw diagrams in TikZ: block, cycle, flowchart, tree, graph, timeline, matrix, commutative and circuit diagrams, each with compiled code.
- TikZ editors, online and desktop, honestly comparedTikZ editors compared: LabCanvas, Overleaf, TikZ Editor, TikZiT, KtikZ/QtikZ, TikzEdt, TikZJax, quiver, Mathcha: platforms, licences, previews, releases.
- Common TikZ errors and how to fix themThe 30 most common TikZ errors with their exact messages, causes and fixes, tested with TeX Live 2026: semicolons, unknown keys, libraries, arrows, babel.
- TikZ flowchart: shapes, decisions, loops and a templateFlowcharts in LaTeX with TikZ: the standard shapes, yes/no decisions, right-angled arrows, loops, swimlanes and a reusable template with compiled output.
- TikZ graphs: drawing networks of vertices and edgesGraph theory drawings in TikZ: vertices and edges by hand, directed and weighted graphs, loops, the \graph syntax, K_n and C_n, and automatic layouts.
- TikZ libraries: what each one adds and how to load itReference table of TikZ libraries (positioning, calc, arrows.meta, shapes, decorations, patterns, fit, matrix…) with load lines, examples and manual links.
- TikZ matrix: matrices, arrays of nodes and array diagramsTikZ matrix library: matrix of nodes and math nodes, & and \\, cell names like (m-1-2), styles, brackets, highlighted cells, and array diagrams.
- TikZ neural network diagrams: perceptron, MLP, CNN, LSTM and transformerNeural network diagrams in LaTeX with TikZ: perceptron, MLP from \foreach loops, labelled weights, CNN feature maps, RNN, LSTM, autoencoder, transformer.
- TikZ nodes: shapes, anchors, positioning and labelsHow TikZ nodes work: shapes, size (inner sep, minimum size), all anchors, the positioning library (right=of, node distance), labels, pins and scaling.
- TikZ on Overleaf, in Obsidian, in Typst and on the web (TikZJax)TikZ on Overleaf (and its 10-second free compile limit), TikZ in Obsidian with TikZJax plugins, TikZJax on web pages, and CeTZ, the Typst counterpart.
- TikZ physics diagrams: forces, springs, optics, waves and fieldsPhysics diagrams in TikZ with code: free-body diagram, inclined plane, spring and pendulum, a lens ray diagram, waves, energy levels and a dipole field.
- TikZ plots with pgfplots: functions, data, scatter, bars and 3DPlot in LaTeX with pgfplots: functions, data tables, scatter plots coloured by value, error bars, bar charts, log axes, 3D surfaces and groupplots.
- Quantikz: quantum circuit diagrams in LaTeXQuantum circuits in LaTeX with quantikz 1.0.1: gates, CNOT, measurement, classical wires, slices, Bell state, teleportation, quantikz vs quantikz2.
- TikZ shapes: triangles, stars, clouds, cylinders, crosses and bracesEvery TikZ node shape (shapes.geometric, symbols, misc, arrows) with options: triangle, star, cloud, cylinder, cross, curly braces, and custom styles.
- TikZ-Feynman: Feynman diagrams in LaTeXDraw Feynman diagrams with TikZ-Feynman 1.1.0: vertices, fermion, photon, gluon and scalar lines, momentum arrows, manual vs LuaLaTeX layout, loops.
- tikz-timing: digital timing diagrams in LaTeXTiming diagrams in LaTeX with tikz-timing 0.7f: H, L, Z, X, D{} and clock characters, \texttiming, tikztimingtable, buses, arrows between signals, SPI.
- TikZlings and TikZducks: animals (and a unicorn) in TikZTikZlings 2.6 and TikZducks 2.2: all 28 animals, loading one package, colours, 3D and back views, accessories, hooks, pics, and how to draw a TikZ unicorn.
- tikzposter: scientific posters with LaTeX and TikZThe tikzposter class 2.0: a minimal poster, class options, blocks, columns, notes, themes and colour palettes, fonts, custom sizes and printing problems.
- TikZ timeline: horizontal, vertical, periods and Gantt chartsTimelines in LaTeX with TikZ: horizontal and vertical, ticks and labels with \foreach, events above and below, periods, milestones and Gantt charts.
- TikZ trees: child syntax, forest and tikz-qtreeDraw trees in LaTeX: TikZ child syntax with level and sibling distance, forest for automatic spacing, tikz-qtree, org charts, binary and decision trees.
Examples by field
- TikZ physics examples18 figures: quantum, statistical, solid-state and field-theory figures
- TikZ chemistry examples6 figures: molecules, crystal sites and computational chemistry diagrams
- TikZ biology examples5 figures: DNA, gene expression, bioinformatics and network figures
- TikZ neural network and machine learning examples56 figures: neural networks, CNNs, RNNs, transformers and training diagrams
- TikZ mathematics examples36 figures: geometry, graph theory, calculus, tensors, probability and numerics
- TikZ electronics and signal examples7 figures: CMOS circuits, a MOSFET and signal modulation and sampling
- TikZ computer science examples12 figures: data structures, graph algorithms and system diagrams
- TikZ and pgfplots chart examples16 figures: bar, pie, line, area and 3D plots, mostly with pgfplots
- TikZ diagram examples: flowcharts, mind maps, Venn14 figures: flowcharts, process and concept diagrams, mind maps and Venn diagrams
- TikZ commutative diagram examples3 figures: universal properties and a thermodynamics diagram
- TikZ colour and shading examples6 figures: colour wheels, gradients, ball shading and \foreach patterns
Common errors and how to fix them
| LaTeX says (or you see) | Cause and fix |
|---|---|
| Environment tikzpicture undefined. | The preamble lacks \usepackage{tikz}. |
Undefined control sequence. (at \usetikzlibrary) | \usetikzlibrary comes before \usepackage{tikz}; move it after. |
Undefined control sequence. (at \draw in the text) | Drawing commands outside a tikzpicture. Put them inside one, or write \tikz \draw …; for a single command. |
| Package tikz Error: Giving up on this path. Did you forget a semicolon? | The command before the line LaTeX names has no closing ;. |
| Package pgfkeys Error: I do not know the key '/tikz/colr' … | A misspelt option, or an option from a library you have not loaded (add its \usetikzlibrary). |
| Package pgf Error: Unknown arrow tip kind 'Stealth'. | Arrow tips with capital letters (Stealth, Latex) need \usetikzlibrary{arrows.meta}. |
| Package PGF Math Error: Unknown function `of' (in 'of a'). | right=of a without the positioning library: add \usetikzlibrary{positioning}. |
| Missing $ inserted. | Maths in node text outside $…$, such as x_1: write {$x_1$}. |
Frequently asked questions
What does TikZ stand for?
TikZ is a recursive acronym for the German “TikZ ist kein Zeichenprogramm”, which means “TikZ is not a drawing program”: you program the picture rather than draw it with the mouse.
What is the difference between PGF and TikZ?
PGF is the graphics system underneath (a system layer for the output drivers and a basic layer of commands); TikZ is the user-friendly frontend built on it. On CTAN and in TeX distributions the package is called pgf, and \usepackage{tikz} loads both.
Do I need to install TikZ?
Usually not: it is part of TeX Live, MacTeX and Overleaf, and MiKTeX installs it the first time a document needs it. PGF 3.1.12 needs at least TeX Live 2020.
Which LaTeX engine should I use for TikZ?
pdfLaTeX works for almost everything and is the default on Overleaf. LuaLaTeX and XeLaTeX work too, and you need LuaLaTeX for TikZ’s automatic graph drawing library (graphdrawing) and when you want system fonts with fontspec.
Should I use TikZ or pgfplots for a plot?
TikZ can plot a function with its plot operation, but pgfplots draws the axes, ticks, legends and data plots for you. Use pgfplots for anything that looks like a chart; it is built on TikZ, so you can still add TikZ drawing to the same picture.
How do I learn TikZ quickly?
Start with a small picture and change one thing at a time: the step-by-step figure on this page, then the tutorials in part I of the PGF/TikZ manual. Keep the manual for reference; it explains every option with examples. The manual guide says which section to read for each task.
How do I turn a TikZ picture into an image file?
Compile it in a standalone document: \documentclass[border=4pt]{standalone} gives a PDF cropped to the picture. The free TikZ editor typesets the code and downloads a PNG at 300 or 600 dpi.
References
- PGF/TikZ manual (version 3.1.12), §1 Introduction (what TikZ and PGF are, the name)tikz.dev
- PGF/TikZ manual (version 3.1.12), §1.1 The Layers Below TikZtikz.dev
- PGF/TikZ manual (version 3.1.12), §1.5 Authors and Acknowledgementstikz.dev
- PGF/TikZ manual (version 3.1.12), §8.1 Package and Driver Versions (TeX Live 2020 or later)tikz.dev
- PGF/TikZ manual (version 3.1.12), §9.1 Which License Applies?tikz.dev
- PGF/TikZ manual (version 3.1.12), §12.1 Loading the Package and the Librariestikz.dev
- PGF/TikZ manual (version 3.1.12), §12.2.1–12.2.2 Creating a Picture Using an Environment or a Commandtikz.dev
- PGF/TikZ manual (version 3.1.12), §13.2.1 Canvas, XYZ, and Polar Coordinate Systemstikz.dev
- PGF/TikZ manual (version 3.1.12), §13.4.1 Specifying Relative Coordinatestikz.dev
- PGF/TikZ manual (version 3.1.12), §13.5 Coordinate Calculationstikz.dev
- PGF/TikZ manual (version 3.1.12), §14 Syntax for Path Specifications (§14.2 line-to, §14.3 curve-to, §14.6 circle, §14.8 grid)tikz.dev
- PGF/TikZ manual (version 3.1.12), §15.1 Overview of actions on paths (\draw, \fill)tikz.dev
- PGF/TikZ manual (version 3.1.12), §16.1 Arrows: overview (arrows.meta; arrows deprecated)tikz.dev
- PGF/TikZ manual (version 3.1.12), §17.2 Nodes and Their Shapes; §17.5.3 Advanced Placement Options (positioning)tikz.dev
- PGF/TikZ manual (version 3.1.12), §25.2 The XY- and XYZ-Coordinate Systems (default 1 cm unit vectors)tikz.dev
- PGF/TikZ manual (version 3.1.12), §28 Using Graph Drawing in TikZ (requires LuaTeX)tikz.dev
- PGF/TikZ manual (version 3.1.12), §94.3.4 Trigonometric functions (degrees)tikz.dev
- CTAN: the pgf package (version 3.1.12, maintainers, licences)ctan.org
- CTAN announcement: pgf 3.1.12, 1 August 2026ctan.org
- standalone class manual (v1.5a), §5.1 Basic usage and §5.2 Class options (border)mirrors.ctan.org
- pgfplots manual (v1.18.3), §2.2 Upgrade remarks (the compat key)mirrors.ctan.org
- CTAN: pgfplots, tikz-cd, circuitikz and chemfig (built on TikZ)ctan.org
- Overleaf docs: TeX Live on Overleafdocs.overleaf.com
- Overleaf docs: Selecting a TeX Live version and LaTeX compilerdocs.overleaf.com
- TeX Live: TeX Live 2026, released 1 March 2026tug.org
- The TeX Live Guide 2026, §3.2 schemes and §5.2 tlmgr updatetug.org
- tlmgr manual: update [option...] [pkg...]tug.org
- MiKTeX manual: Automatic Package Installationdocs.miktex.org
The facts on this page were checked against these sources, and every picture is the code with it typeset with TeX Live 2026. Code on this page: CC0 1.0, copy it freely.
Try the code in your browserEvery snippet on this page opens in the free TikZ editor: it is typeset with TeX Live as you type, with errors pointed at their line.
Open the TikZ editor