Graphical abstract template · Graphical abstracts · Graphical abstract
Plasmonics: from a ringing electron cloud to single-molecule SERS
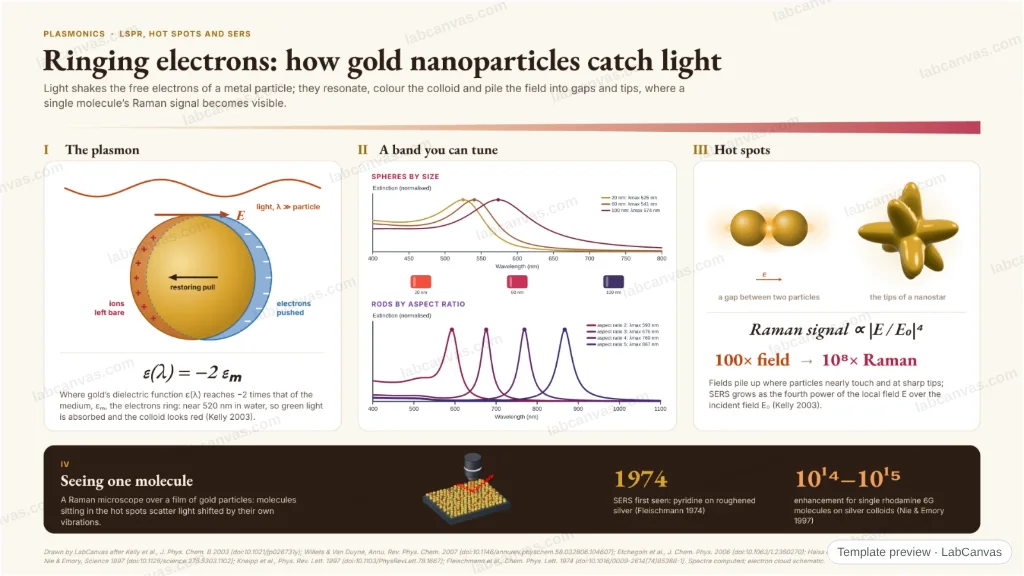
Light pushes the conduction electrons of a gold nanoparticle against the pull of its ions, and they ring: the localized surface plasmon. Computed spectra show the band moving with size and shape and the colour of each colloid; gaps and tips concentrate the field into hot spots, where Raman signals grow as |E|⁴, enough to see single molecules by SERS.
Updated 9 cited papers91 editable layers
At a glance
- Category
- Graphical abstracts
- Method
- Graphical abstract
- Starting materials
- Gold nanospheres, nanorods and nanostars; silver colloids for SERS
- Product
- Plasmon bands tuned across the visible and near infrared; local fields strong enough for single-molecule Raman
- Key result
- Computed λmax: 525 nm (20 nm sphere), 574 nm (100 nm), 676 nm (rod AR 3) in water; single-molecule SERS enhancement 10¹⁴–10¹⁵ (Nie & Emory 1997)
- Figure
- 1920 × 1080 px (16:9), 91 editable layers, 2 generated objects
Step by step
- The plasmonLight’s field displaces the conduction electrons; the uncovered ions pull them back; for a small sphere resonance comes where ε_metal = −2ε_medium (Kelly et al. 2003)
- Tuned by size, shape, surroundingsComputed: gold spheres in water peak at 525 nm (20 nm) to 574 nm (100 nm), rods from 593 nm (AR 2) to 867 nm (AR 5); the band shifts with the local refractive index (Willets & Van Duyne 2007)
- Hot spotsGaps and tips concentrate the field; SERS grows as |E|⁴, so a 100-fold field gives 10⁸ more Raman (Kelly et al. 2003)
- SERSFirst seen on roughened silver (Fleischmann et al. 1974); single rhodamine 6G molecules with enhancement factors of 10¹⁴–10¹⁵ (Nie & Emory 1997; Kneipp et al. 1997)
Uses
- Graphical abstracts on plasmonics, LSPR sensing and SERS
- Talks on nanoparticle optics
- Teaching why gold colloids are red
Papers this template follows
- Kelly, Coronado, Zhao & Schatz, “The optical properties of metal nanoparticles: the influence of size, shape, and dielectric environment”, J. Phys. Chem. B 2003. doi:10.1021/jp026731yreview
- Willets & Van Duyne, “Localized surface plasmon resonance spectroscopy and sensing”, Annu. Rev. Phys. Chem. 2007. doi:10.1146/annurev.physchem.58.032806.104607review
- Etchegoin, Le Ru & Meyer, “An analytic model for the optical properties of gold”, J. Chem. Phys. 2006. doi:10.1063/1.2360270method origin
- Haiss et al., “Determination of size and concentration of gold nanoparticles from UV−Vis spectra”, Anal. Chem. 2007. doi:10.1021/ac0702084primary
- Link, Mohamed & El-Sayed, “Simulation of the optical absorption spectra of gold nanorods as a function of their aspect ratio and the effect of the medium dielectric constant”, J. Phys. Chem. B 1999. doi:10.1021/jp990183fprimary
- Nie & Emory, “Probing single molecules and single nanoparticles by surface-enhanced Raman scattering”, Science 1997. doi:10.1126/science.275.5303.1102primary
- Kneipp et al., “Single molecule detection using surface-enhanced Raman scattering (SERS)”, Phys. Rev. Lett. 1997. doi:10.1103/PhysRevLett.78.1667primary
- Fleischmann, Hendra & McQuillan, “Raman spectra of pyridine adsorbed at a silver electrode”, Chem. Phys. Lett. 1974. doi:10.1016/0009-2614(74)85388-1method origin
- Elghanian et al., “Selective colorimetric detection of polynucleotides based on the distance-dependent optical properties of gold nanoparticles”, Science 1997. doi:10.1126/science.277.5329.1078further reading
Drawn by LabCanvas after Kelly et al., J. Phys. Chem. B 2003 (doi:10.1021/jp026731y); Willets & Van Duyne, Annu. Rev. Phys. Chem. 2007 (doi:10.1146/annurev.physchem.58.032806.104607); Etchegoin et al., J. Chem. Phys. 2006 (doi:10.1063/1.2360270); Haiss et al., Anal. Chem. 2007 (doi:10.1021/ac0702084); Nie & Emory, Science 1997 (doi:10.1126/science.275.5303.1102); Kneipp et al., Phys. Rev. Lett. 1997 (doi:10.1103/PhysRevLett.78.1667); Fleischmann et al., Chem. Phys. Lett. 1974 (doi:10.1016/0009-2614(74)85388-1). Spectra computed; electron cloud schematic.
How templates are written and checked: editorial guidelines.
Questions
What does the “Plasmonics: from a ringing electron cloud to single-molecule SERS” template show?
Light pushes the conduction electrons of a gold nanoparticle against the pull of its ions, and they ring: the localized surface plasmon. Computed spectra show the band moving with size and shape and the colour of each colloid; gaps and tips concentrate the field into hot spots, where Raman signals grow as |E|⁴, enough to see single molecules by SERS.
What are the steps shown in “Plasmonics: from a ringing electron cloud to single-molecule SERS”?
1. The plasmon: Light’s field displaces the conduction electrons; the uncovered ions pull them back; for a small sphere resonance comes where ε_metal = −2ε_medium (Kelly et al. 2003). 2. Tuned by size, shape, surroundings: Computed: gold spheres in water peak at 525 nm (20 nm) to 574 nm (100 nm), rods from 593 nm (AR 2) to 867 nm (AR 5); the band shifts with the local refractive index (Willets & Van Duyne 2007). 3. Hot spots: Gaps and tips concentrate the field; SERS grows as |E|⁴, so a 100-fold field gives 10⁸ more Raman (Kelly et al. 2003). 4. SERS: First seen on roughened silver (Fleischmann et al. 1974); single rhodamine 6G molecules with enhancement factors of 10¹⁴–10¹⁵ (Nie & Emory 1997; Kneipp et al. 1997).
What are the starting materials and the product?
Starting materials: Gold nanospheres, nanorods and nanostars; silver colloids for SERS. Product: Plasmon bands tuned across the visible and near infrared; local fields strong enough for single-molecule Raman.
Which papers is “Plasmonics: from a ringing electron cloud to single-molecule SERS” based on?
Kelly, Coronado, Zhao & Schatz, “The optical properties of metal nanoparticles: the influence of size, shape, and dielectric environment”, J. Phys. Chem. B 2003 (doi:10.1021/jp026731y); Willets & Van Duyne, “Localized surface plasmon resonance spectroscopy and sensing”, Annu. Rev. Phys. Chem. 2007 (doi:10.1146/annurev.physchem.58.032806.104607); Etchegoin, Le Ru & Meyer, “An analytic model for the optical properties of gold”, J. Chem. Phys. 2006 (doi:10.1063/1.2360270); Haiss et al., “Determination of size and concentration of gold nanoparticles from UV−Vis spectra”, Anal. Chem. 2007 (doi:10.1021/ac0702084); Link, Mohamed & El-Sayed, “Simulation of the optical absorption spectra of gold nanorods as a function of their aspect ratio and the effect of the medium dielectric constant”, J. Phys. Chem. B 1999 (doi:10.1021/jp990183f); Nie & Emory, “Probing single molecules and single nanoparticles by surface-enhanced Raman scattering”, Science 1997 (doi:10.1126/science.275.5303.1102); Kneipp et al., “Single molecule detection using surface-enhanced Raman scattering (SERS)”, Phys. Rev. Lett. 1997 (doi:10.1103/PhysRevLett.78.1667); Fleischmann, Hendra & McQuillan, “Raman spectra of pyridine adsorbed at a silver electrode”, Chem. Phys. Lett. 1974 (doi:10.1016/0009-2614(74)85388-1); Elghanian et al., “Selective colorimetric detection of polynucleotides based on the distance-dependent optical properties of gold nanoparticles”, Science 1997 (doi:10.1126/science.277.5329.1078).
Can I edit the “Plasmonics: from a ringing electron cloud to single-molecule SERS” template?
Yes. Open it in the LabCanvas editor: all 91 layers are editable, including 2 generated objects (structures, plots, equipment) with their own settings. Change the text, colours and layout, then export PNG, TIFF or PDF at the width and DPI the journal asks for.
Do I need an account to use this template?
Not to view it here. To open and edit it, sign in to LabCanvas or create a free account (the free plan keeps up to 3 designs). Downloading the figure is part of LabCanvas Pro (US$19 a month or US$199 a year).