Graphical abstract template · Graphical abstracts · Graphical abstract
Seeing nanoparticles in the body: CT, photoacoustic, MPI, NIR-II and PET/SPECT imaging
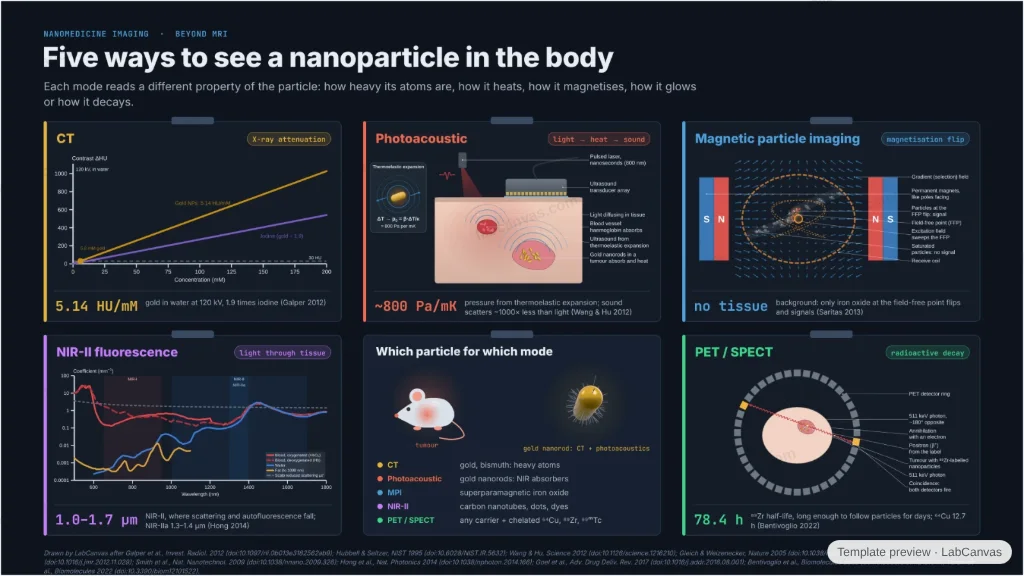
Five ways to find nanoparticles in a living body, hung like films on a lightbox: gold and bismuth that stop X-rays in CT, absorbers that turn light into sound, iron oxide that flips its magnetisation at a field-free point, emitters in the second near-infrared window and radiometals for PET and SPECT. Each with its contrast mechanism, a live generator and one number from the paper.
Updated 10 cited papers104 editable layers
At a glance
- Category
- Graphical abstracts
- Method
- Graphical abstract
- Starting materials
- Gold and bismuth particles, near-infrared absorbers and emitters, superparamagnetic iron oxide, radiolabelled nanoparticles
- Product
- Contrast for CT, photoacoustic, magnetic particle, NIR-II fluorescence and PET/SPECT imaging
- Key result
- Gold 5.14 HU/mM (1.9× iodine) at 120 kV; ~800 Pa per mK; NIR-IIa 1.3–1.4 µm; ⁸⁹Zr half-life 78.4 h
- Figure
- 1920 × 1080 px (16:9), 104 editable layers, 4 generated objects
Step by step
- CTHigh-Z particles attenuate X-rays: gold 5.14 HU/mM at 120 kV, 1.9 times iodine (Galper et al. 2012); K-edges 33.17 keV (I) and 80.72 keV (Au) (Hubbell & Seltzer 1995)
- PhotoacousticA nanosecond pulse heats the absorber; thermoelastic expansion gives about 800 Pa per mK, and sound scatters ~1000 times less than light (Wang & Hu 2012)
- Magnetic particle imagingIron oxide flips its magnetisation only at the field-free point; tissue gives no signal (Gleich & Weizenecker 2005; Saritas et al. 2013)
- NIR-IIWindows at 650–950 nm and 1000–1350 nm (Smith et al. 2009); 1.0–1.7 µm, NIR-IIa 1.3–1.4 µm, through the skull with carbon nanotubes (Hong et al. 2014)
- PET / SPECTTwo 511 keV photons ~180° apart; ⁶⁴Cu (12.7 h) and ⁸⁹Zr (78.4 h) on chelators (Goel et al. 2017; Bentivoglio et al. 2022); ⁹⁹ᵐTc (6 h, 140.5 keV) for SPECT (Varani et al. 2022)
Uses
- Graphical abstracts on nanoparticle contrast agents and multimodal imaging
- Reviews comparing imaging modalities
- Teaching how each modality makes contrast
Papers this template follows
- Galper et al., “Effect of computed tomography scanning parameters on gold nanoparticle and iodine contrast”, Invest. Radiol. 2012. doi:10.1097/rli.0b013e3182562ab9primary
- Hubbell & Seltzer, “Tables of x-ray mass attenuation coefficients and mass energy-absorption coefficients 1 keV to 20 MeV for elements Z = 1 to 92 and 48 additional substances of dosimetry interest”, NIST Interagency Report 1995. doi:10.6028/NIST.IR.5632further reading
- Wang & Hu, “Photoacoustic tomography: in vivo imaging from organelles to organs”, Science 2012. doi:10.1126/science.1216210review
- Gleich & Weizenecker, “Tomographic imaging using the nonlinear response of magnetic particles”, Nature 2005. doi:10.1038/nature03808method origin
- Saritas et al., “Magnetic particle imaging (MPI) for NMR and MRI researchers”, J. Magn. Reson. 2013. doi:10.1016/j.jmr.2012.11.029review
- Smith, Mancini & Nie, “Second window for in vivo imaging”, Nat. Nanotechnol. 2009. doi:10.1038/nnano.2009.326primary
- Hong et al., “Through-skull fluorescence imaging of the brain in a new near-infrared window”, Nat. Photonics 2014. doi:10.1038/nphoton.2014.166primary
- Goel, England, Chen & Cai, “Positron emission tomography and nanotechnology: a dynamic duo for cancer theranostics”, Adv. Drug Deliv. Rev. 2017. doi:10.1016/j.addr.2016.08.001review
- Bentivoglio et al., “Methods for radiolabelling nanoparticles: PET use (part 2)”, Biomolecules 2022. doi:10.3390/biom12101517review
- Varani et al., “Methods for radiolabelling nanoparticles: SPECT use (part 1)”, Biomolecules 2022. doi:10.3390/biom12101522review
Drawn by LabCanvas after Galper et al., Invest. Radiol. 2012 (doi:10.1097/rli.0b013e3182562ab9); Hubbell & Seltzer, NIST 1995 (doi:10.6028/NIST.IR.5632); Wang & Hu, Science 2012 (doi:10.1126/science.1216210); Gleich & Weizenecker, Nature 2005 (doi:10.1038/nature03808); Saritas et al., J. Magn. Reson. 2013 (doi:10.1016/j.jmr.2012.11.029); Smith et al., Nat. Nanotechnol. 2009 (doi:10.1038/nnano.2009.326); Hong et al., Nat. Photonics 2014 (doi:10.1038/nphoton.2014.166); Goel et al., Adv. Drug Deliv. Rev. 2017 (doi:10.1016/j.addr.2016.08.001); Bentivoglio et al., Biomolecules 2022 (doi:10.3390/biom12101517); Varani et al., Biomolecules 2022 (doi:10.3390/biom12101522).
How templates are written and checked: editorial guidelines.
Questions
What does the “Seeing nanoparticles in the body: CT, photoacoustic, MPI, NIR-II and PET/SPECT imaging” template show?
Five ways to find nanoparticles in a living body, hung like films on a lightbox: gold and bismuth that stop X-rays in CT, absorbers that turn light into sound, iron oxide that flips its magnetisation at a field-free point, emitters in the second near-infrared window and radiometals for PET and SPECT. Each with its contrast mechanism, a live generator and one number from the paper.
What are the steps shown in “Seeing nanoparticles in the body: CT, photoacoustic, MPI, NIR-II and PET/SPECT imaging”?
1. CT: High-Z particles attenuate X-rays: gold 5.14 HU/mM at 120 kV, 1.9 times iodine (Galper et al. 2012); K-edges 33.17 keV (I) and 80.72 keV (Au) (Hubbell & Seltzer 1995). 2. Photoacoustic: A nanosecond pulse heats the absorber; thermoelastic expansion gives about 800 Pa per mK, and sound scatters ~1000 times less than light (Wang & Hu 2012). 3. Magnetic particle imaging: Iron oxide flips its magnetisation only at the field-free point; tissue gives no signal (Gleich & Weizenecker 2005; Saritas et al. 2013). 4. NIR-II: Windows at 650–950 nm and 1000–1350 nm (Smith et al. 2009); 1.0–1.7 µm, NIR-IIa 1.3–1.4 µm, through the skull with carbon nanotubes (Hong et al. 2014). 5. PET / SPECT: Two 511 keV photons ~180° apart; ⁶⁴Cu (12.7 h) and ⁸⁹Zr (78.4 h) on chelators (Goel et al. 2017; Bentivoglio et al. 2022); ⁹⁹ᵐTc (6 h, 140.5 keV) for SPECT (Varani et al. 2022).
What are the starting materials and the product?
Starting materials: Gold and bismuth particles, near-infrared absorbers and emitters, superparamagnetic iron oxide, radiolabelled nanoparticles. Product: Contrast for CT, photoacoustic, magnetic particle, NIR-II fluorescence and PET/SPECT imaging.
Which papers is “Seeing nanoparticles in the body: CT, photoacoustic, MPI, NIR-II and PET/SPECT imaging” based on?
Galper et al., “Effect of computed tomography scanning parameters on gold nanoparticle and iodine contrast”, Invest. Radiol. 2012 (doi:10.1097/rli.0b013e3182562ab9); Hubbell & Seltzer, “Tables of x-ray mass attenuation coefficients and mass energy-absorption coefficients 1 keV to 20 MeV for elements Z = 1 to 92 and 48 additional substances of dosimetry interest”, NIST Interagency Report 1995 (doi:10.6028/NIST.IR.5632); Wang & Hu, “Photoacoustic tomography: in vivo imaging from organelles to organs”, Science 2012 (doi:10.1126/science.1216210); Gleich & Weizenecker, “Tomographic imaging using the nonlinear response of magnetic particles”, Nature 2005 (doi:10.1038/nature03808); Saritas et al., “Magnetic particle imaging (MPI) for NMR and MRI researchers”, J. Magn. Reson. 2013 (doi:10.1016/j.jmr.2012.11.029); Smith, Mancini & Nie, “Second window for in vivo imaging”, Nat. Nanotechnol. 2009 (doi:10.1038/nnano.2009.326); Hong et al., “Through-skull fluorescence imaging of the brain in a new near-infrared window”, Nat. Photonics 2014 (doi:10.1038/nphoton.2014.166); Goel, England, Chen & Cai, “Positron emission tomography and nanotechnology: a dynamic duo for cancer theranostics”, Adv. Drug Deliv. Rev. 2017 (doi:10.1016/j.addr.2016.08.001); Bentivoglio et al., “Methods for radiolabelling nanoparticles: PET use (part 2)”, Biomolecules 2022 (doi:10.3390/biom12101517); Varani et al., “Methods for radiolabelling nanoparticles: SPECT use (part 1)”, Biomolecules 2022 (doi:10.3390/biom12101522).
Can I edit the “Seeing nanoparticles in the body: CT, photoacoustic, MPI, NIR-II and PET/SPECT imaging” template?
Yes. Open it in the LabCanvas editor: all 104 layers are editable, including 4 generated objects (structures, plots, equipment) with their own settings. Change the text, colours and layout, then export PNG, TIFF or PDF at the width and DPI the journal asks for.
Do I need an account to use this template?
Not to view it here. To open and edit it, sign in to LabCanvas or create a free account (the free plan keeps up to 3 designs). Downloading the figure is part of LabCanvas Pro (US$19 a month or US$199 a year).