TikZ lines: dashed, dotted, thickness and line width
Quick answer
\draw[dashed] (0,0) -- (3,0);. The other ready-made styles are dotted, dash dot and dash dot dot, each also densely or loosely, and dash pattern=on 6pt off 3pt makes any pattern. Set the thickness with line width=2pt or a named width from ultra thin (0.1pt) to ultra thick (1.6pt); the default is 0.4pt, the same as thin.
\usepackage{tikz}\begin{tikzpicture}[every node/.style={right, font=\ttfamily\small}]
\draw (0,1.5) -- (4,1.5) node {solid (default)};
\draw[dashed] (0,1) -- (4,1) node {dashed};
\draw[thick, dotted] (0,0.5) -- (4,0.5) node {thick, dotted};
\draw[line width=2pt, dash pattern=on 6pt off 3pt] (0,0) -- (4,0)
node {line width=2pt, dash pattern=on 6pt off 3pt};
\end{tikzpicture}Full document
\documentclass[border=4pt]{standalone}
\usepackage{tikz}
\begin{document}
\begin{tikzpicture}[every node/.style={right, font=\ttfamily\small}]
  \draw (0,1.5) -- (4,1.5) node {solid (default)};
  \draw[dashed] (0,1) -- (4,1) node {dashed};
  \draw[thick, dotted] (0,0.5) -- (4,0.5) node {thick, dotted};
  \draw[line width=2pt, dash pattern=on 6pt off 3pt] (0,0) -- (4,0)
    node {line width=2pt, dash pattern=on 6pt off 3pt};
\end{tikzpicture}
\end{document}Contents
Draw a line between two points
\draw (0,0) -- (2,1); draws a straight line; add more -- (x,y) to continue it. Coordinates without units are in centimetres (the x and y vectors are initially 1 cm), and every path ends with a semicolon.
Points can also be given relative to the last one. ++(1,0) means 1 cm to the right of the previous point and moves the current point there, so a chain of ++ steps walks along. A single + is also relative but does not move the current point, so every + step is measured from the same start, as the red line shows. A polar coordinate (30:2) is 2 cm at 30°: (0,0) -- ++(30:2) draws a line of a given length and direction.

\usepackage{tikz}\begin{tikzpicture}[dot/.style={circle, fill, inner sep=1.2pt},
every node/.style={font=\ttfamily\small, align=center}]
% absolute coordinates
\draw[thick] (0,0) -- (2,1);
\node[below] at (1,-0.1) {(0,0) -- (2,1)};
% ++ : each step starts where the last one ended
\draw[thick, blue] (3.5,0) -- ++(1,0) -- ++(0,1) -- ++(1,0);
\node[below] at (4.5,-0.1) {++(1,0) ++(0,1)\\++(1,0)};
% + : every step is measured from the same start point
\draw[thick, red] (7,0) -- +(1,0) -- +(0,1) -- +(1,0);
\node[below] at (7.5,-0.1) {+(1,0) +(0,1)\\+(1,0)};
% polar: angle and length, 2 cm at 30 degrees
\draw[thick, green!50!black] (9.5,0) -- ++(30:2);
\node[below] at (10.5,-0.1) {++(30:2)};
\foreach \x in {0, 3.5, 7, 9.5} \node[dot] at (\x,0) {};
\end{tikzpicture}Full document
\documentclass[border=4pt]{standalone}
\usepackage{tikz}
\begin{document}
\begin{tikzpicture}[dot/.style={circle, fill, inner sep=1.2pt},
                    every node/.style={font=\ttfamily\small, align=center}]
  % absolute coordinates
  \draw[thick] (0,0) -- (2,1);
  \node[below] at (1,-0.1) {(0,0) -- (2,1)};
  % ++ : each step starts where the last one ended
  \draw[thick, blue] (3.5,0) -- ++(1,0) -- ++(0,1) -- ++(1,0);
  \node[below] at (4.5,-0.1) {++(1,0) ++(0,1)\\++(1,0)};
  % + : every step is measured from the same start point
  \draw[thick, red] (7,0) -- +(1,0) -- +(0,1) -- +(1,0);
  \node[below] at (7.5,-0.1) {+(1,0) +(0,1)\\+(1,0)};
  % polar: angle and length, 2 cm at 30 degrees
  \draw[thick, green!50!black] (9.5,0) -- ++(30:2);
  \node[below] at (10.5,-0.1) {++(30:2)};
  \foreach \x in {0, 3.5, 7, 9.5} \node[dot] at (\x,0) {};
\end{tikzpicture}
\end{document}Line thickness: line width and the named widths
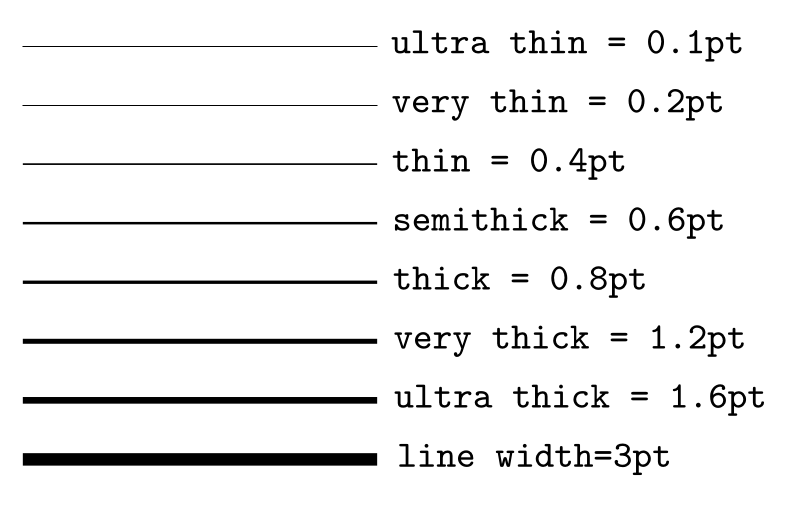
line width=⟨length⟩ sets the thickness; it is initially 0.4pt. The manual defines seven named widths as styles:
| Style | Line width |
|---|---|
ultra thin | 0.1pt |
very thin | 0.2pt |
thin | 0.4pt (the default width) |
semithick | 0.6pt |
thick | 0.8pt |
very thick | 1.2pt |
ultra thick | 1.6pt |
The named widths are options on their own, \draw[thick]; they are not values for line width, so line width=thick is an error. A bare number is read as points (line width=2 is 2pt). To make a whole picture thicker, put the option on the picture, \begin{tikzpicture}[thick], or on a scope; because they are styles, you can even redefine them, for example \tikzset{thick/.style={line width=1pt}}. The help lines style for grids is gray at 0.2pt.
\usepackage{tikz}\begin{tikzpicture}[y=-5mm, every node/.style={right, font=\ttfamily\small}]
\foreach \st/\w [count=\i] in {ultra thin/0.1pt, very thin/0.2pt, thin/0.4pt,
semithick/0.6pt, thick/0.8pt, very thick/1.2pt, ultra thick/1.6pt}
\draw[\st] (0,\i) -- (3,\i) node {\st\ = \w};
\draw[line width=3pt] (0,8) -- (3,8) node {line width=3pt};
\end{tikzpicture}Full document
\documentclass[border=4pt]{standalone}
\usepackage{tikz}
\begin{document}
\begin{tikzpicture}[y=-5mm, every node/.style={right, font=\ttfamily\small}]
  \foreach \st/\w [count=\i] in {ultra thin/0.1pt, very thin/0.2pt, thin/0.4pt,
      semithick/0.6pt, thick/0.8pt, very thick/1.2pt, ultra thick/1.6pt}
    \draw[\st] (0,\i) -- (3,\i) node {\st\ = \w};
  \draw[line width=3pt] (0,8) -- (3,8) node {line width=3pt};
\end{tikzpicture}
\end{document}Dashed and dotted lines: the predefined styles
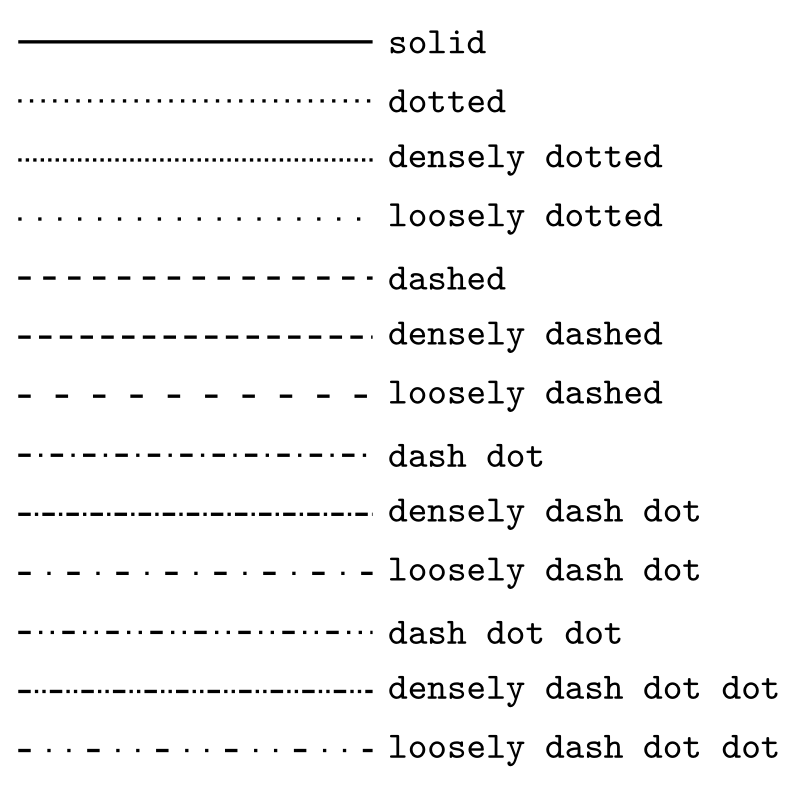
TikZ has 13 dash styles: solid (the default) and four families, each in a normal, densely and loosely version. The manual names them; the patterns below are their definitions in the TikZ source, where w is the current line width:
| Style | dash pattern |
|---|---|
dotted / densely dotted / loosely dotted | on w off 2pt / off 1pt / off 4pt |
dashed / densely dashed / loosely dashed | on 3pt off 3pt / on 3pt off 2pt / on 3pt off 6pt |
dash dot (also densely, loosely) | on 3pt off 2pt on w off 2pt (gaps 1pt / 4pt) |
dash dot dot (also densely, loosely) | on 3pt off 2pt on w off 2pt on w off 2pt (gaps 1pt / 4pt) |
A dot is as long as the line is wide, so a dotted line at the default 0.4pt is faint; combine it with thick or very thick, as in the picture, which is drawn thick. The older names dashdotted and dashdotdotted (with densely and loosely) still work and mean the same.
\usepackage{tikz}\begin{tikzpicture}[thick, y=-5mm, every node/.style={right, font=\ttfamily\small}]
\foreach \st [count=\i] in {solid, dotted, densely dotted, loosely dotted,
dashed, densely dashed, loosely dashed, dash dot, densely dash dot,
loosely dash dot, dash dot dot, densely dash dot dot, loosely dash dot dot}
\draw[\st] (0,\i) -- (3,\i) node {\st};
\end{tikzpicture}Full document
\documentclass[border=4pt]{standalone}
\usepackage{tikz}
\begin{document}
\begin{tikzpicture}[thick, y=-5mm, every node/.style={right, font=\ttfamily\small}]
  \foreach \st [count=\i] in {solid, dotted, densely dotted, loosely dotted,
      dashed, densely dashed, loosely dashed, dash dot, densely dash dot,
      loosely dash dot, dash dot dot, densely dash dot dot, loosely dash dot dot}
    \draw[\st] (0,\i) -- (3,\i) node {\st};
\end{tikzpicture}
\end{document}Custom dash patterns, dash phase and round dots
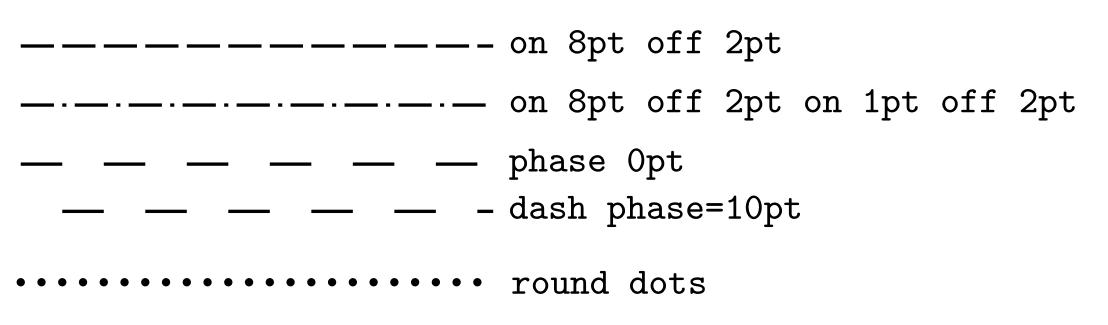
dash pattern=on 8pt off 2pt draws 8pt, leaves 2pt, and repeats; list more pairs for longer patterns such as dash-dot (on 8pt off 2pt on 1pt off 2pt). dash phase=10pt (initially 0pt) shifts where the pattern starts, useful to line up the dashes of parallel lines or to start a line with a gap; dash=on 10pt off 10pt phase 10pt sets both at once. dash expand off (with the decorations library, for patterns with one on and one off, written after the dash pattern) lets the gaps stretch so the pattern fits the line exactly.
For round dots, use dashes of zero length with round caps: line cap=round, dash pattern=on 0pt off 5pt on a line 2pt wide gives dots 2pt across, 5pt apart.
One trap with the dash dot styles: they read the line width at the moment the style is applied. [dash dot, line width=2pt] keeps 0.4pt dots on a 2pt line, while [line width=2pt, dash dot] gets proper 2pt dots. Put the width first. (dotted is not affected.)
\usepackage{tikz}\begin{tikzpicture}[thick, every node/.style={right, font=\ttfamily\small}]
\draw[dash pattern=on 8pt off 2pt] (0,2) -- (4,2) node {on 8pt off 2pt};
\draw[dash pattern=on 8pt off 2pt on 1pt off 2pt] (0,1.5) -- (4,1.5)
node {on 8pt off 2pt on 1pt off 2pt};
% dash phase shifts where the pattern starts
\draw[dash pattern=on 10pt off 10pt] (0,1) -- (4,1) node {phase 0pt};
\draw[dash pattern=on 10pt off 10pt, dash phase=10pt] (0,0.6) -- (4,0.6)
node {dash phase=10pt};
% round dots: zero-length dashes with round caps
\draw[line width=2pt, line cap=round, dash pattern=on 0pt off 5pt]
(0,0) -- (4,0) node {round dots};
\end{tikzpicture}Full document
\documentclass[border=4pt]{standalone}
\usepackage{tikz}
\begin{document}
\begin{tikzpicture}[thick, every node/.style={right, font=\ttfamily\small}]
  \draw[dash pattern=on 8pt off 2pt] (0,2) -- (4,2) node {on 8pt off 2pt};
  \draw[dash pattern=on 8pt off 2pt on 1pt off 2pt] (0,1.5) -- (4,1.5)
    node {on 8pt off 2pt on 1pt off 2pt};
  % dash phase shifts where the pattern starts
  \draw[dash pattern=on 10pt off 10pt] (0,1) -- (4,1) node {phase 0pt};
  \draw[dash pattern=on 10pt off 10pt, dash phase=10pt] (0,0.6) -- (4,0.6)
    node {dash phase=10pt};
  % round dots: zero-length dashes with round caps
  \draw[line width=2pt, line cap=round, dash pattern=on 0pt off 5pt]
    (0,0) -- (4,0) node {round dots};
\end{tikzpicture}
\end{document}Line ends and corners: line cap and line join
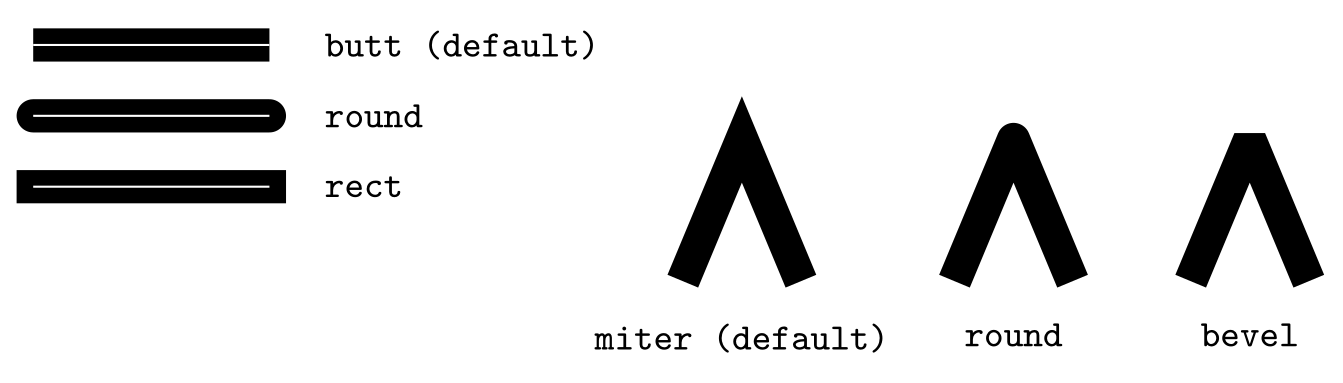
line cap sets how a line ends: butt (the initial value) stops exactly at the end point, round adds a half circle and rect a half square beyond it, so round and rect lines are longer by one line width in total. line join sets how corners look: miter (initial), round or bevel. A miter on a very sharp corner can stick out far; when it would exceed miter limit (initially 10) times the line width, it is cut to a bevel. Caps and joins only become visible on thick lines.
\usepackage{tikz}\begin{tikzpicture}[line width=8pt, every node/.style={font=\ttfamily\small}]
% line cap: how the ends look (the thin white line is the path itself)
\draw[line cap=butt] (0,2) -- (2,2) node[right=6pt] {butt (default)};
\draw[line cap=round] (0,1.4) -- (2,1.4) node[right=6pt] {round};
\draw[line cap=rect] (0,0.8) -- (2,0.8) node[right=6pt] {rect};
\draw[white, line width=0.5pt] (0,2) -- (2,2) (0,1.4) -- (2,1.4) (0,0.8) -- (2,0.8);
% line join: how corners look
\draw[line join=miter] (5.5,0) -- ++(0.5,1.2) -- ++(0.5,-1.2);
\draw[line join=round] (7.8,0) -- ++(0.5,1.2) -- ++(0.5,-1.2);
\draw[line join=bevel] (9.8,0) -- ++(0.5,1.2) -- ++(0.5,-1.2);
\node[below] at (6,-0.1) {miter (default)};
\node[below] at (8.3,-0.1) {round};
\node[below] at (10.3,-0.1) {bevel};
\end{tikzpicture}Full document
\documentclass[border=4pt]{standalone}
\usepackage{tikz}
\begin{document}
\begin{tikzpicture}[line width=8pt, every node/.style={font=\ttfamily\small}]
  % line cap: how the ends look (the thin white line is the path itself)
  \draw[line cap=butt]  (0,2)   -- (2,2)   node[right=6pt] {butt (default)};
  \draw[line cap=round] (0,1.4) -- (2,1.4) node[right=6pt] {round};
  \draw[line cap=rect]  (0,0.8) -- (2,0.8) node[right=6pt] {rect};
  \draw[white, line width=0.5pt] (0,2) -- (2,2) (0,1.4) -- (2,1.4) (0,0.8) -- (2,0.8);
  % line join: how corners look
  \draw[line join=miter] (5.5,0) -- ++(0.5,1.2) -- ++(0.5,-1.2);
  \draw[line join=round] (7.8,0) -- ++(0.5,1.2) -- ++(0.5,-1.2);
  \draw[line join=bevel] (9.8,0) -- ++(0.5,1.2) -- ++(0.5,-1.2);
  \node[below] at (6,-0.1)    {miter (default)};
  \node[below] at (8.3,-0.1)  {round};
  \node[below] at (10.3,-0.1) {bevel};
\end{tikzpicture}
\end{document}Double lines
double draws the path twice: first in the line colour, then narrower in the core colour (white unless you write double=yellow), which looks like two parallel lines and works on curves too. double distance=3pt (initially 0.6pt) sets the gap and switches double on by itself; the outer path is then twice the line width plus the gap wide. double distance between line centers measures centre to centre instead.
The same trick makes one line appear to pass over another: draw the top line with draw=white, double=black and its white edges cut a gap into the line underneath.
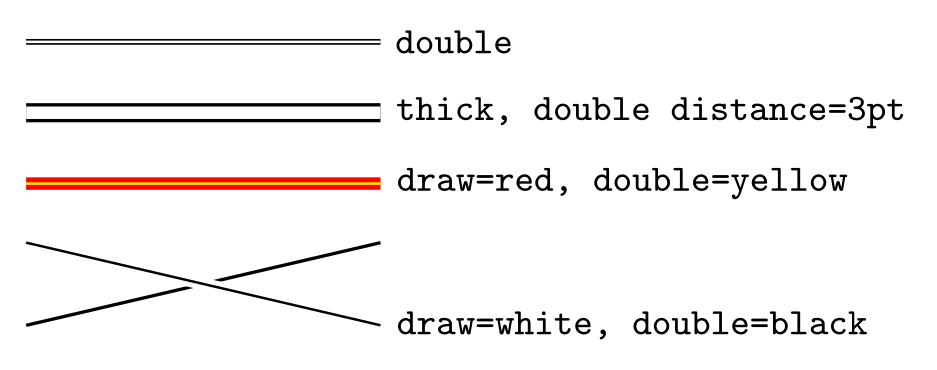
\usepackage{tikz}\begin{tikzpicture}[every node/.style={right, font=\ttfamily\small}]
\draw[double] (0,1.8) -- (3,1.8) node {double};
\draw[thick, double distance=3pt] (0,1.2) -- (3,1.2) node {thick, double distance=3pt};
\draw[draw=red, double=yellow, very thick] (0,0.6) -- (3,0.6) node {draw=red, double=yellow};
% a white "border" makes one line seem to pass over another
\draw[thick] (0,-0.6) -- (3,0.1);
\draw[draw=white, double=black, very thick] (0,0.1) -- (3,-0.6) node {draw=white, double=black};
\end{tikzpicture}Full document
\documentclass[border=4pt]{standalone}
\usepackage{tikz}
\begin{document}
\begin{tikzpicture}[every node/.style={right, font=\ttfamily\small}]
  \draw[double] (0,1.8) -- (3,1.8) node {double};
  \draw[thick, double distance=3pt] (0,1.2) -- (3,1.2) node {thick, double distance=3pt};
  \draw[draw=red, double=yellow, very thick] (0,0.6) -- (3,0.6) node {draw=red, double=yellow};
  % a white "border" makes one line seem to pass over another
  \draw[thick] (0,-0.6) -- (3,0.1);
  \draw[draw=white, double=black, very thick] (0,0.1) -- (3,-0.6) node {draw=white, double=black};
\end{tikzpicture}
\end{document}Line colour and transparency
A colour name in the options colours the line: red, or xcolor mixes like blue!50 (half blue, half white) and green!50!black. draw=red sets only the line colour, while color=red (or just red) also colours fills and node text on that path. draw opacity=0.5 makes the line see-through, and opacity sets the line and fill opacity together. Named shortcuts exist: semitransparent is opacity 0.5, nearly transparent 0.25 and nearly opaque 0.75.
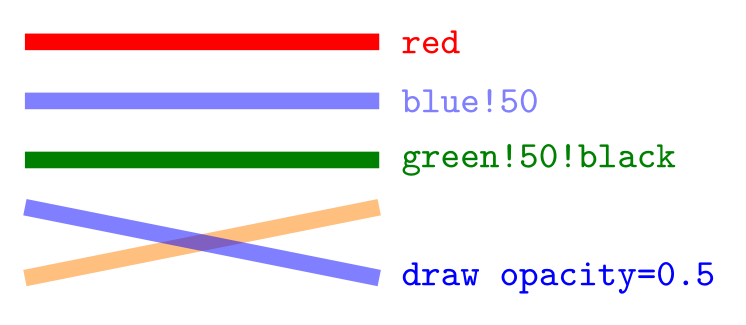
\usepackage{tikz}\begin{tikzpicture}[line width=4pt, every node/.style={right, font=\ttfamily\small}]
\draw[red] (0,2) -- (3,2) node {red};
\draw[blue!50] (0,1.5) -- (3,1.5) node {blue!50};
\draw[green!50!black] (0,1) -- (3,1) node {green!50!black};
% draw opacity: lines that cross show each other
\draw[orange, draw opacity=0.5] (0,0) -- (3,0.6);
\draw[blue, draw opacity=0.5] (0,0.6) -- (3,0) node {draw opacity=0.5};
\end{tikzpicture}Full document
\documentclass[border=4pt]{standalone}
\usepackage{tikz}
\begin{document}
\begin{tikzpicture}[line width=4pt, every node/.style={right, font=\ttfamily\small}]
  \draw[red]           (0,2)   -- (3,2)   node {red};
  \draw[blue!50]       (0,1.5) -- (3,1.5) node {blue!50};
  \draw[green!50!black] (0,1)  -- (3,1)   node {green!50!black};
  % draw opacity: lines that cross show each other
  \draw[orange, draw opacity=0.5] (0,0)    -- (3,0.6);
  \draw[blue, draw opacity=0.5]   (0,0.6)  -- (3,0) node {draw opacity=0.5};
\end{tikzpicture}
\end{document}Polylines, closed shapes and right angles
One \draw with several -- makes a polyline with proper corners. To close a shape, end with -- cycle instead of repeating the first point: with a repeated point the path simply ends there and the first corner is not joined, which shows as a notch on thick lines (left triangle); cycle closes the path, so every corner is joined (right triangle) and the shape can be filled.
-| goes horizontally first and then vertically to the target, |- vertically first: the usual way to draw right-angled connectors. A coordinate without -- before it starts a new piece of the same path, so \draw (0,0) -- (1,0) (2,0) -- (3,0); draws two separate segments with one command.
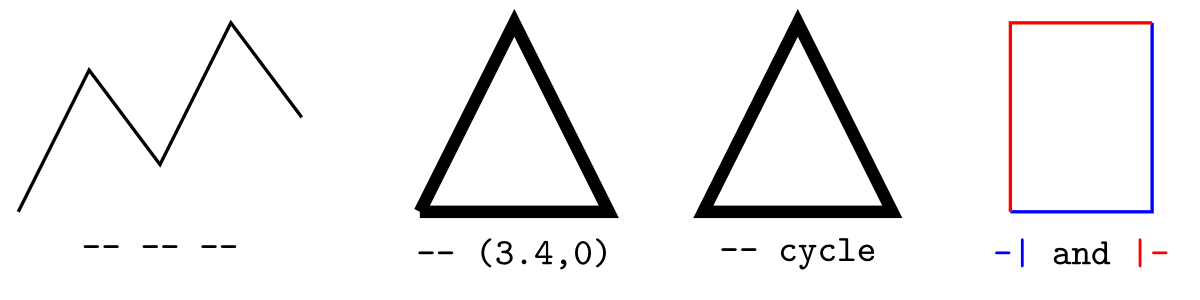
\usepackage{tikz}\begin{tikzpicture}[every node/.style={below, font=\ttfamily\small}]
% a polyline: one path through several points
\draw[thick] (0,0) -- (0.6,1.2) -- (1.2,0.4) -- (1.8,1.6) -- (2.4,0.8);
\node at (1.2,-0.1) {-- -- --};
% closing a shape: repeat the first point (left) or use cycle (right)
\draw[line width=3pt] (3.4,0) -- (4.2,1.6) -- (5,0) -- (3.4,0);
\node at (4.2,-0.1) {-- (3.4,0)};
\draw[line width=3pt] (5.8,0) -- (6.6,1.6) -- (7.4,0) -- cycle;
\node at (6.6,-0.1) {-- cycle};
% right angles: -| goes horizontally first, |- vertically first
\draw[thick, blue] (8.4,0) -| (9.6,1.6);
\draw[thick, red] (8.4,0) |- (9.6,1.6);
\node at (9,-0.1) {\textcolor{blue}{-|} and \textcolor{red}{|-}};
\end{tikzpicture}Full document
\documentclass[border=4pt]{standalone}
\usepackage{tikz}
\begin{document}
\begin{tikzpicture}[every node/.style={below, font=\ttfamily\small}]
  % a polyline: one path through several points
  \draw[thick] (0,0) -- (0.6,1.2) -- (1.2,0.4) -- (1.8,1.6) -- (2.4,0.8);
  \node at (1.2,-0.1) {-- -- --};
  % closing a shape: repeat the first point (left) or use cycle (right)
  \draw[line width=3pt] (3.4,0) -- (4.2,1.6) -- (5,0) -- (3.4,0);
  \node at (4.2,-0.1) {-- (3.4,0)};
  \draw[line width=3pt] (5.8,0) -- (6.6,1.6) -- (7.4,0) -- cycle;
  \node at (6.6,-0.1) {-- cycle};
  % right angles: -| goes horizontally first, |- vertically first
  \draw[thick, blue] (8.4,0) -| (9.6,1.6);
  \draw[thick, red]  (8.4,0) |- (9.6,1.6);
  \node at (9,-0.1) {\textcolor{blue}{-|} and \textcolor{red}{|-}};
\end{tikzpicture}
\end{document}Grid lines and axes
\draw (0,0) grid (4,3); fills the rectangle between the two corners with grid lines, step apart (initially 1cm; xstep and ystep set the two directions). Combine a fine grid in help lines with a coarser one in gray, then draw the axes with arrow tips on top. The lines are placed so that the grid contains (0,0), at multiples of the step, so they only meet the corners if those are multiples of the step too, and because of rounding the last line is sometimes left out; the manual’s fix is to extend the corner a little, as in (4.001,3.001).
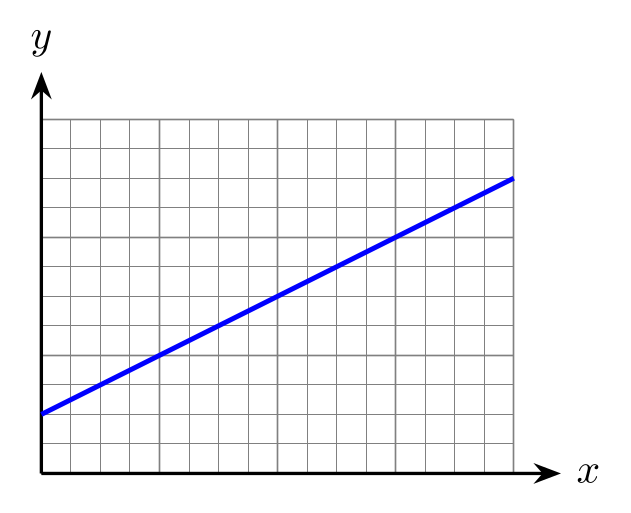
\usepackage{tikz} \usetikzlibrary{arrows.meta}\begin{tikzpicture}
\draw[help lines, step=0.25] (0,0) grid (4,3); % fine grid
\draw[gray, step=1] (0,0) grid (4,3); % major lines
\draw[thick, -Stealth] (0,0) -- (4.4,0) node[right] {$x$};
\draw[thick, -Stealth] (0,0) -- (0,3.4) node[above] {$y$};
\draw[very thick, blue] (0,0.5) -- (4,2.5);
\end{tikzpicture}Full document
\documentclass[border=4pt]{standalone}
\usepackage{tikz}
\usetikzlibrary{arrows.meta}
\begin{document}
\begin{tikzpicture}
  \draw[help lines, step=0.25] (0,0) grid (4,3);      % fine grid
  \draw[gray, step=1] (0,0) grid (4,3);               % major lines
  \draw[thick, -Stealth] (0,0) -- (4.4,0) node[right] {$x$};
  \draw[thick, -Stealth] (0,0) -- (0,3.4) node[above] {$y$};
  \draw[very thick, blue] (0,0.5) -- (4,2.5);
\end{tikzpicture}
\end{document}Reusable line styles
When the same look appears many times, name it once: \tikzset{guide/.style={densely dashed, gray, thin}, edge/.style={very thick, blue!70!black}} in the preamble, then \draw[guide] …. Changing the style changes every line that uses it. A style can take a value, too: \tikzset{w/.style={line width=#1}} and \draw[w=3pt].
Common errors and how to fix them
| LaTeX says (or you see) | Cause and fix |
|---|---|
| Package pgfkeys Error: I do not know the key '/tikz/ultrathick' and I am going to ignore it. Perhaps you misspelled it. | The named widths and dash styles are written with spaces: ultra thick, very thin, densely dashed, dash dot. |
| Package PGF Math Error: Unknown function `thick' (in 'thick'). | line width needs a length. Write thick on its own (\draw[thick]) or line width=0.8pt. |
| Package tikz Error: Giving up on this path. Did you forget a semicolon? | Every \draw ends with a semicolon; add the missing ; after the last coordinate. |
| A dotted line is almost invisible | Each dot is as long as the line is wide, 0.4pt by default. Add thick or very thick, or use round dots: line cap=round, dash pattern=on 0pt off 4pt. |
| The dots of dash dot stay thin on a thick line | dash dot reads the line width when it is applied. Write the width first: [line width=2pt, dash dot], not [dash dot, line width=2pt]. |
| A notch at the first corner of a closed shape | Close the path with -- cycle instead of going back to the first point. |
| The last line of a grid is missing | A rounding effect the manual describes: extend the far corner slightly, for example (4.001,3.001) instead of (4,3). |
Frequently asked questions
How do I draw a dashed line in TikZ?
Add dashed to the options: \draw[dashed] (0,0) -- (3,0);. Use densely dashed or loosely dashed for shorter or longer gaps, dotted or dash dot for other styles, and dash pattern=on 4pt off 2pt for exact lengths. dashed is on 3pt off 3pt.
How do I change the line thickness in TikZ?
Use a named width such as \draw[thick] or \draw[ultra thick], or set it exactly with \draw[line width=1.5pt]. The named widths run from ultra thin (0.1pt) through thin (0.4pt, the default) to ultra thick (1.6pt).
What is the default line width in TikZ?
0.4pt, which is also the width of the thin style. Arrow tips and the outer separation of nodes scale with the current line width, so they grow when you make lines thicker.
How do I make every line in a picture thick or dashed?
Put the option on the picture or on a scope: \begin{tikzpicture}[thick, dashed] applies to every path inside. For all pictures in a document, use \tikzset{every picture/.style={thick}} in the preamble.
How do I draw a dotted line with round dots?
Use zero-length dashes with round caps: \draw[line width=1.5pt, line cap=round, dash pattern=on 0pt off 4pt] (0,0) -- (3,0);. The dots are as wide as the line and 4pt apart. The built-in dotted style draws short square dashes instead.
How do I draw a line with a given length and angle?
Use a relative polar coordinate: \draw (1,1) -- ++(30:2); draws a 2 cm line from (1,1) at 30 degrees. ++(3,0) draws 3 cm to the right of the previous point.
References
- PGF/TikZ manual, §14.2 The Line-To Operation (--, -| and |-)tikz.dev
- PGF/TikZ manual, §13.4 Relative and Incremental Coordinatestikz.dev
- PGF/TikZ manual, §15.3.1 Graphic Parameters: Line Width, Line Cap, and Line Jointikz.dev
- PGF/TikZ manual, §15.3.2 Graphic Parameters: Dash Patterntikz.dev
- PGF/TikZ manual, §15.3.4 Graphic Parameters: Double Lines and Bordered Linestikz.dev
- PGF/TikZ manual, §15.2 Specifying a Colortikz.dev
- PGF/TikZ manual, §23.2 Specifying a Uniform Opacitytikz.dev
- PGF/TikZ manual, §14.8 The Grid Operationtikz.dev
- pgf package (TikZ) on CTAN, with the full manual as PDFctan.org
The facts on this page were checked against these sources, and every picture is the code with it typeset with TeX Live 2026. Code on this page: CC0 1.0, copy it freely.
Try the code in your browserEvery snippet on this page opens in the free TikZ editor: it is typeset with TeX Live as you type, with errors pointed at their line.
Open the TikZ editor