GraphPad Prism vs LabCanvas: a free Prism alternative for graphs and statistics, compared
GraphPad Prism or LabCanvas Graphs? Statistics, export, Prism file import, price and platforms side by side, a dose–response example, and when Prism wins.
Contents
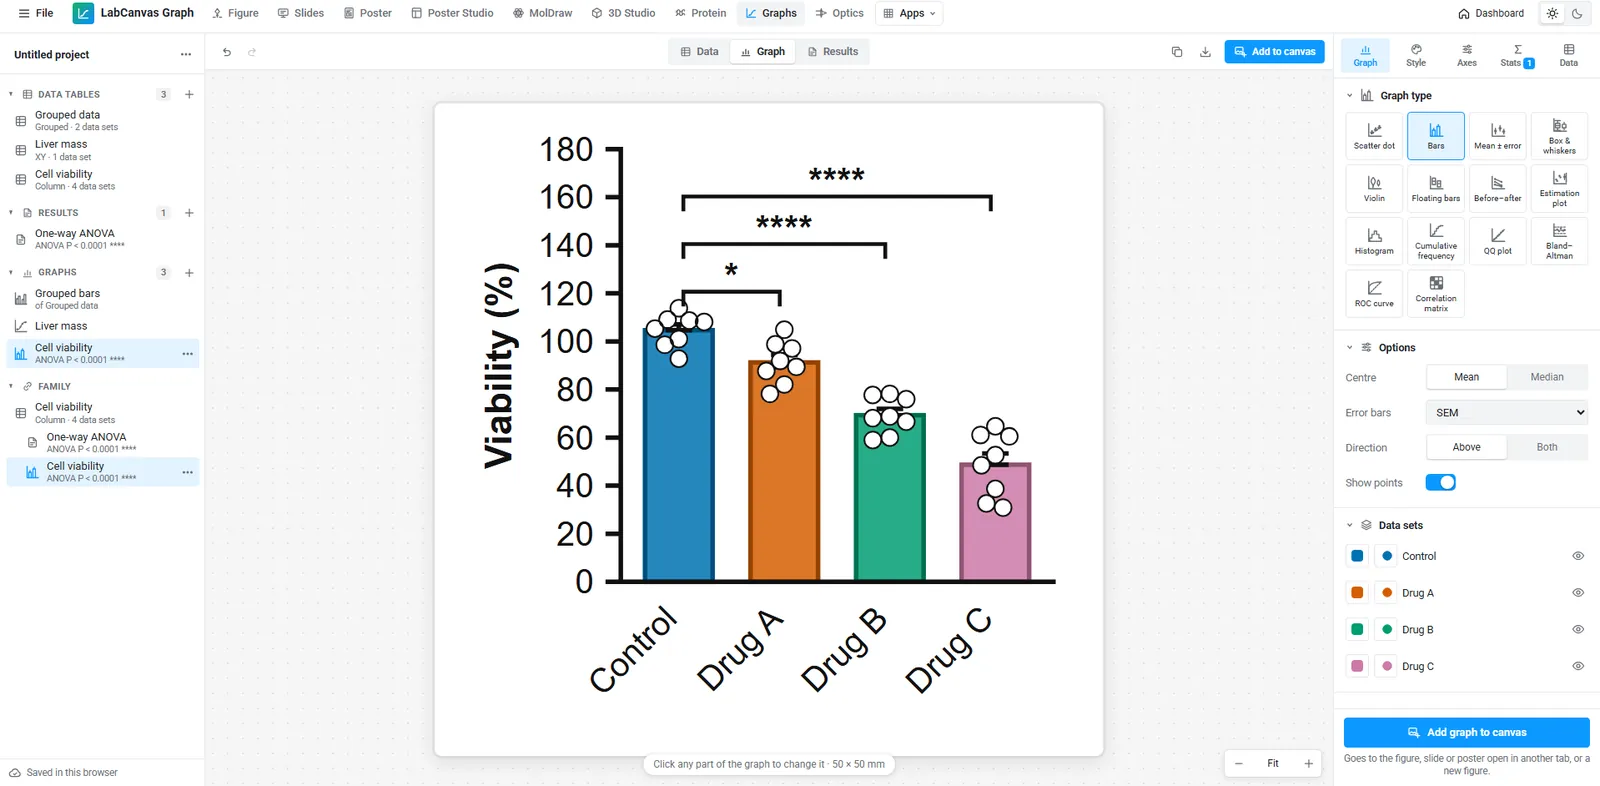
The verdict: GraphPad Prism is a long-established desktop program for statistics and graphs, used in many biology and pharmacology labs: a broad, well-documented set of analyses, vector graph export (PDF, SVG, EPS), Prism Cloud for sharing projects, and years of lab habits built around its files. LabCanvas Graphs & statistics follows the same model (typed data tables, analyses, graphs) in the browser, is free to start, imports the data tables of Prism files, and puts each graph straight into a figure, slide or poster, still linked to its data. Choose Prism when you depend on existing Prism projects, editable vector graph files or a workflow your institution has already built around Prism; choose LabCanvas when you want Prism-style statistics without an installation or a licence, with your figures, image measurements and chemistry in the same workspace.
We make LabCanvas, so weigh what follows with that in mind. Everything said about GraphPad Prism comes from its maker’s own website, help pages and guides, checked in November 2026 and listed under Sources; prices and plans change, so follow the links before you decide. If something here is out of date or wrong, write to labcanvasapp@gmail.com and we will correct it.
Side by side, task by task
| Task | GraphPad Prism | LabCanvas |
|---|---|---|
| Graphs | Graphs made from each data table; layouts put several graphs, text, drawings and imported pictures on one page; Magic makes graphs look like an example | 132 graph types, from scatter dot plots and box plots to Kaplan–Meier, volcano, forest and PCA plots (all of them); layouts with panel letters; formatting copied from one graph to another |
| Statistics | t tests; one-, two- and three-way ANOVA (any number of factors with Prism Pro); linear and nonlinear regression including dose–response; Kaplan–Meier and Cox regression; PCA; multiple logistic regression; clustering with Prism Pro | t tests and nonparametric tests; ANOVA up to three-way, repeated measures and mixed-effects models; 76 built-in curve-fit equations; regression; survival including Cox; contingency; PCA; clustering; each checked against SciPy, statsmodels, lifelines and R |
| Chemistry drawing | Not part of Prism | MolDraw for structures and reactions |
| Image analysis | Not part of Prism | Image Analysis: counts, blots, intensities; results go to Graphs |
| Illustration | Text and drawing objects on graphs and layouts | A full vector figure editor with 5,300+ adjustable science objects |
| Reuse and templates | Example files, method files and the Wand repeat an analysis and its graph on new data; templates (an older feature) | Graph presets with example data; apply an analysis and its graph to every similar table in one step; 250+ figure templates |
| Export | Vector PDF, SVG (Prism 10.6 and later) and EPS; TIFF up to 1,200 dpi; PNG; EMF and WMF on Windows | Pictures only: PNG (300 or 600 dpi), TIFF (300, 600 or 1,200 dpi) and a PDF holding a 600 dpi picture; no SVG, EPS or vector PDF |
| Files | .prism (Prism 10 and later); older .pzfx and .pzf files open in Compatibility Mode | Imports the data tables of .prism and .pzfx files, CSV and Excel (.xlsx); saves tables as .pzfx for Prism users |
| Collaboration | Prism Cloud: share a project with Commenters and Editors; Editors work in the desktop app | Graph projects are your own; a graph placed in a figure, slide or poster is shared with it (link or invitation; view, comment or edit), and several people can edit at once (how) |
| Price | Paid subscription (Standard, Pro and Enterprise plans, with student, academic and corporate prices) after a 30-day free trial; see GraphPad’s pricing page | Free with an account (up to 3 designs, no downloads); LabCanvas Pro US$19 a month or US$199 a year for downloads, unlimited designs and every app |
| Platforms | Windows 10 and 11 (64-bit); macOS 12 or later (macOS 13 from Prism 11.3); must reach GraphPad’s licence server at least every 30 days | Any modern browser on Windows, macOS, Linux or a Chromebook; needs an internet connection |
| Learning | Detailed Statistics and Curve Fitting Guides and Prism Academy courses | The same table types and equation names as Prism, a visual guide and tutorials |
Pick Prism when
- You reopen existing Prism projects with their graphs, analyses and layouts. LabCanvas brings in the data tables only.
- You need editable vector graph files. Prism exports vector PDF, SVG and EPS; LabCanvas exports pictures (PNG, TIFF and an image PDF).
- Your institution has built procedures around Prism. Neither program is validated for 21 CFR Part 11 by its maker (GraphPad’s FAQ says Prism keeps no audit trail), but if your organisation has validated Prism for its own procedures, or a core facility expects Prism files, stay with it.
- You work offline. Prism is a desktop program; it only has to reach GraphPad’s licence server once every 30 days.
- Your collaborators share work in Prism Cloud, or you rely on Prism Pro analyses or a method you have not found in the LabCanvas Graphs guide.
- You want GraphPad’s guides at your elbow: its Statistics Guide and Curve Fitting Guide explain every analysis in depth.
Pick LabCanvas when
- You want Prism-style statistics without an installation or a licence. Open Graphs & statistics in a browser, including on Linux or a Chromebook, and start free.
- Your graph belongs in a figure. Add to canvas places the graph in the figure editor, a slide or a poster, linked to its data: correct a value and the figure updates.
- Your numbers come from images. Image Analysis sends counts, areas and band intensities to Graphs with a methods sentence.
- You want to see how the statistics are checked. Every analysis is tested against SciPy, statsmodels, lifelines and R in more than 42,000 automated checks, and every graph type is drawn from reference data and read back point by point in 3,473 more (statistics validation).
- One subscription should cover the whole paper: figures, slides, posters, chemical structures, 3D models and image analysis come with the same account.
Example: a dose–response figure in each
The same job, from concentrations and responses to a fitted curve with its IC50 in a figure.
In GraphPad Prism
- Create an XY data table. Enter the logarithm of each concentration as X (Prism can transform raw concentrations to logs for you) and the replicate responses as Y.
- Click Analyze, choose Nonlinear regression (curve fit), and in the dose–response inhibition equations pick log(inhibitor) vs. response – Variable slope (four parameters).
- The results sheet gives Bottom, Top, LogIC50, HillSlope and the IC50, and Prism draws the fitted curve on the graph.
- Format the graph, place it on a layout with the other panels if you like, and export it, for example as a vector PDF or a TIFF at 1,200 dpi, for the program you assemble the figure in.
In LabCanvas
- Open Graphs & statistics and choose Dose–response curve on the start page; it opens with example data.
- Paste log concentrations into X and the replicates into Y, straight from Excel.
- In the Stats tab set Equation to log(inhibitor) vs. response — Variable slope (four parameters). The results give Bottom, Top, LogIC50, HillSlope and the IC50 with its 95% confidence interval.
- Click Add to canvas to put the graph in your figure next to images and schematics, then export the figure at the journal’s column width and resolution (LabCanvas Pro).
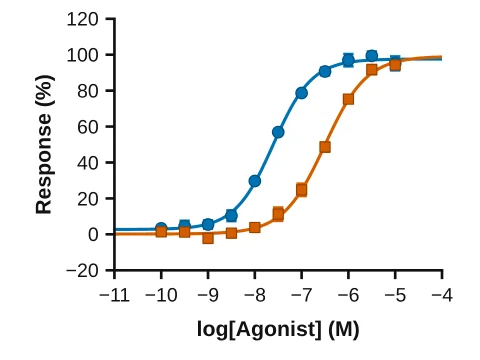
The fitted values should agree closely, because both programs fit the same four-parameter logistic model by least squares; LabCanvas’s fits are checked against SciPy in its validation suite. Report the model and the program you used.
What LabCanvas Graphs covers
| Area | In LabCanvas Graphs & statistics |
|---|---|
| Data tables | Column, XY, grouped, survival, contingency, parts of whole, nested and multiple variables; values as replicates or as mean with SD/SEM and N; paste from Excel |
| Compare two groups | Unpaired, Welch and paired t tests with effect sizes, Mann–Whitney and Wilcoxon with Hodges–Lehmann estimates, two-sample Kolmogorov–Smirnov, nested t test |
| Compare several groups | One-, two- and three-way ANOVA, repeated measures and mixed-effects models, nested ANOVA, Welch and Brown–Forsythe ANOVA, Kruskal–Wallis, Friedman; Tukey, Dunnett, Šidák, Holm–Šidák, Games–Howell, Dunnett T3 and other post-hoc tests |
| Curve fitting | 76 built-in equations (dose–response including 5PL, biphasic and bell-shaped; binding; enzyme kinetics and inhibition; exponential and growth; Boltzmann; polynomials; 4PL and 5PL standard curves) or your own; weighting, constraints, shared parameters, model comparison by F test or AICc, confidence and prediction bands, ROUT outlier removal, residual plots |
| Standard curves | Interpolate unknowns (ELISA, protein assays) with 95% confidence intervals |
| Regression and correlation | Simple and multiple linear, logistic, Poisson and Deming regression; compare slopes and intercepts; Pearson, Spearman and Kendall correlation matrices; PCA |
| Survival | Kaplan–Meier curves with numbers at risk, log-rank tests, median survival with CI, Cox proportional hazards regression |
| Contingency | Chi-square (including trend), Fisher’s exact test, odds and risk ratios, sensitivity and specificity, McNemar, Cohen’s kappa |
| Clustering and simulation | Hierarchical clustering drawn as a clustered heat map with dendrograms, k-means; simulated data and Monte Carlo simulation of any analysis |
| More | Outlier tests (ROUT, Grubbs), normality tests, area under curve, transforms and normalisation, frequency distributions, false discovery rate, sample size and power |
| Batch work | Apply an analysis and its graph to every similar table in one step, import many files at once, compare the key numbers side by side |
Moving from Prism to LabCanvas
- In LabCanvas Graphs, open the project menu (beside the project name) and choose Import data, or click Import data on the start page, and pick your .prism or .pzfx files. Several files can be imported at once.
- Each Prism data table becomes a LabCanvas table of the same kind, with its replicates, summary format (mean with SD, SEM or %CV and N), row and column titles and excluded values. LabCanvas lists anything it could not bring over exactly.
- Re-create the analyses and graphs: choose the graph type and the analysis in the Stats tab. Prism keeps graphs and results in a part of the file only Prism can read, so they are not imported.
- To hand data back to a Prism user, choose Save tables for Prism (.pzfx); Prism opens the file in Compatibility Mode. Excel workbooks (.xlsx) and CSV files import the same way.
Importing is free; saving files from LabCanvas (graphs, .pzfx tables, Excel results) is part of LabCanvas Pro.
Sources
GraphPad pages, checked November 2026:
- Prism features and Prism Pro: analyses and what the Pro plan adds
- Overview of GraphPad Prism plans (FAQ 2263) and pricing: Standard, Pro and Enterprise plans; student, academic and corporate pricing
- How do I get a free trial?: the 30-day trial
- Prism 11 system requirements: Windows, macOS and the licence check every 30 days
- The differences between export formats (Prism 11 user guide): PDF, SVG, EPS, TIFF, PNG, EMF and WMF
- Older (PZF and PZFX) files and opening .prism files in earlier versions (FAQ 2241)
- Sharing projects in Prism Cloud and Prism Cloud co-editing
- Creating a layout, Prism Magic and template, method and example files
- Equation: log(inhibitor) vs. response – Variable slope (Prism 11 curve fitting guide)
- Has Prism been validated? Does it comply with 21 CFR Part 11? (FAQ 872)
LabCanvas: the Graphs guide, the statistics validation page and the pricing page. GraphPad Prism is a trademark of GraphPad Software; LabCanvas is not affiliated with GraphPad.
Frequently asked questions
Is there a free alternative to GraphPad Prism?
LabCanvas Graphs & statistics works the way Prism does (typed data tables, analyses and graphs in one project) and runs in the browser. It is free to use with an account, up to 3 designs; downloads and unlimited designs are part of LabCanvas Pro (US$19 a month or US$199 a year). For a single calculation, the free tools such as the IC50 calculator need no account.
Can LabCanvas open GraphPad Prism files?
Yes, the data tables. The project menu’s Import data reads Prism 10 and later project files (.prism) and Prism XML files (.pzfx): column, XY, grouped, survival, contingency, parts of whole, nested and multiple-variables tables, with replicates, mean ± SD/SEM/CV and N, titles and excluded values. Prism’s graphs, analyses and layouts are not imported; you redo them in LabCanvas. Save tables for Prism (.pzfx) writes your tables back for colleagues who use Prism.
Does LabCanvas export vector graphs like Prism?
No. LabCanvas exports graphs as pictures: PNG at 300 or 600 dpi, TIFF at 300, 600 or 1,200 dpi, and a PDF that holds a 600 dpi picture. Prism exports vector PDF, SVG (Prism 10.6 and later) and EPS. If a journal or a designer needs an editable vector file of the graph, use Prism.
Is Prism or LabCanvas validated for regulated work (21 CFR Part 11)?
Neither is validated by its maker. GraphPad’s FAQ says Prism does not keep an audit trail and that compliance with FDA rules is the user’s responsibility; LabCanvas has no audit trail either. LabCanvas publishes how its statistics are checked against SciPy, statsmodels, lifelines and R on its statistics validation page, but that is not a regulatory validation.
Can I fit a dose–response curve and get the IC50 in LabCanvas?
Yes. Nonlinear regression includes log(agonist) and log(inhibitor) vs. response with a variable slope (four parameters), the three-parameter forms and 5PL, and reports the EC50 or IC50 with its confidence interval. The free IC50 calculator does the same for one curve without an account.
Does GraphPad Prism run in a web browser?
Prism is a desktop program for Windows and macOS. Prism Cloud shares projects with colleagues, who can view and comment; Editors make changes in the desktop app and publish them. LabCanvas runs entirely in the browser, including on Linux and Chromebooks.
Can LabCanvas run ANOVA with post-hoc tests?
Yes: one-, two- and three-way ANOVA, repeated measures (with a mixed-effects model when values are missing), nested ANOVA, Welch and Brown–Forsythe ANOVA, Kruskal–Wallis and Friedman, with Tukey, Dunnett, Šidák, Holm–Šidák, Games–Howell, Dunnett T3 and other comparisons. Significance brackets are drawn on the graph from the results.
Try it in LabCanvas
Every app is free to start in your browser. Create an account and begin.
Open the LabCanvas dashboardKeep reading
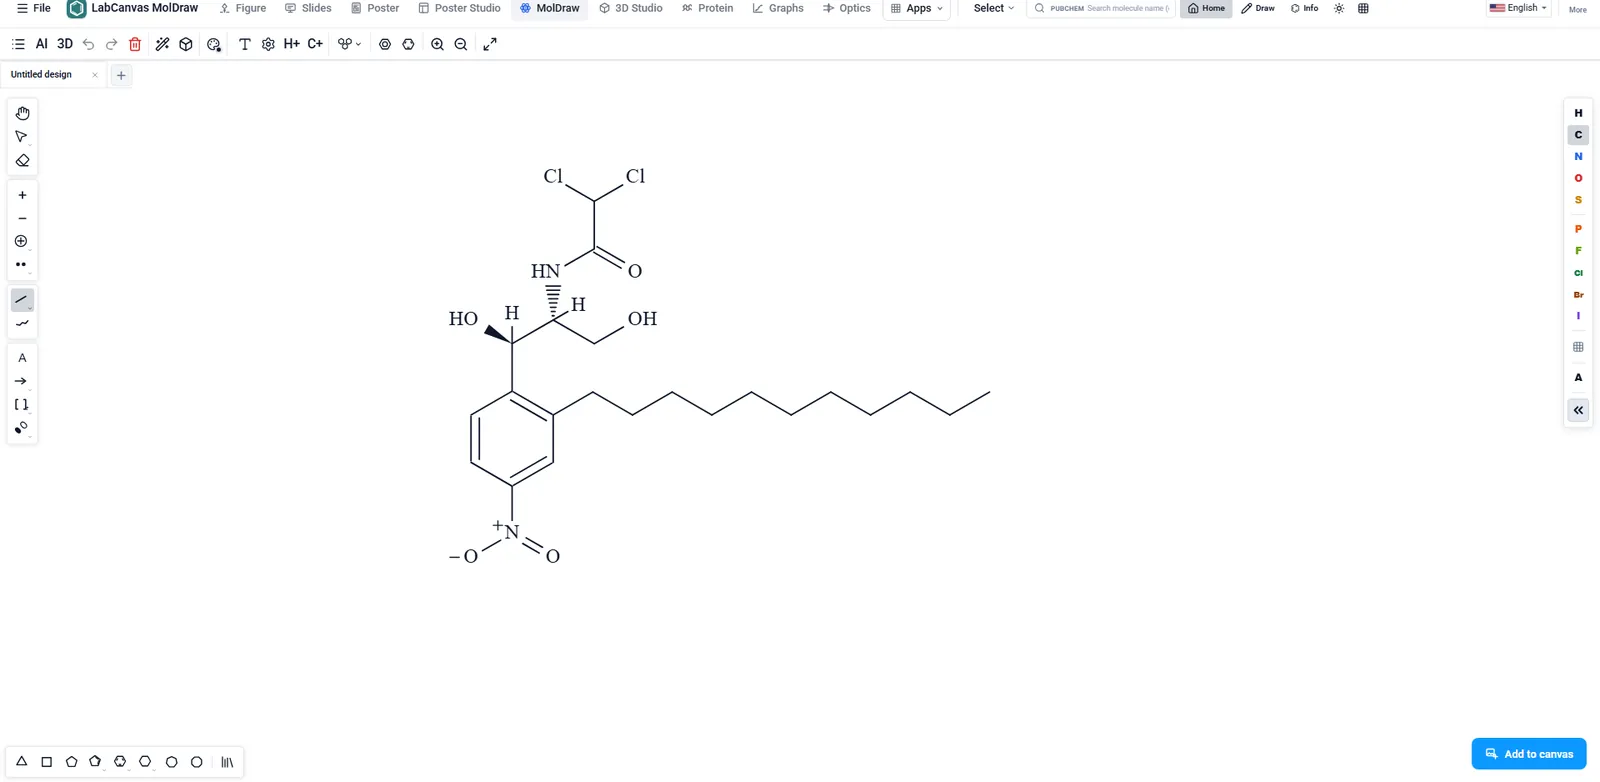
ChemDraw vs LabCanvas MolDraw: chemical structure drawing compared
ChemDraw or LabCanvas MolDraw? Drawing, names, NMR, file formats, price and platforms side by side, a reaction-scheme example, and when ChemDraw is better.
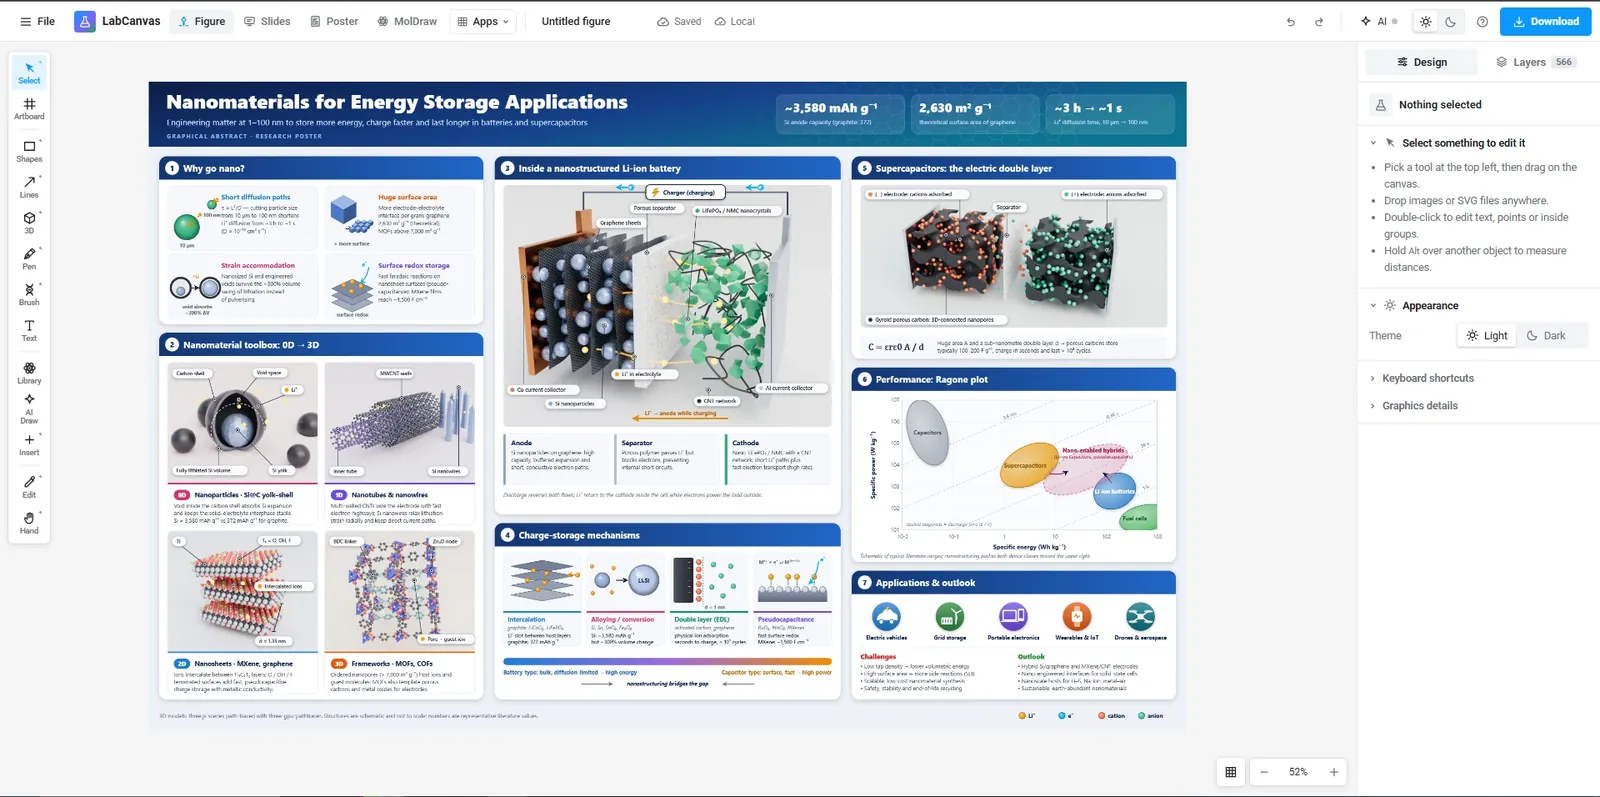
Canva vs LabCanvas for scientific figures: an honest comparison
Canva or LabCanvas for science figures? Graphs, science content, export, price and platforms compared, a graphical abstract in each, and when Canva wins.
Inkscape vs LabCanvas for scientific figures: an honest comparison
Inkscape or LabCanvas for scientific figures? Vector tools, science content, LaTeX, export, price and platforms side by side, and when Inkscape is better.