Inkscape vs LabCanvas for scientific figures: an honest comparison
Inkscape or LabCanvas for scientific figures? Vector tools, science content, LaTeX, export, price and platforms side by side, and when Inkscape is better.
Contents
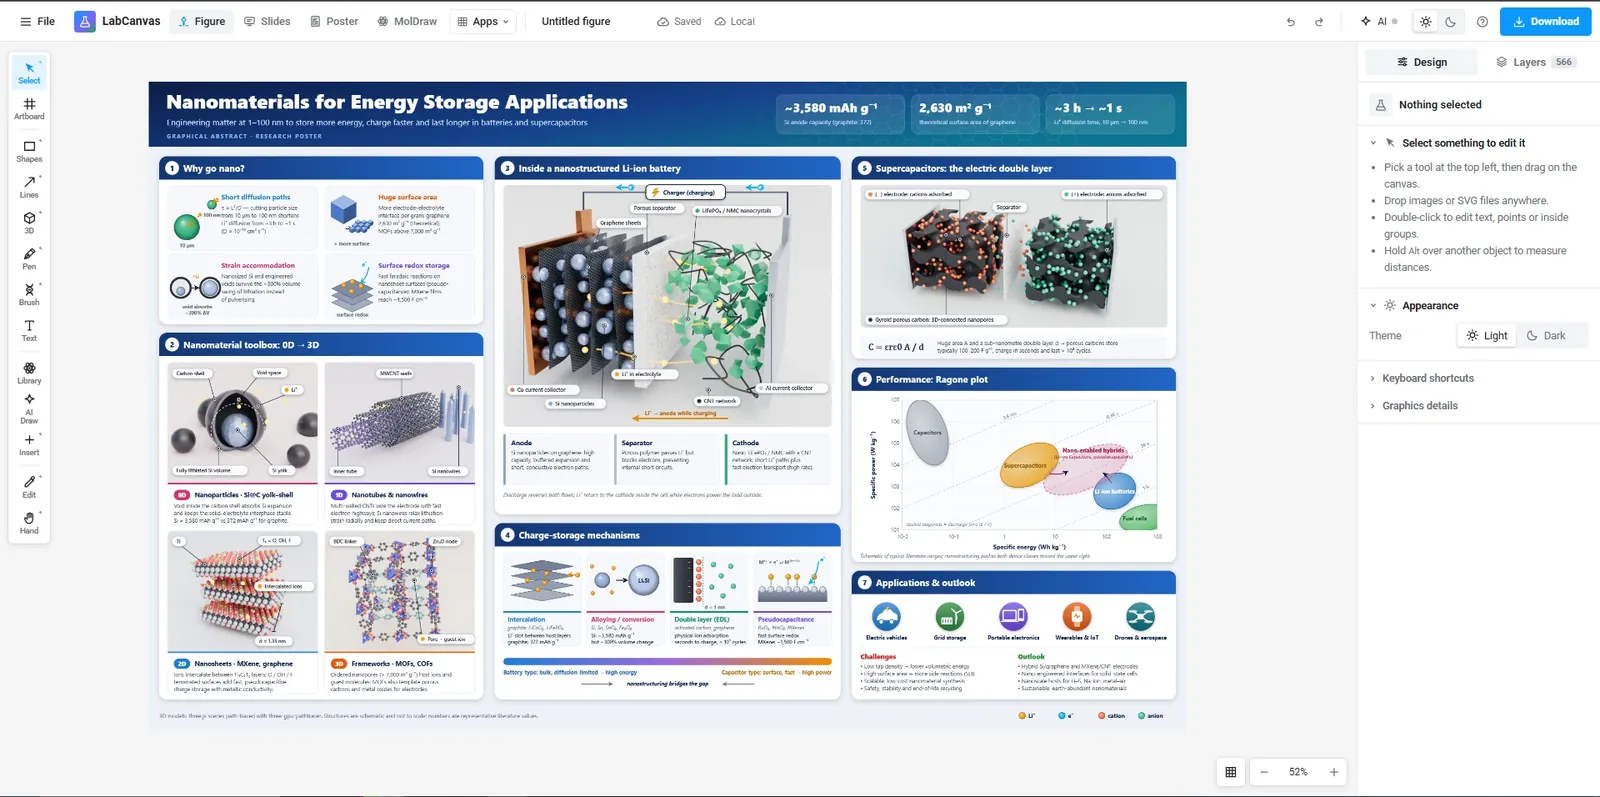
The verdict: Inkscape is a free, open-source vector editor for Windows, macOS and Linux, with full control over every path, node and letter, editable vector output (SVG, PDF, EPS, EMF) and a long list of extensions. It is a general drawing program: the graphs, structures and scientific artwork come from other software or libraries. LabCanvas is a browser workspace made for science figures: 5,300+ adjustable science objects, Prism-style graphs with statistics, chemical structures, 3D crystals and image analysis on one canvas, with export at a journal’s width and resolution, but as pictures, not editable vector files. Choose Inkscape when you want a free, offline, open-source tool and editable vector files; choose LabCanvas when you want the science content drawn for you and the data, chemistry and illustration in one place.
We make LabCanvas, so weigh what follows with that in mind. Everything said about Inkscape comes from its maker’s own website, help pages and guides, checked in November 2026 and listed under Sources; prices and plans change, so follow the links before you decide. If something here is out of date or wrong, write to labcanvasapp@gmail.com and we will correct it.
Side by side, task by task
| Task | Inkscape | LabCanvas |
|---|---|---|
| Illustration | A full vector editor: Bézier and node editing, path operations, clones, gradients, filters, layers, and extensions for many more jobs | A vector editor (pen, Pathfinder, gradients, masks, blends, warps) with scientific brushes for DNA, proteins and membranes along any path |
| Science content | The Symbols dialog has general sets (logic symbols, transport and map icons); scientific artwork comes from libraries you add | 5,300+ science objects whose details are settings, 2,000+ science icons, connectable lab glassware, crystals from CIF files |
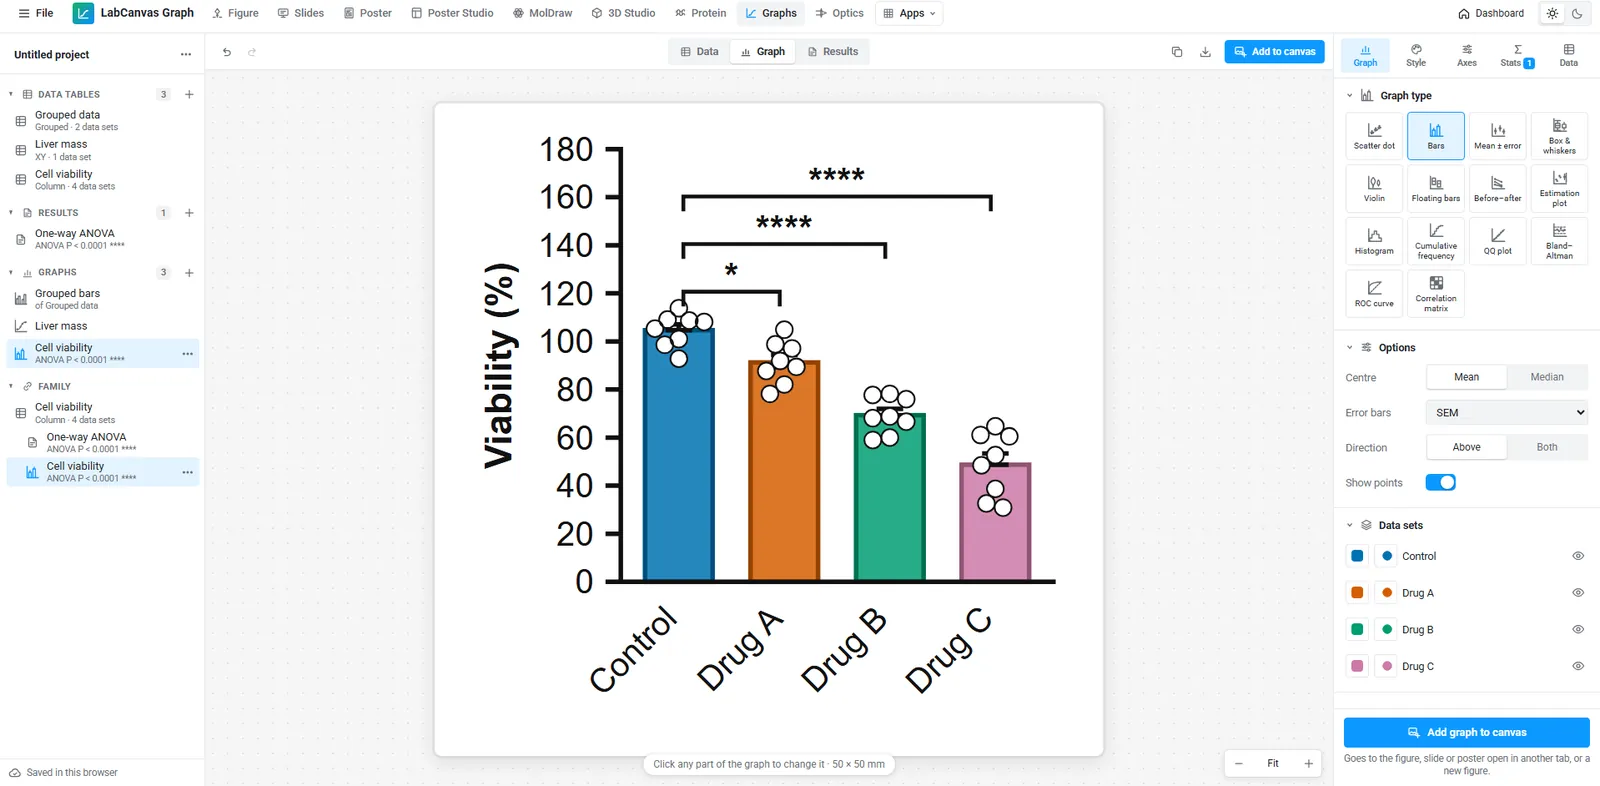
| Graphs | Import graphs made in R, Python, Prism or Excel as SVG or PDF and edit them | 132 graph types in Graphs & statistics, placed in the figure and linked to their data |
| Statistics | Not part of Inkscape | t tests, ANOVA, curve fits and survival tests, checked against SciPy, statsmodels and R in more than 42,000 automated checks |
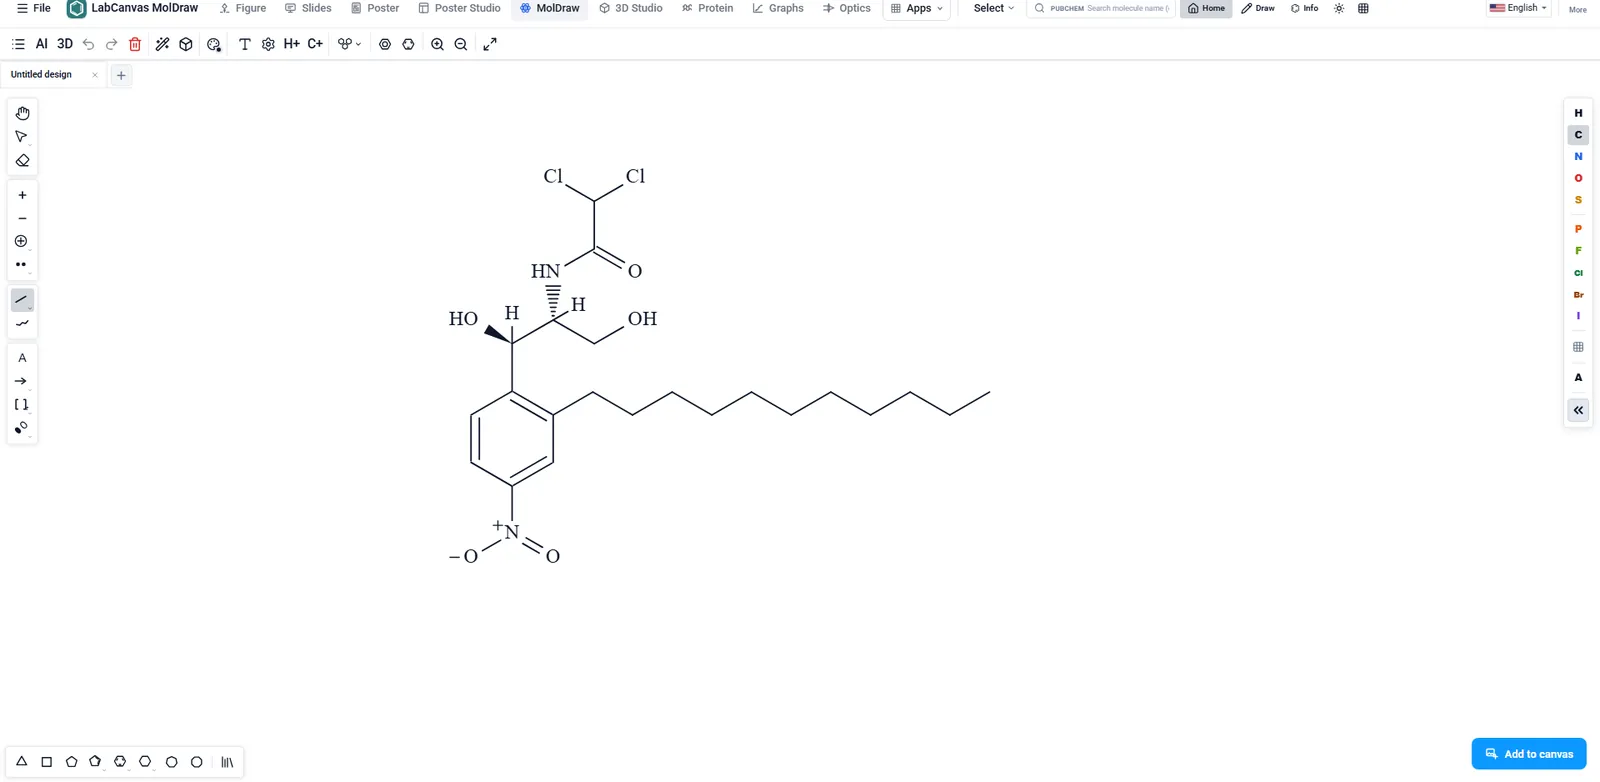
| Chemistry drawing | Not part of Inkscape: import structures from a chemistry program | MolDraw for structures and reactions; PubChem compounds in 2D or 3D |
| Image analysis | Places, crops and clips images; no image analysis | Image Analysis measures micrographs and blots; the Pixel editor adjusts images in place |
| Equations | Extensions › Render › Mathematics › LaTeX (pdflatex) with a LaTeX installation, or a third-party extension | LaTeX typeset in the browser with MathJax, including chemistry (mhchem), into vector outlines on the canvas |
| Templates | General document and page-size templates; no scientific figure templates | 250+ figure templates, many of them graphical abstracts of published syntheses citing their papers |
| Export | Saves SVG; exports PNG, JPEG, TIFF and WebP; saves PDF, EPS, PS, EMF and WMF; multi-page PDF; export from the command line | PNG, JPEG, WebP, TIFF and PDF at the width in millimetres and the resolution you set (300, 600 or 1,200 dpi, for example); PNG, JPEG and TIFF record their DPI. Exports are pictures: the PDF is an image PDF, and there is no SVG, EPS or editable vector PDF on any plan. Downloads need LabCanvas Pro |
| Import | SVG; PDF and Adobe Illustrator files (version 9 and later); PS and EPS with Ghostscript; bitmaps | SVG (ungrouped into editable parts), PNG, JPEG, WebP, GIF and TIFF pictures; chemistry files in MolDraw; Prism, Excel and CSV data in Graphs |
| Collaboration | Exchange SVG files | Share figures, slides and posters by link or invitation and edit together live, with comments (how) |
| Price | Free and open source (GNU GPL) | Free with an account (up to 3 designs, no downloads); LabCanvas Pro US$19 a month or US$199 a year |
| Platforms | Inkscape 1.4.4 (May 2026) for Windows (including Arm), macOS (Intel and Apple silicon) and Linux (AppImage, Flatpak, Snap, PPA); works offline | Any modern browser; needs an internet connection |
| Learning | A general-purpose program with many tools, menus and extensions to learn | Fewer general tools; science objects, templates and the apps do much of the drawing |
Pick Inkscape when
- You need editable vector files. A journal asks for EPS or a vector PDF, or the figure will be edited later in another program. Inkscape saves SVG, PDF and EPS; LabCanvas exports pictures only.
- It must be free, offline and open source. Inkscape costs nothing, runs without an account or a connection, and its source is open; LabCanvas needs an account, a connection and Pro for downloads.
- You are finishing graphs from R, Python or Prism. Inkscape opens their SVG and PDF output and lets you edit every label and line.
- You need total control over paths and text, extensions for special jobs, or batch export from the command line.
- You want a native desktop program on Linux, Windows or macOS, or your institution standardises on open-source software.
Pick LabCanvas when
- You want the science drawn for you. A liposome with its cargo, a nanoparticle with its ligand shell, a MOF from its crystal file, a glassware setup that stays connected: in LabCanvas they are objects with settings, not shapes you draw by hand.
- The graphs and the figure belong together. Make the graph with its statistics in Graphs & statistics, then Add to canvas: it stays linked, so a corrected value updates the figure.
- You need equations without installing LaTeX, chemical structures from MolDraw or PubChem, a protein from the PDB or a ray-traced 3D render in the same figure.
- The same figure goes on a slide and a poster. Slides and Research Poster are built on the same editor.
- You start from a template of a published synthesis or a journal’s graphical abstract size.
Example: a multi-panel figure with a schematic, a graph and an equation
In Inkscape
- Set the page to the journal’s column width (for example 174 mm) in Document Properties.
- Import the graph you made in R, Python or Prism as SVG or PDF, and ungroup it to edit labels and fonts.
- Draw the schematic with the pen and shape tools, or import icons from a library; add panel letters.
- Add the equation with Extensions › Render › Mathematics › LaTeX (pdflatex) (LaTeX must be installed).
- Save the SVG, then save a copy as PDF or EPS, or export PNG or TIFF at the journal’s resolution.
In LabCanvas
- Open the figure editor and set the figure to the column width.
- Press Shift+O for the science objects and drag in what the schematic needs; change their settings in the Design panel.
- In Graphs & statistics, make the graph with its test and click Add to canvas.
- Add the equation from the editor’s Equation tool (LaTeX, typeset in the browser) and panel letters.
- Export TIFF or PNG at 600 dpi at the column width (LabCanvas Pro).
Moving drawings from Inkscape to LabCanvas
- In Inkscape choose File › Save As and pick Plain SVG (Inkscape SVG works too).
- Drop the file onto the LabCanvas canvas. It arrives as one SVG layer.
- Right-click it and choose Ungroup into editable parts. Paths, rectangles, circles, lines, polygons, text and embedded images become LabCanvas shapes and text; gradient fills, blurs and drop shadows convert too. Patterns, masks, blend modes, markers and very large groups stay pixel-perfect as smaller SVG pieces that you can ungroup again.
- The move is one way: LabCanvas exports pictures, so a LabCanvas figure comes back into Inkscape as a PNG or TIFF image, not as editable paths.
Sources
Inkscape pages, checked November 2026:
- Download Inkscape and all platforms for Inkscape 1.4.4: the current version and its platforms
- Inkscape 1.4.4 for GNU/Linux and the FAQ: free and open-source software under the GPL
- Inkscape man page: import and export formats, command-line export
- Exporting to other file formats (Inkscape Beginners’ Guide) and Save as vs export (Inkscape wiki)
- LaTeX in Inkscape (tutorial)
- Inkscape 1.3 release notes and the Symbols dialog (wiki)
LabCanvas: the figure editor guide, the documentation and the pricing page. LabCanvas is not affiliated with the Inkscape project.
Frequently asked questions
Is Inkscape good for scientific figures?
Yes. Inkscape is a free, open-source vector editor that many scientists use to assemble and finish figures: it edits paths and text precisely, imports PDF and SVG graphs from R, Python or Prism, and exports editable SVG, PDF and EPS. It has no scientific artwork, graphs or chemistry of its own, so you bring those from other programs and libraries.
Is Inkscape free for commercial and journal use?
Inkscape is free and open-source software released under the GNU General Public License, for Windows, macOS and Linux. The licence covers the program; the figures you draw in it are yours.
Can LabCanvas export SVG or EPS like Inkscape?
No. LabCanvas exports pictures only: PNG, JPEG, WebP, TIFF and an image PDF, at the width and resolution you set (LabCanvas Pro). If a journal asks for editable vector files, or you want to keep editing the figure in another program, use Inkscape.
Can I open my Inkscape drawings in LabCanvas?
Yes, as SVG. Drop the SVG onto the LabCanvas canvas, then right-click and choose Ungroup into editable parts: paths, shapes, text, gradients and blurs become LabCanvas shapes and text; patterns, masks, markers and very large groups stay as smaller SVG pieces you can ungroup further. Saving as Plain SVG in Inkscape gives the cleanest result.
How do I add LaTeX equations in Inkscape and in LabCanvas?
Inkscape’s Extensions › Render › Mathematics › LaTeX (pdflatex) needs a LaTeX installation on your computer; third-party extensions are another option. LabCanvas typesets LaTeX in the browser with MathJax, including chemistry with the mhchem package, with nothing to install.
Does LabCanvas work offline like Inkscape?
No. LabCanvas runs in the browser and loads its pages and scripts from the network, so it needs an internet connection. Inkscape is a desktop program and works offline.
Try it in LabCanvas
Every app is free to start in your browser. Create an account and begin.
Open the LabCanvas dashboardKeep reading
ChemDraw vs LabCanvas MolDraw: chemical structure drawing compared
ChemDraw or LabCanvas MolDraw? Drawing, names, NMR, file formats, price and platforms side by side, a reaction-scheme example, and when ChemDraw is better.
Canva vs LabCanvas for scientific figures: an honest comparison
Canva or LabCanvas for science figures? Graphs, science content, export, price and platforms compared, a graphical abstract in each, and when Canva wins.
GraphPad Prism vs LabCanvas: a free Prism alternative for graphs and statistics, compared
GraphPad Prism or LabCanvas Graphs? Statistics, export, Prism file import, price and platforms side by side, a dose–response example, and when Prism wins.