Canva vs LabCanvas for scientific figures: an honest comparison
Canva or LabCanvas for science figures? Graphs, science content, export, price and platforms compared, a graphical abstract in each, and when Canva wins.
Contents
The verdict: Canva is a general design tool, and an excellent one for what most people design: social media posts, event and outreach posters, presentations and marketing material, from a very large template and stock library, on the web, desktop and phones, with downloads on its free plan. LabCanvas is built for scientific figures: adjustable science objects instead of stock pictures, Prism-style graphs with statistics, chemical structures, 3D crystals and image analysis on one canvas, and export at a journal’s width and resolution. Choose Canva for a poster for a public event, a lab social media post or a quick slide; choose LabCanvas for a journal figure, a graphical abstract or a research poster full of data.
We make LabCanvas, so weigh what follows with that in mind. Everything said about Canva comes from its maker’s own website, help pages and guides, checked in November 2026 and listed under Sources; prices and plans change, so follow the links before you decide. If something here is out of date or wrong, write to labcanvasapp@gmail.com and we will correct it.
Side by side, task by task
| Task | Canva | LabCanvas |
|---|---|---|
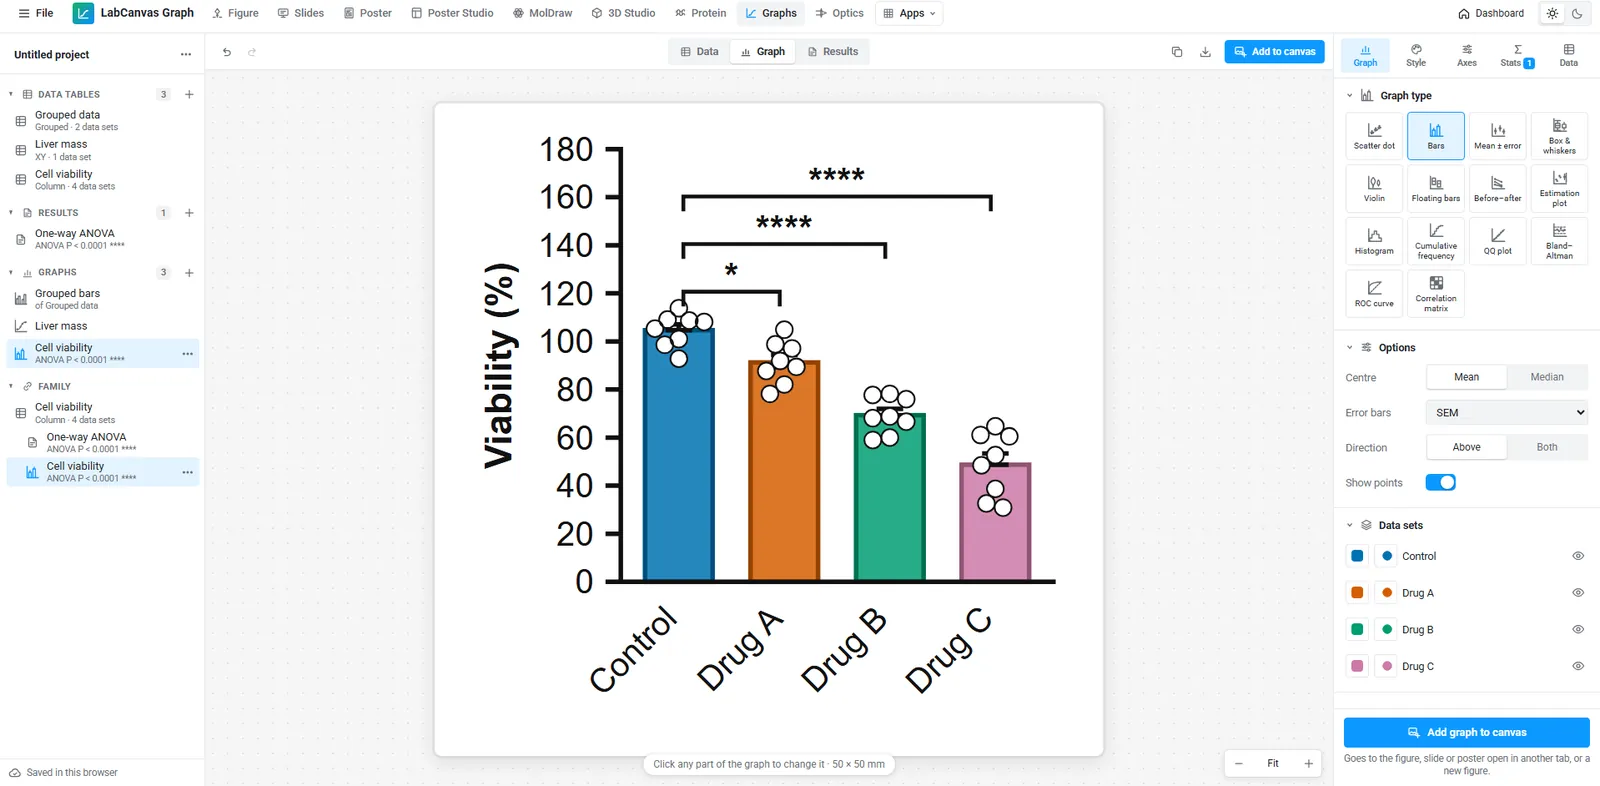
| Graphs | Bar, line, area, pie and donut, hierarchy, funnel, histogram and radar charts; data typed in or imported from CSV, Excel, Google Sheets and other sources (up to 1,000 rows and 100 columns) | 132 scientific graph types with error bars, log axes and significance brackets, linked to their data (Graphs guide) |
| Statistics | No statistical tests or curve fitting described in Canva’s chart help | t tests, ANOVA with post-hoc tests, curve fits, survival and contingency tests, checked against SciPy, statsmodels and R |
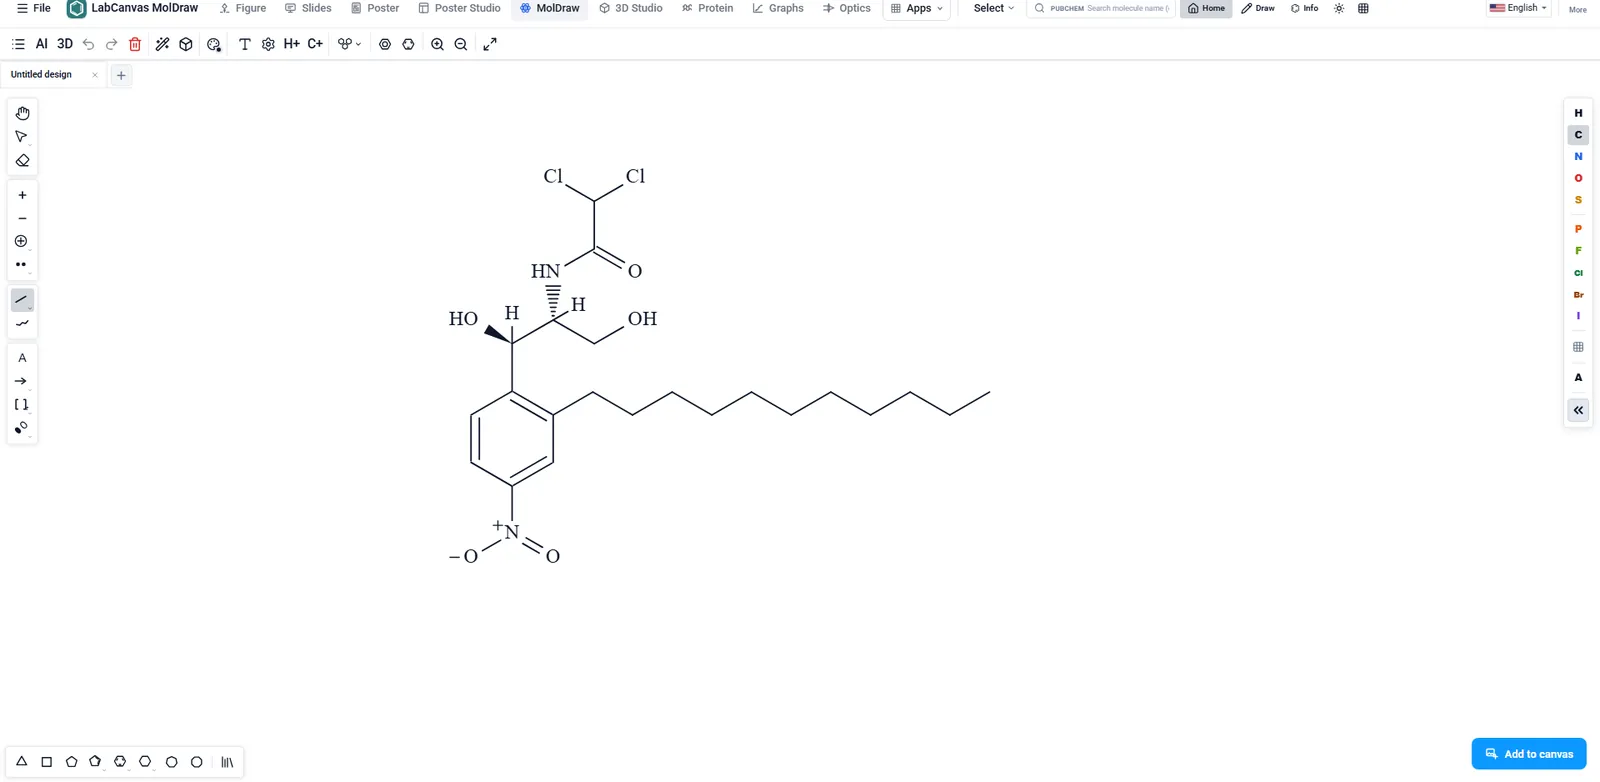
| Chemistry drawing | No structure editor of its own | MolDraw for structures and reaction schemes |
| Image analysis | Photo editing (background removal on paid plans), no measurement | Image Analysis: counts, sizes, blots, scale bars |
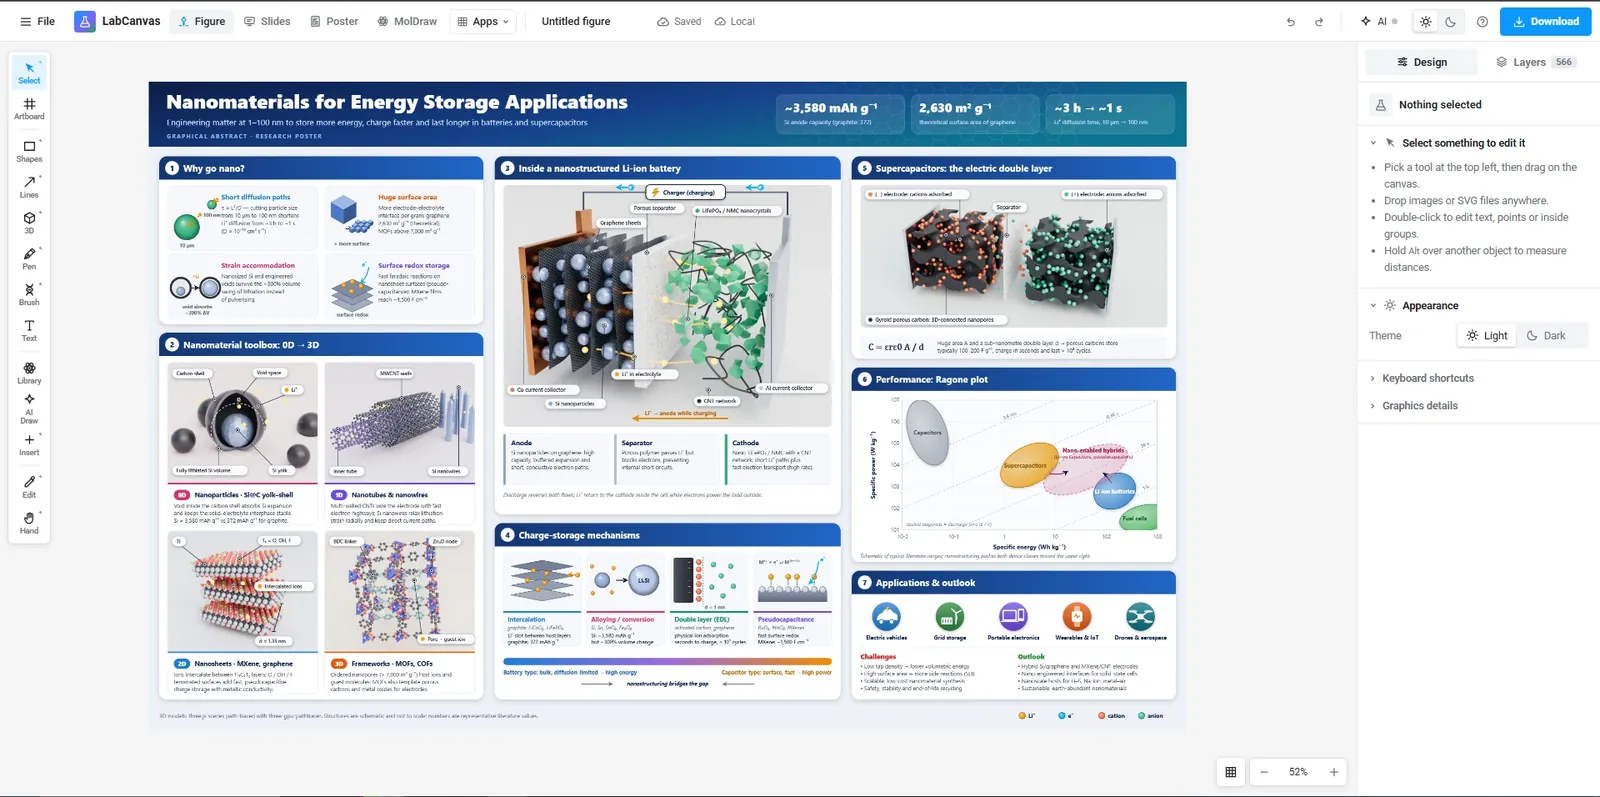
| Illustration | Arrange photos, graphics, shapes and text from a very large stock library | A full vector editor (pen, Pathfinder, gradients, masks, DNA and membrane brushes) and 5,300+ science objects whose details are settings: a liposome’s cargo, a nanoparticle’s shape, a crystal’s supercell |
| Templates | A very large library for presentations, posters, social media and documents; premium templates with a paid plan | 250+ figure templates (many are graphical abstracts of published syntheses, each citing its papers), poster templates from A0 to 48 × 36 in, slide decks; 2,000+ science icons |
| Export | Free plan: PNG, JPG, PDF Standard, PDF Print, MP4 and GIF; paid plans add SVG, transparent PNG and CMYK PDF | PNG, JPEG, WebP, TIFF and PDF at the width in millimetres and the resolution you set (300, 600 or 1,200 dpi, for example); PNG, JPEG and TIFF record their DPI. Exports are pictures: the PDF is an image PDF, and there is no SVG, EPS or editable vector PDF on any plan. Downloads need LabCanvas Pro |
| Collaboration | Share by e-mail or link to view, comment or edit; edit together in real time with comments | Share figures, slides and posters by link or invitation to view, comment or edit; edit together live, with comments pinned to the design (how) |
| Price | Free plan; Canva Pro US$144 a year for one person; Canva Business US$250 a year per person; Enterprise on request (US prices on canva.com; they vary by country); Canva Education free for K–12 teachers and their students | Free with an account (every app, up to 3 designs, no downloads); LabCanvas Pro US$19 a month or US$199 a year |
| Platforms | Web; desktop apps for Windows 10 and later and macOS 12 or later; iPhone, iPad and Android apps | Any modern browser; needs an internet connection |
| Learning | Start from a template and swap in your own text, pictures and charts | More tools to learn (it is a vector editor), but science objects and templates do much of the drawing |
Pick Canva when
- The design is for the public, not a journal: an outreach poster, a lab social media post, an event flyer or a newsletter. Canva’s template and stock library is built for exactly this.
- You want to download for free. Canva’s free plan downloads PNG, JPG and PDF; LabCanvas’s free plan has no downloads.
- You design on a phone or tablet app, or your whole department already shares its designs and templates in a Canva team.
- You need video or animation: Canva downloads MP4 and GIF; LabCanvas does not export video.
- You need an SVG. Canva’s paid plans download SVG; LabCanvas exports pictures only.
Pick LabCanvas when
- The figure carries data. Graphs come from Graphs & statistics with the test results drawn on them, and stay linked to the data when you correct a value.
- The figure needs real science content: a lipid nanoparticle with its mRNA cargo, a MOF from its crystal file, a distillation setup that snaps together, a chemical structure, a protein from the PDB. In LabCanvas these are objects with settings, not stock pictures.
- A journal sets the size. Set the width in millimetres and the resolution (300, 600 or 1,200 dpi) and export TIFF or PNG with the DPI in the file; open a canvas at your journal’s graphical abstract size.
- It is a research poster full of data. Research Poster re-flows blocks as you move them and takes the same figures and graphs.
- You want the rights to be simple. Under the LabCanvas terms you keep all rights to what you make and may use your exports in publications and commercial work.
Example: a graphical abstract for a journal
In Canva
- Start a design at a custom size, choose millimetres or inches, and type the journal’s size.
- Search Canva’s elements for the scientific pictures you need, add shapes, arrows and text, or upload your own images and charts.
- Download as PNG or PDF Print, and check the file’s pixel size against the journal’s requirements before you upload it.
In LabCanvas
- Open the figure editor at the journal’s graphical abstract size, chosen from the publisher list, or start from a template of a published synthesis.
- Press Shift+O to open the objects and drag in a nanoparticle, liposome, crystal or cell, then change its settings in the Design panel; add a structure from MolDraw or a graph from Graphs with Add to canvas.
- Export TIFF or PNG at the journal’s resolution (LabCanvas Pro); the file records its DPI.
Moving work from Canva to LabCanvas
- Pictures: download your Canva design or its parts as PNG or JPG and drop them onto the LabCanvas canvas; they come in as images you can crop and place.
- Vector parts: with a paid Canva plan, download SVG and drop it onto the canvas, then right-click and choose Ungroup into editable parts: paths, shapes, text and gradients become LabCanvas shapes you can recolour and edit; complex parts such as patterns and masks stay as smaller SVG pieces.
- Licences: Canva’s stock elements are licensed to you under its Content License Agreement, not owned by you. Read it before reusing Canva elements outside Canva or in a figure whose copyright you must assign.
- There is no way back as SVG: LabCanvas exports pictures (PNG, JPEG, WebP, TIFF, image PDF), so a LabCanvas figure goes into Canva as an image.
Sources
Canva pages, checked November 2026:
- Canva pricing: Free, Pro, Business and Enterprise plans and US prices
- Canva Education: who it is free for
- Choose the right download file type and Download with a transparent background: formats and which need a paid plan
- Import data into Canva Charts, bar charts, pie and donut charts, histograms, radar charts
- Share your Canva design and collaborate with anyone
- Canva desktop app, technical requirements, iOS app and Android app
- Design from scratch: custom sizes in px, in, mm or cm
- Premium elements and the Content License Agreement
LabCanvas: the figure editor guide, the documentation and the pricing page. Canva is a trademark of Canva Pty Ltd; LabCanvas is not affiliated with Canva.
Frequently asked questions
Is Canva good for scientific figures?
Canva is quick for layouts built from photos, text and ready-made elements: conference posters, outreach graphics, social media posts and slides. For figures with data, chemistry or detailed schematics it has less to offer: its charts draw data but run no statistics, and it has no structure editor or scientific objects with settings. LabCanvas is built for those figures.
Can I make graphs with statistics in Canva?
Canva makes bar, line, area, pie and donut, histogram, radar and other charts from data you type or import (CSV, Excel or Google Sheets, up to 1,000 rows and 100 columns). Its help pages describe no statistical tests or curve fitting. LabCanvas Graphs runs t tests, ANOVA, curve fits and survival analysis and draws significance brackets from the results.
Can I download a Canva design as SVG?
Canva lists SVG download and transparent PNG as paid-plan features; PNG, JPG, PDF (Standard and Print), MP4 and GIF are on the free plan. LabCanvas exports no SVG on any plan: its downloads (LabCanvas Pro) are PNG, JPEG, WebP, TIFF and image PDF.
Can I bring a Canva design into LabCanvas?
An SVG downloaded from Canva (a paid-plan feature) can be dropped onto the LabCanvas canvas and ungrouped into editable shapes and text; a PNG or JPG comes in as a picture. Canva elements are licensed to you under Canva’s Content License Agreement, not owned by you, so read it before reusing them outside Canva.
Is Canva free for students and teachers?
Canva says Canva Education is free for K–12 teachers, their students and qualified school districts; university students are not covered by it. LabCanvas has one free plan for everyone (every app, up to 3 designs, no downloads); LabCanvas Pro adds downloads.
Which is cheaper, Canva Pro or LabCanvas Pro?
Canva’s pricing page lists Canva Pro at US$144 a year for one person (prices vary by country). LabCanvas Pro is US$19 a month or US$199 a year (US prices; India pays in rupees). Both have free plans; only Canva’s free plan includes downloads.
Try it in LabCanvas
Every app is free to start in your browser. Create an account and begin.
Open the LabCanvas dashboardKeep reading
ChemDraw vs LabCanvas MolDraw: chemical structure drawing compared
ChemDraw or LabCanvas MolDraw? Drawing, names, NMR, file formats, price and platforms side by side, a reaction-scheme example, and when ChemDraw is better.
Inkscape vs LabCanvas for scientific figures: an honest comparison
Inkscape or LabCanvas for scientific figures? Vector tools, science content, LaTeX, export, price and platforms side by side, and when Inkscape is better.
GraphPad Prism vs LabCanvas: a free Prism alternative for graphs and statistics, compared
GraphPad Prism or LabCanvas Graphs? Statistics, export, Prism file import, price and platforms side by side, a dose–response example, and when Prism wins.