TikZ flowchart: shapes, decisions, loops and a template
Quick answer
\usetikzlibrary{shapes.geometric, arrows.meta, positioning}, define a style per symbol (rounded box for start and end, rectangle for steps, diamond for decisions, trapezium for input and output), place each box with below=of or right=of the previous one, and connect them with \draw[->] (a) -- (b);. Label the branches with nodes on the arrows (-- node[left] {yes}) and route arrows back with |- or -| for right angles. The complete template below is ready to copy.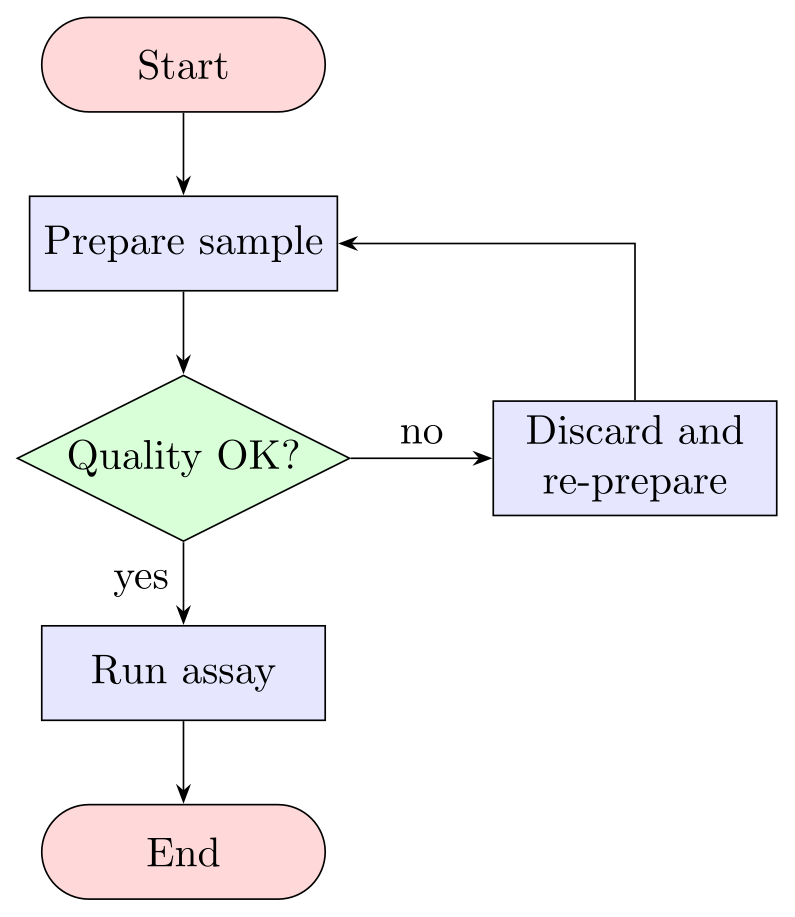
\usepackage{tikz} \usetikzlibrary{shapes.geometric, arrows.meta, positioning}\begin{tikzpicture}[node distance=7mm and 12mm, >=Stealth,
base/.style={draw, minimum height=8mm, minimum width=24mm, align=center},
terminal/.style={base, rounded corners=4mm, fill=red!15},
process/.style={base, fill=blue!10},
decision/.style={base, diamond, aspect=2, minimum width=0pt, inner sep=1pt, fill=green!15}]
\node[terminal] (start) {Start};
\node[process, below=of start] (sample) {Prepare sample};
\node[decision, below=of sample] (ok) {Quality OK?};
\node[process, below=of ok] (run) {Run assay};
\node[process, right=of ok] (redo) {Discard and\\re-prepare};
\node[terminal, below=of run] (stop) {End};
\draw[->] (start) -- (sample);
\draw[->] (sample) -- (ok);
\draw[->] (ok) -- node[left] {yes} (run);
\draw[->] (ok) -- node[above] {no} (redo);
\draw[->] (redo) |- (sample);
\draw[->] (run) -- (stop);
\end{tikzpicture}Full document
\documentclass[border=4pt]{standalone}
\usepackage{tikz}
\usetikzlibrary{shapes.geometric, arrows.meta, positioning}
\begin{document}
\begin{tikzpicture}[node distance=7mm and 12mm, >=Stealth,
    base/.style={draw, minimum height=8mm, minimum width=24mm, align=center},
    terminal/.style={base, rounded corners=4mm, fill=red!15},
    process/.style={base, fill=blue!10},
    decision/.style={base, diamond, aspect=2, minimum width=0pt, inner sep=1pt, fill=green!15}]
  \node[terminal]                   (start)  {Start};
  \node[process, below=of start]    (sample) {Prepare sample};
  \node[decision, below=of sample]  (ok)     {Quality OK?};
  \node[process, below=of ok]       (run)    {Run assay};
  \node[process, right=of ok]       (redo)   {Discard and\\re-prepare};
  \node[terminal, below=of run]     (stop)   {End};
  \draw[->] (start)  -- (sample);
  \draw[->] (sample) -- (ok);
  \draw[->] (ok)     -- node[left]  {yes} (run);
  \draw[->] (ok)     -- node[above] {no}  (redo);
  \draw[->] (redo)   |- (sample);
  \draw[->] (run)    -- (stop);
\end{tikzpicture}
\end{document}Contents
Flowchart symbols as TikZ shapes
Each flowchart symbol is a node shape, most of them from the shape libraries. Give the node draw and a minimum width and minimum height so that boxes of one kind have one size whatever their text.
| Symbol | TikZ | Library |
|---|---|---|
| Start / end (terminator) | rounded rectangle, or rounded corners of half the height | shapes.misc (none for rounded corners) |
| Process (step) | rectangle (the default) | none |
| Decision | diamond, with aspect=2 for a wide one | shapes.geometric |
| Input / output | trapezium, trapezium left angle=70, trapezium right angle=110, trapezium stretches | shapes.geometric |
| Document | tape, tape bend top=none | shapes.symbols |
| Database | cylinder, shape border rotate=90, aspect=0.25 | shapes.geometric |
| Connector | circle | none |
| Predefined process (subroutine) | a rectangle with two lines added by append after command | none |
| Preparation | signal, signal to=west and east | shapes.symbols |
A few details matter. The trapezium’s two lower angles are both 60° by default, which draws a real trapezium; 70° and 110° make the parallelogram of an input/output box. A trapezium also keeps its proportions when a minimum size enlarges it, so a minimum height makes it very wide unless you add trapezium stretches. A diamond around text is as tall as it is wide (aspect=1), so set aspect=2 and a small inner sep, and keep decision texts short. The subroutine box draws its inner lines with edges from the node’s corners shifted by 2.5 mm, using \tikzlastnode, the name of the node just made.
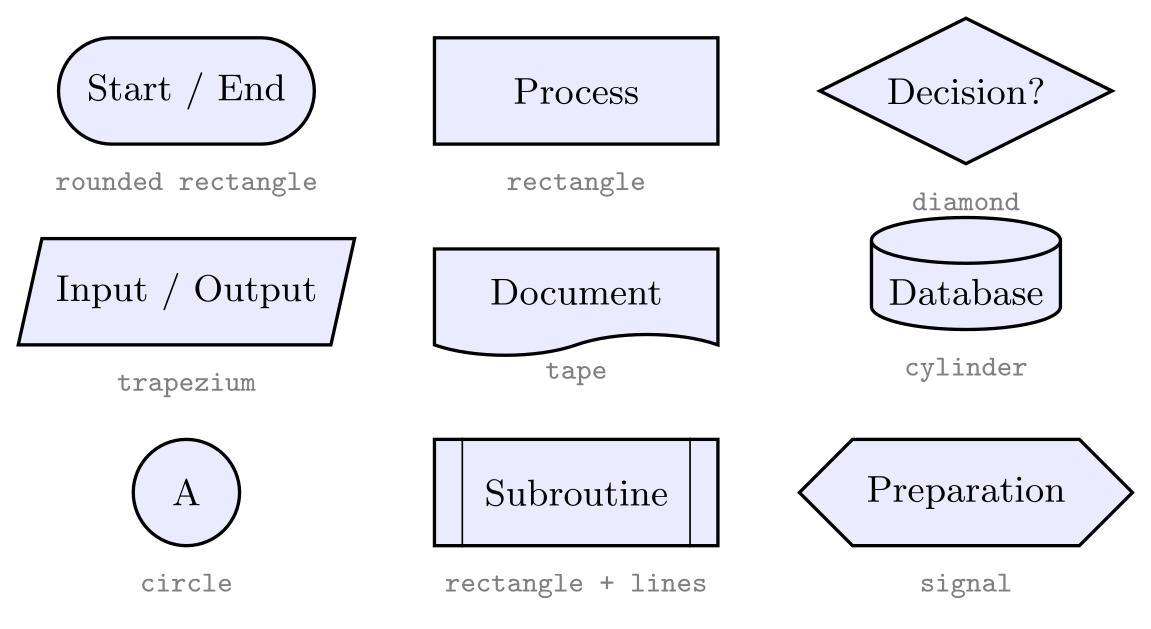
\usepackage{tikz} \usetikzlibrary{shapes.geometric, shapes.misc, shapes.symbols}\begin{tikzpicture}[x=33mm, y=-17mm, font=\small,
base/.style={draw, thick, fill=blue!8, minimum width=24mm, minimum height=9mm, align=center},
tag/.style={font=\scriptsize\ttfamily, text=gray, below=1mm}]
\node[base, rounded rectangle] (a) at (0,0) {Start / End};
\node[base] (b) at (1,0) {Process};
\node[base, diamond, aspect=2, minimum width=0pt] (c) at (2,0) {Decision?};
\node[base, trapezium, trapezium left angle=70, trapezium right angle=110, trapezium stretches,
minimum width=20mm] (d) at (0,1) {Input / Output};
\node[base, tape, tape bend top=none] (e) at (1,1) {Document};
\node[base, cylinder, shape border rotate=90, aspect=0.25,
minimum width=16mm] (f) at (2,1) {Database};
\node[base, circle, minimum width=0pt] (g) at (0,2) {A};
\node[base, append after command={
([xshift=2.5mm]\tikzlastnode.north west) edge ([xshift=2.5mm]\tikzlastnode.south west)
([xshift=-2.5mm]\tikzlastnode.north east) edge ([xshift=-2.5mm]\tikzlastnode.south east)}]
(h) at (1,2) {Subroutine};
\node[base, signal, signal to=west and east] (i) at (2,2) {Preparation};
\foreach \n/\t in {a/rounded rectangle, b/rectangle, c/diamond, d/trapezium, e/tape,
f/cylinder, g/circle, h/rectangle + lines, i/signal}
\node[tag] at (\n.south) {\t};
\end{tikzpicture}Full document
\documentclass[border=4pt]{standalone}
\usepackage{tikz}
\usetikzlibrary{shapes.geometric, shapes.misc, shapes.symbols}
\begin{document}
\begin{tikzpicture}[x=33mm, y=-17mm, font=\small,
    base/.style={draw, thick, fill=blue!8, minimum width=24mm, minimum height=9mm, align=center},
    tag/.style={font=\scriptsize\ttfamily, text=gray, below=1mm}]
  \node[base, rounded rectangle]                     (a) at (0,0) {Start / End};
  \node[base]                                        (b) at (1,0) {Process};
  \node[base, diamond, aspect=2, minimum width=0pt]  (c) at (2,0) {Decision?};
  \node[base, trapezium, trapezium left angle=70, trapezium right angle=110, trapezium stretches,
        minimum width=20mm]                          (d) at (0,1) {Input / Output};
  \node[base, tape, tape bend top=none]              (e) at (1,1) {Document};
  \node[base, cylinder, shape border rotate=90, aspect=0.25,
        minimum width=16mm]                          (f) at (2,1) {Database};
  \node[base, circle, minimum width=0pt]             (g) at (0,2) {A};
  \node[base, append after command={
        ([xshift=2.5mm]\tikzlastnode.north west) edge ([xshift=2.5mm]\tikzlastnode.south west)
        ([xshift=-2.5mm]\tikzlastnode.north east) edge ([xshift=-2.5mm]\tikzlastnode.south east)}]
                                                     (h) at (1,2) {Subroutine};
  \node[base, signal, signal to=west and east]       (i) at (2,2) {Preparation};
  \foreach \n/\t in {a/rounded rectangle, b/rectangle, c/diamond, d/trapezium, e/tape,
                     f/cylinder, g/circle, h/rectangle + lines, i/signal}
    \node[tag] at (\n.south) {\t};
\end{tikzpicture}
\end{document}Placing the boxes
With \usetikzlibrary{positioning}, every box is placed relative to the one before: \node[process, below=of sample] (run) {Run assay};. node distance=7mm and 12mm in the picture options sets the gap between borders, 7 mm vertically and 12 mm horizontally, so all arrows have the same length whatever the box sizes. A branch goes right=of the decision, and the column continues below=of it. Name every node ((run)): the arrows refer to the names and stop at the borders.
Without the library, below=of fails with “Unknown function `of'”. Absolute coordinates (at (0,-2)) work too and are simplest for swimlanes, and a matrix aligns large charts on a grid; both are shown further down.
Decisions: yes/no labels and right-angled arrows
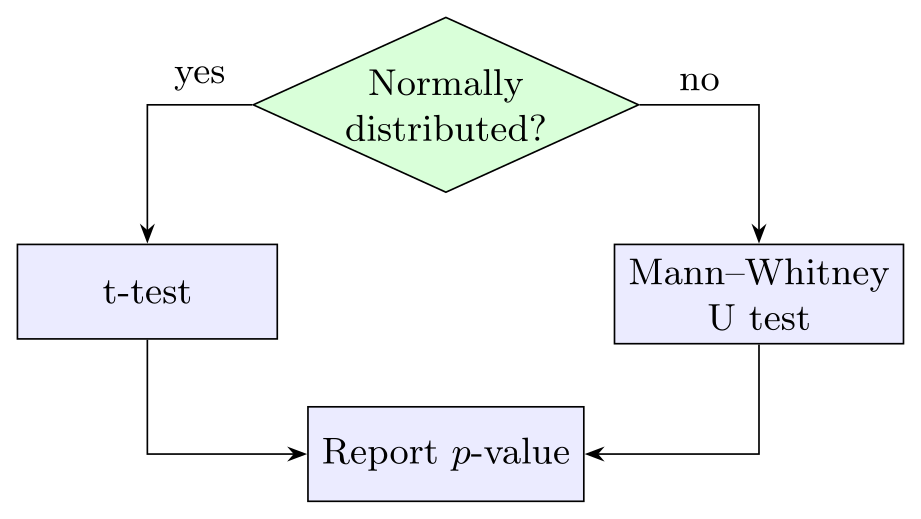
Arrows out of a decision usually turn a corner. (d.west) -| (t) goes horizontally from the left corner of the diamond and then vertically into the box; (t) |- (r) goes down first and then across into the side of the target. Starting from an anchor such as d.west makes the arrow leave from the tip of the diamond.
The labels are nodes on the arrows. On a straight arrow, node[left] {yes} sits at the middle (midway). On a -| or |- arrow, position 0.5 is exactly the corner, so pos=0.25 puts the label at the middle of the first leg, which is where it reads best; pos=0.75 would label the second leg. above, below, left and right move the label off the line.
\usepackage{tikz} \usetikzlibrary{shapes.geometric, arrows.meta, positioning}\begin{tikzpicture}[node distance=8mm and 6mm, >=Stealth, font=\small,
box/.style={draw, fill=blue!8, minimum width=22mm, minimum height=8mm, align=center},
decision/.style={draw, diamond, aspect=2.2, inner sep=1pt, fill=green!15, align=center}]
\node[decision] (d) {Normally\\distributed?};
\node[box, below left=of d] (t) {t-test};
\node[box, below right=of d] (u) {Mann–Whitney\\U test};
\node[box, below=18mm of d] (r) {Report $p$-value};
% -| goes across, then down; the label at pos=0.25 sits on the first part
\draw[->] (d.west) -| node[pos=0.25, above] {yes} (t);
\draw[->] (d.east) -| node[pos=0.25, above] {no} (u);
% |- goes down, then across into the side of the target
\draw[->] (t) |- (r);
\draw[->] (u) |- (r);
\end{tikzpicture}Full document
\documentclass[border=4pt]{standalone}
\usepackage{tikz}
\usetikzlibrary{shapes.geometric, arrows.meta, positioning}
\begin{document}
\begin{tikzpicture}[node distance=8mm and 6mm, >=Stealth, font=\small,
    box/.style={draw, fill=blue!8, minimum width=22mm, minimum height=8mm, align=center},
    decision/.style={draw, diamond, aspect=2.2, inner sep=1pt, fill=green!15, align=center}]
  \node[decision]                        (d) {Normally\\distributed?};
  \node[box, below left=of d]            (t) {t-test};
  \node[box, below right=of d]           (u) {Mann–Whitney\\U test};
  \node[box, below=18mm of d]            (r) {Report $p$-value};
  % -| goes across, then down; the label at pos=0.25 sits on the first part
  \draw[->] (d.west) -| node[pos=0.25, above] {yes} (t);
  \draw[->] (d.east) -| node[pos=0.25, above] {no}  (u);
  % |- goes down, then across into the side of the target
  \draw[->] (t) |- (r);
  \draw[->] (u) |- (r);
\end{tikzpicture}
\end{document}Loops: arrows back to an earlier step
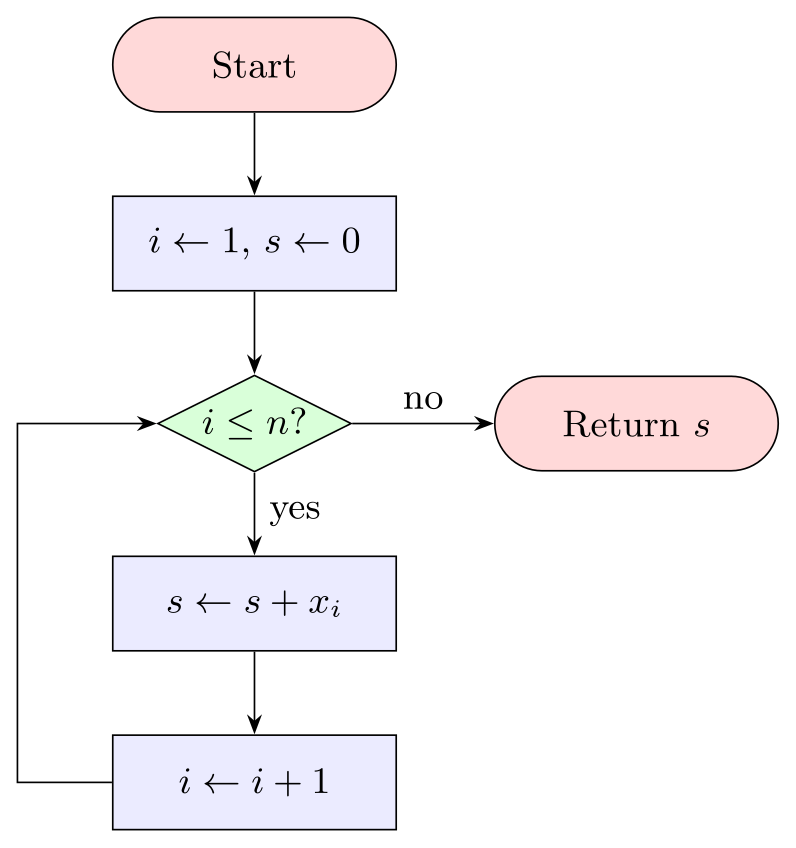
A loop is an arrow that runs back up beside the chart. Build its route from pieces: (inc.west) -- ++(-8mm,0) |- (cond.west) leaves the increment box to the left, goes 8 mm out, then |- goes up to the height of the decision and across into its left tip. ++(-8mm,0) is relative to the previous point, so the loop keeps its distance from the chart when the boxes change size. To loop back from a side branch instead, a single |- is enough, as in the template below: (fix) |- (proc).
The same pattern draws while and for loops in algorithm flowcharts: initialise, test, body, increment, back to the test, with the exit leaving the decision on the other side.
\usepackage{tikz} \usetikzlibrary{shapes.geometric, arrows.meta, positioning}\begin{tikzpicture}[node distance=7mm and 12mm, >=Stealth, font=\small,
base/.style={draw, minimum width=24mm, minimum height=8mm, align=center},
terminal/.style={base, rounded corners=4mm, fill=red!15},
process/.style={base, fill=blue!8},
decision/.style={base, diamond, aspect=2, minimum width=0pt, inner sep=1pt, fill=green!15}]
\node[terminal] (start) {Start};
\node[process, below=of start] (init) {$i \gets 1$, $s \gets 0$};
\node[decision, below=of init] (cond) {$i \le n$?};
\node[process, below=of cond] (body) {$s \gets s + x_i$};
\node[process, below=of body] (inc) {$i \gets i + 1$};
\node[terminal, right=of cond] (stop) {Return $s$};
\draw[->] (start) -- (init);
\draw[->] (init) -- (cond);
\draw[->] (cond) -- node[right] {yes} (body);
\draw[->] (body) -- (inc);
\draw[->] (cond) -- node[above] {no} (stop);
% the loop back: left from inc, up, then right into the decision
\draw[->] (inc.west) -- ++(-8mm,0) |- (cond.west);
\end{tikzpicture}Full document
\documentclass[border=4pt]{standalone}
\usepackage{tikz}
\usetikzlibrary{shapes.geometric, arrows.meta, positioning}
\begin{document}
\begin{tikzpicture}[node distance=7mm and 12mm, >=Stealth, font=\small,
    base/.style={draw, minimum width=24mm, minimum height=8mm, align=center},
    terminal/.style={base, rounded corners=4mm, fill=red!15},
    process/.style={base, fill=blue!8},
    decision/.style={base, diamond, aspect=2, minimum width=0pt, inner sep=1pt, fill=green!15}]
  \node[terminal]                  (start) {Start};
  \node[process, below=of start]   (init)  {$i \gets 1$, $s \gets 0$};
  \node[decision, below=of init]   (cond)  {$i \le n$?};
  \node[process, below=of cond]    (body)  {$s \gets s + x_i$};
  \node[process, below=of body]    (inc)   {$i \gets i + 1$};
  \node[terminal, right=of cond]   (stop)  {Return $s$};
  \draw[->] (start) -- (init);
  \draw[->] (init) -- (cond);
  \draw[->] (cond) -- node[right] {yes} (body);
  \draw[->] (body) -- (inc);
  \draw[->] (cond) -- node[above] {no} (stop);
  % the loop back: left from inc, up, then right into the decision
  \draw[->] (inc.west) -- ++(-8mm,0) |- (cond.west);
\end{tikzpicture}
\end{document}A reusable flowchart template
This template defines every style once in a \tikzset block: a common flow style (border, size, centred text) that the symbol styles build on, an arrow style and an answer style for the yes/no labels. Copy it, change the texts, and add nodes with below=of or right=of. To use the same styles in every flowchart of a document, move the \tikzset{…} block to the preamble, after the \usetikzlibrary line.
Two habits keep templates robust. Change sizes in flow only, so all boxes stay consistent. And never name a style after an existing TikZ key: a style called label or name replaces that key for the whole picture (a name/.style={…} broke the shape legend above with the “I do not know the key '/font'” error listed below), which is why the labels here use answer.
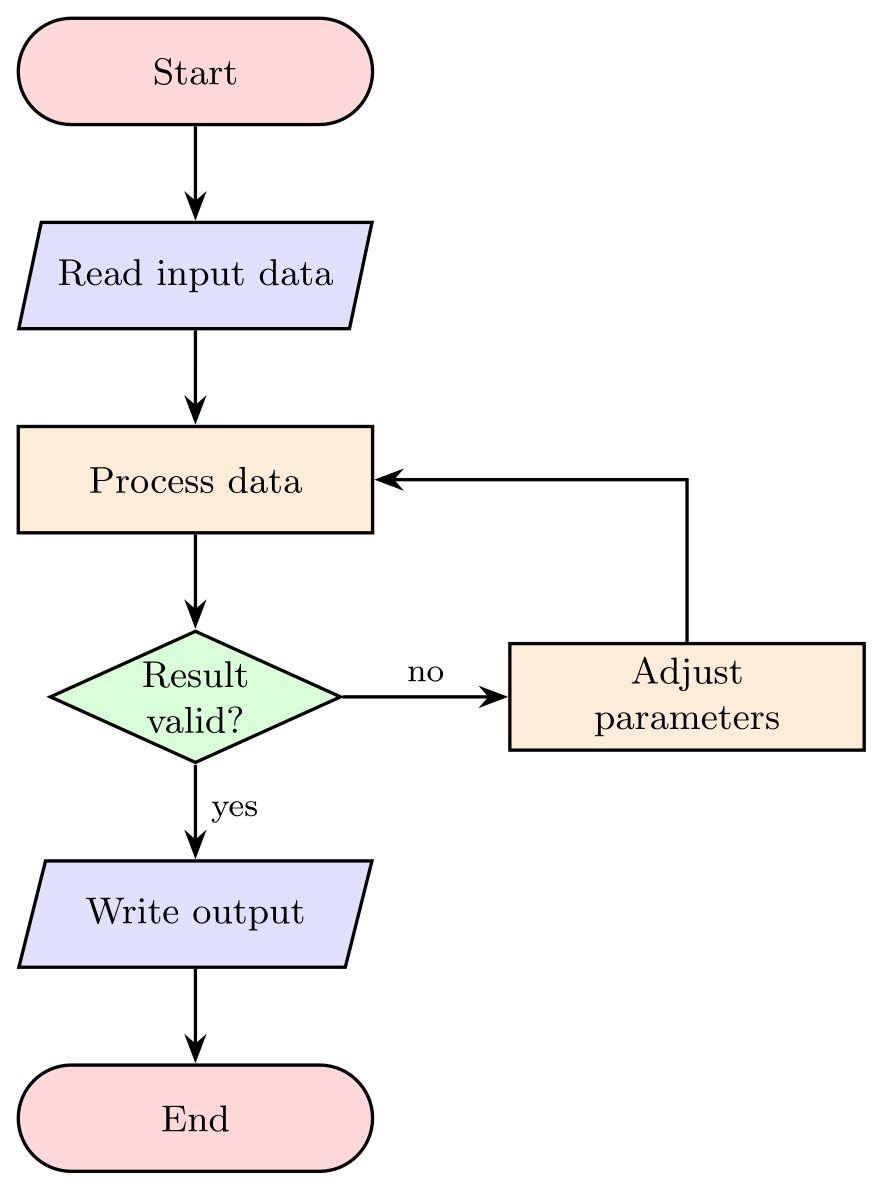
\usepackage{tikz} \usetikzlibrary{shapes.geometric, arrows.meta, positioning}\begin{tikzpicture}[node distance=8mm and 14mm]
% ---- the style block: move it to the preamble to share it ----
\tikzset{
flow/.style = {draw, thick, minimum width=30mm, minimum height=9mm,
align=center, font=\small},
startstop/.style = {flow, rounded corners=4.5mm, fill=red!15},
process/.style = {flow, fill=orange!15},
io/.style = {flow, trapezium, trapezium left angle=70,
trapezium right angle=110, trapezium stretches, fill=blue!12},
decision/.style = {flow, diamond, aspect=2.2, minimum width=0pt,
inner sep=1pt, fill=green!15},
arrow/.style = {thick, -{Stealth[length=2.5mm]}},
answer/.style = {font=\footnotesize}
}
% ---- the nodes: one column, one side branch ----
\node[startstop] (start) {Start};
\node[io, below=of start] (in) {Read input data};
\node[process, below=of in] (proc) {Process data};
\node[decision, below=of proc] (check) {Result\\valid?};
\node[process, right=of check] (fix) {Adjust\\parameters};
\node[io, below=of check] (out) {Write output};
\node[startstop, below=of out] (stop) {End};
% ---- the arrows ----
\draw[arrow] (start) -- (in);
\draw[arrow] (in) -- (proc);
\draw[arrow] (proc) -- (check);
\draw[arrow] (check) -- node[answer, right] {yes} (out);
\draw[arrow] (check) -- node[answer, above] {no} (fix);
\draw[arrow] (fix) |- (proc);
\draw[arrow] (out) -- (stop);
\end{tikzpicture}Full document
\documentclass[border=4pt]{standalone}
\usepackage{tikz}
\usetikzlibrary{shapes.geometric, arrows.meta, positioning}
\begin{document}
\begin{tikzpicture}[node distance=8mm and 14mm]
  % ---- the style block: move it to the preamble to share it ----
  \tikzset{
    flow/.style   = {draw, thick, minimum width=30mm, minimum height=9mm,
                     align=center, font=\small},
    startstop/.style = {flow, rounded corners=4.5mm, fill=red!15},
    process/.style   = {flow, fill=orange!15},
    io/.style        = {flow, trapezium, trapezium left angle=70,
                        trapezium right angle=110, trapezium stretches, fill=blue!12},
    decision/.style  = {flow, diamond, aspect=2.2, minimum width=0pt,
                        inner sep=1pt, fill=green!15},
    arrow/.style     = {thick, -{Stealth[length=2.5mm]}},
    answer/.style    = {font=\footnotesize}
  }
  % ---- the nodes: one column, one side branch ----
  \node[startstop]                (start)  {Start};
  \node[io,       below=of start] (in)     {Read input data};
  \node[process,  below=of in]    (proc)   {Process data};
  \node[decision, below=of proc]  (check)  {Result\\valid?};
  \node[process,  right=of check] (fix)    {Adjust\\parameters};
  \node[io,       below=of check] (out)    {Write output};
  \node[startstop, below=of out]  (stop)   {End};
  % ---- the arrows ----
  \draw[arrow] (start) -- (in);
  \draw[arrow] (in)    -- (proc);
  \draw[arrow] (proc)  -- (check);
  \draw[arrow] (check) -- node[answer, right] {yes} (out);
  \draw[arrow] (check) -- node[answer, above] {no}  (fix);
  \draw[arrow] (fix)   |- (proc);
  \draw[arrow] (out)   -- (stop);
\end{tikzpicture}
\end{document}Left-to-right flowcharts with chains
For a process that runs in one line, the chains library places and connects the boxes for you. start chain=going right on the picture starts a chain; on chain puts a node to the right of the previous one, node distance apart; and join adds an edge from the previous node, styled by every join. Putting on chain, join into every node leaves only the node texts in the body. going below makes a vertical chain, and on chain=going below on a single node turns the chain downward from there.

\usepackage{tikz} \usetikzlibrary{chains, arrows.meta, shapes.geometric}\begin{tikzpicture}[start chain=going right, node distance=6mm,
every node/.style={draw, fill=blue!8, minimum height=9mm, align=center,
font=\small, on chain, join},
every join/.style={-Stealth, thick}]
\node[rounded corners=4.5mm, fill=red!15] {Sample};
\node {Extract\\DNA};
\node {PCR};
\node {Sequence};
\node[trapezium, trapezium left angle=70, trapezium right angle=110, trapezium stretches,
fill=green!15] {Report};
\end{tikzpicture}Full document
\documentclass[border=4pt]{standalone}
\usepackage{tikz}
\usetikzlibrary{chains, arrows.meta, shapes.geometric}
\begin{document}
\begin{tikzpicture}[start chain=going right, node distance=6mm,
    every node/.style={draw, fill=blue!8, minimum height=9mm, align=center,
                       font=\small, on chain, join},
    every join/.style={-Stealth, thick}]
  \node[rounded corners=4.5mm, fill=red!15] {Sample};
  \node {Extract\\DNA};
  \node {PCR};
  \node {Sequence};
  \node[trapezium, trapezium left angle=70, trapezium right angle=110, trapezium stretches,
        fill=green!15] {Report};
\end{tikzpicture}
\end{document}Aligning large flowcharts with a matrix
When a flowchart has several columns, relative positioning can drift: a wide box in one column pushes everything after it. A \matrix fixes the grid instead. Each cell holds one \node, empty cells keep the columns in place, row sep and column sep set the gaps, and the arrows are drawn afterwards between the named nodes. The columns line up on their centres, so Clean data, Fit model and Publish form one straight column however wide the boxes on the left are. The TikZ matrix page explains the syntax in full.
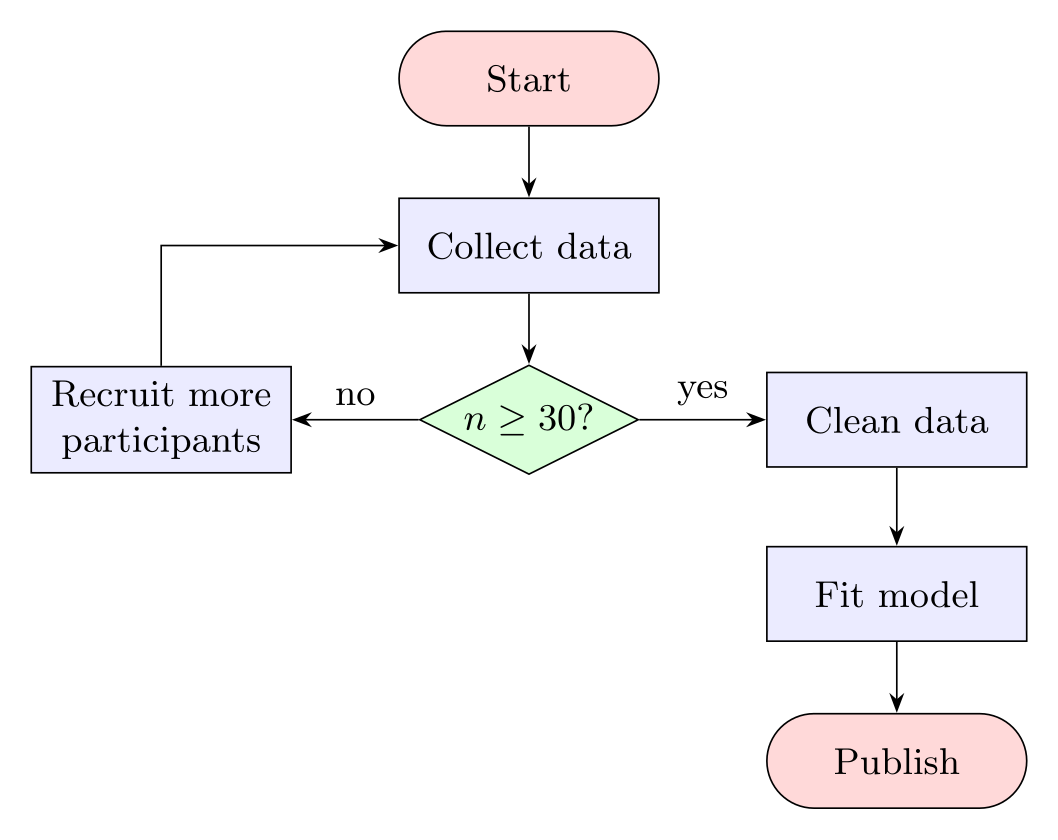
\usepackage{tikz} \usetikzlibrary{matrix, shapes.geometric, arrows.meta}\begin{tikzpicture}[>=Stealth, font=\small,
box/.style={draw, fill=blue!8, minimum width=22mm, minimum height=8mm, align=center},
term/.style={box, rounded corners=4mm, fill=red!15},
decision/.style={draw, fill=green!15, diamond, aspect=2, inner sep=1pt}]
\matrix[row sep=6mm, column sep=9mm] {
& \node[term] (s) {Start}; & \\
& \node[box] (a) {Collect data}; & \\
\node[box] (more) {Recruit more\\participants};
& \node[decision] (q) {$n \ge 30$?}; & \node[box] (c) {Clean data}; \\
& & \node[box] (m) {Fit model}; \\
& & \node[term] (e) {Publish}; \\
};
\draw[->] (s) -- (a);
\draw[->] (a) -- (q);
\draw[->] (q) -- node[above] {yes} (c);
\draw[->] (q) -- node[above] {no} (more);
\draw[->] (more) |- (a);
\draw[->] (c) -- (m);
\draw[->] (m) -- (e);
\end{tikzpicture}Full document
\documentclass[border=4pt]{standalone}
\usepackage{tikz}
\usetikzlibrary{matrix, shapes.geometric, arrows.meta}
\begin{document}
\begin{tikzpicture}[>=Stealth, font=\small,
    box/.style={draw, fill=blue!8, minimum width=22mm, minimum height=8mm, align=center},
    term/.style={box, rounded corners=4mm, fill=red!15},
    decision/.style={draw, fill=green!15, diamond, aspect=2, inner sep=1pt}]
  \matrix[row sep=6mm, column sep=9mm] {
                                    & \node[term] (s) {Start};          & \\
                                    & \node[box] (a) {Collect data};    & \\
    \node[box] (more) {Recruit more\\participants};
                                    & \node[decision] (q) {$n \ge 30$?}; & \node[box] (c) {Clean data}; \\
                                    &                                   & \node[box] (m) {Fit model}; \\
                                    &                                   & \node[term] (e) {Publish}; \\
  };
  \draw[->] (s) -- (a);
  \draw[->] (a) -- (q);
  \draw[->] (q) -- node[above] {yes} (c);
  \draw[->] (q) -- node[above] {no}  (more);
  \draw[->] (more) |- (a);
  \draw[->] (c) -- (m);
  \draw[->] (m) -- (e);
\end{tikzpicture}
\end{document}Swimlane (cross-functional) flowcharts
Swimlanes show who does each step. Here every lane is 2 cm high, the nodes sit on the lane centres at y = 0, -2 and -4, and the lanes are drawn last but on the background layer (backgrounds library), so they can be sized to the finished chart and still appear behind it. One \foreach over y/name/colour triples fills the lanes and writes the rotated lane titles; a few lines draw the grid.
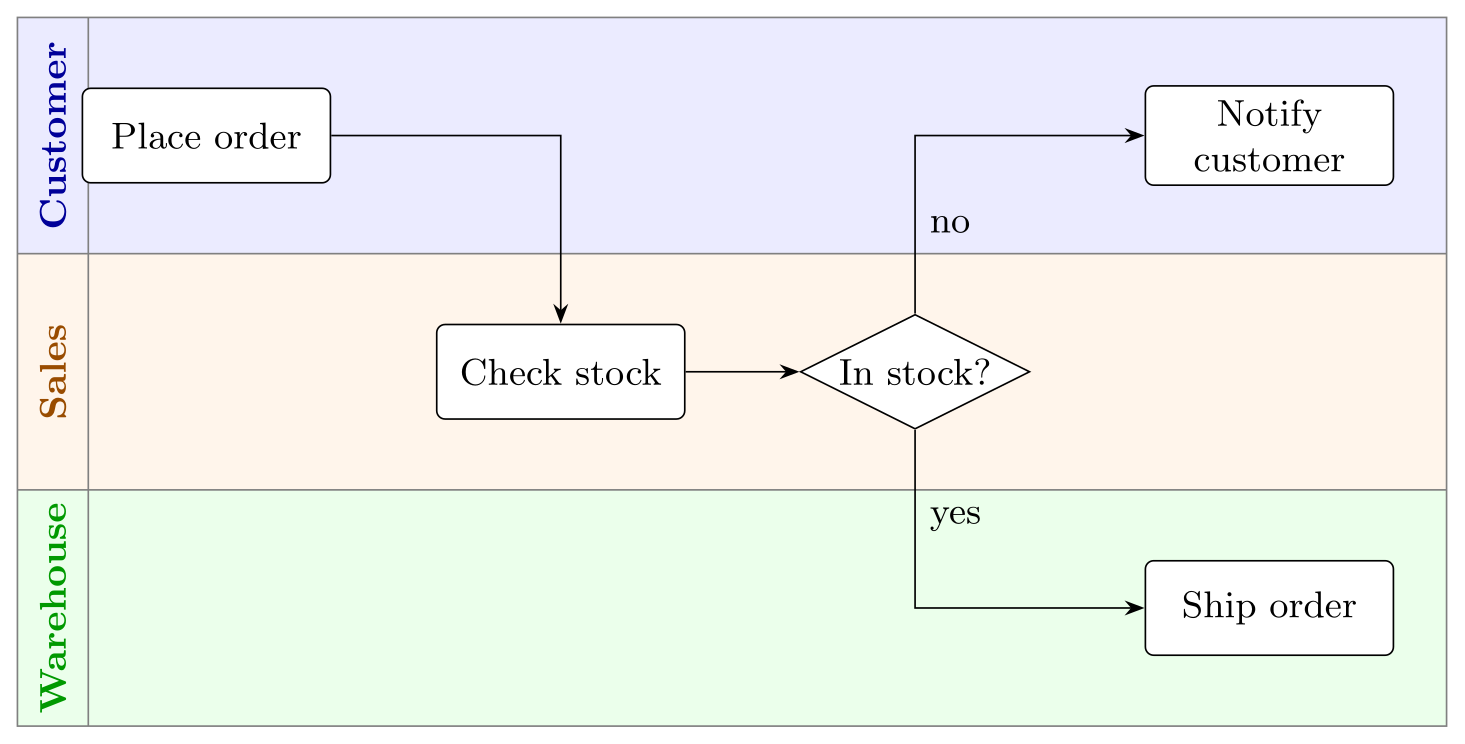
\usepackage{tikz} \usetikzlibrary{arrows.meta, shapes.geometric, backgrounds}\begin{tikzpicture}[>=Stealth, font=\small,
box/.style={draw, fill=white, rounded corners=2pt, minimum width=21mm,
minimum height=8mm, align=center},
decision/.style={draw, fill=white, diamond, aspect=2, inner sep=1pt}]
% lanes are 2 cm high; nodes sit on the lane centres y = 0, -2, -4
\node[box] (order) at (0,0) {Place order};
\node[box] (check) at (3,-2) {Check stock};
\node[decision] (instock) at (6,-2) {In stock?};
\node[box] (ship) at (9,-4) {Ship order};
\node[box] (notify) at (9,0) {Notify\\customer};
\draw[->] (order) -| (check);
\draw[->] (check) -- (instock);
\draw[->] (instock) |- node[pos=0.25, right] {yes} (ship);
\draw[->] (instock) |- node[pos=0.25, right] {no} (notify);
\begin{scope}[on background layer]
\foreach \y/\lane/\col in {0/Customer/blue, -2/Sales/orange, -4/Warehouse/green} {
\fill[\col!8] (-1.6,\y+1) rectangle (10.5,\y-1);
\node[rotate=90, font=\small\bfseries, text=\col!60!black] at (-1.3,\y) {\lane};
}
\draw[gray] (-1.6,1) rectangle (10.5,-5) (-1.6,-1) -- (10.5,-1) (-1.6,-3) -- (10.5,-3)
(-1,1) -- (-1,-5);
\end{scope}
\end{tikzpicture}Full document
\documentclass[border=4pt]{standalone}
\usepackage{tikz}
\usetikzlibrary{arrows.meta, shapes.geometric, backgrounds}
\begin{document}
\begin{tikzpicture}[>=Stealth, font=\small,
    box/.style={draw, fill=white, rounded corners=2pt, minimum width=21mm,
                minimum height=8mm, align=center},
    decision/.style={draw, fill=white, diamond, aspect=2, inner sep=1pt}]
  % lanes are 2 cm high; nodes sit on the lane centres y = 0, -2, -4
  \node[box]      (order)   at (0,0)    {Place order};
  \node[box]      (check)   at (3,-2)   {Check stock};
  \node[decision] (instock) at (6,-2)   {In stock?};
  \node[box]      (ship)    at (9,-4)   {Ship order};
  \node[box]      (notify)  at (9,0)    {Notify\\customer};
  \draw[->] (order) -| (check);
  \draw[->] (check) -- (instock);
  \draw[->] (instock) |- node[pos=0.25, right] {yes} (ship);
  \draw[->] (instock) |- node[pos=0.25, right] {no}  (notify);
  \begin{scope}[on background layer]
    \foreach \y/\lane/\col in {0/Customer/blue, -2/Sales/orange, -4/Warehouse/green} {
      \fill[\col!8] (-1.6,\y+1) rectangle (10.5,\y-1);
      \node[rotate=90, font=\small\bfseries, text=\col!60!black] at (-1.3,\y) {\lane};
    }
    \draw[gray] (-1.6,1) rectangle (10.5,-5)  (-1.6,-1) -- (10.5,-1)  (-1.6,-3) -- (10.5,-3)
                (-1,1) -- (-1,-5);
  \end{scope}
\end{tikzpicture}
\end{document}Flowchart generators and live preview
There is no reliable generator that turns a description into good TikZ, so the practical way is the template above plus a quick preview loop. The LabCanvas TikZ editor typesets TikZ with TeX Live as you pause typing, shows errors at their line, and has a flowchart among its starting examples: paste the template, change the texts, and adjust node distance or a minimum width while watching the result. It downloads the chart as a PNG at 300 or 600 dpi; for the PDF in your document, compile the same code in LaTeX.
If your flowchart is really a graph whose layout you do not want to choose, the graph drawing library’s layered layout (LuaLaTeX only) places the boxes in levels automatically; see TikZ graphs. For a flowchart drawn with the mouse, use a diagram editor and include its output as an image; it will not match your document’s fonts the way TikZ does.
Common errors and how to fix them
| LaTeX says (or you see) | Cause and fix |
|---|---|
| Package pgfkeys Error: I do not know the key '/tikz/diamond' and I am going to ignore it. Perhaps you misspelled it. | diamond, trapezium, ellipse and cylinder come from \usetikzlibrary{shapes.geometric}. |
| Package pgfkeys Error: I do not know the key '/tikz/rounded rectangle' and I am going to ignore it. Perhaps you misspelled it. | rounded rectangle is in \usetikzlibrary{shapes.misc} (tape and signal are in shapes.symbols). Or draw the terminator as a rectangle with rounded corners of half its height. |
| Package PGF Math Error: Unknown function `of' (in 'of a'). | below=of a (or right=of a) needs \usetikzlibrary{positioning}; without it, TikZ reads "of a" as a length. |
| Package pgfkeys Error: I do not know the key '/tikz/start chain', to which you passed 'going right', and I am going to ignore it. Perhaps you misspelled it. | start chain, on chain and join come from \usetikzlibrary{chains}. |
| Package pgfkeys Error: I do not know the key '/font', to which you passed '\scriptsize \ttfamily ', and I am going to ignore it. Perhaps you misspelled it. | A style was given the name of an existing TikZ key, here name/.style={font=…}, which breaks every node name. Rename the style (tag, caption, answer…); avoid name, label, node and other built-in keys. |
| The text of a box runs together on one line (no error) | A \\ inside a node is ignored unless the node has align=center (or left/right) or a text width. Put align=center in the common box style. |
| The input/output parallelogram is far too wide (no error) | A trapezium keeps its proportions when minimum height enlarges it. Add trapezium stretches so width and height can grow independently. |
| The yes/no label sits on the corner of the arrow (no error) | On a -| or |- path, midway (pos=0.5) is the corner. Use pos=0.25 for the first leg or pos=0.75 for the second. |
Frequently asked questions
How do I make a flowchart in LaTeX?
Use TikZ: load \usetikzlibrary{shapes.geometric, arrows.meta, positioning}, define a style for each kind of box, place the boxes with below=of and right=of, and draw arrows between their names with \draw[->] (a) -- (b);. Copy the template on this page and change the texts.
How do I draw a decision diamond with yes and no in TikZ?
Make the node with diamond, aspect=2 (shapes.geometric), then label each outgoing arrow with a node: \draw[->] (d) -- node[left] {yes} (a); and \draw[->] (d) -- node[above] {no} (b);. On a -| or |- arrow, put the label at pos=0.25 so it is not on the corner.
How do I draw an arrow back to an earlier box?
Route it around the chart: \draw[->] (last.west) -- ++(-8mm,0) |- (target.west); goes left, then up and into the target from the side. From a box beside the target, (box) |- (target) is enough.
Is there a LaTeX flowchart generator online?
There is no tool that writes good TikZ from a description, but an online TikZ editor with live preview, such as the LabCanvas TikZ editor, lets you start from a flowchart template and see each change at once. Copy the finished code into your document with the \usetikzlibrary line it needs.
How do I make a horizontal flowchart in TikZ?
Place each box right=of the previous one, or use the chains library: start chain=going right on the picture, and on chain, join on every node, which places the boxes in a row and draws the arrows.
How do I make all flowchart boxes the same size?
Give their common style a minimum width and minimum height (for example 30mm and 9mm) and align=center. Boxes grow only if their text needs more room; for long texts add a text width so the text wraps instead.
References
- PGF/TikZ manual, §5 Tutorial: Diagrams as Simple Graphstikz.dev
- PGF/TikZ manual, §14.2 The Line-To Operation (|- and -|)tikz.dev
- PGF/TikZ manual, §17.5.3 Advanced Placement Options (positioning library)tikz.dev
- PGF/TikZ manual, §17.8 Placing Nodes on a Line or Curve Explicitly (pos, midway)tikz.dev
- PGF/TikZ manual, §71.3 Geometric Shapes (diamond, trapezium, cylinder)tikz.dev
- PGF/TikZ manual, §71.4 Symbol Shapes (tape, signal)tikz.dev
- PGF/TikZ manual, §71.8 Miscellaneous Shapes (rounded rectangle)tikz.dev
- PGF/TikZ manual, §48 Chainstikz.dev
- PGF/TikZ manual, §45 Background Librarytikz.dev
- PGF/TikZ manual, §20 Matrices and Alignmenttikz.dev
- pgf package (TikZ) 3.1.12 on CTAN, with the full manual as PDFctan.org
The facts on this page were checked against these sources, and every picture is the code with it typeset with TeX Live 2026. Code on this page: CC0 1.0, copy it freely.
Try the code in your browserEvery snippet on this page opens in the free TikZ editor: it is typeset with TeX Live as you type, with errors pointed at their line.
Open the TikZ editor