TikZ nodes: shapes, anchors, positioning and labels
Quick answer
\node[draw, circle] (a) at (0,0) {Text};. The options choose the shape (rectangle by default, circle, or ellipse and others from shapes.geometric), the size (minimum size, inner sep) and the position (anchor=north west, above, or right=1cm of a with the positioning library). The name in parentheses lets you connect nodes, \draw[->] (a) -- (b);, and refer to points on them such as (a.north east).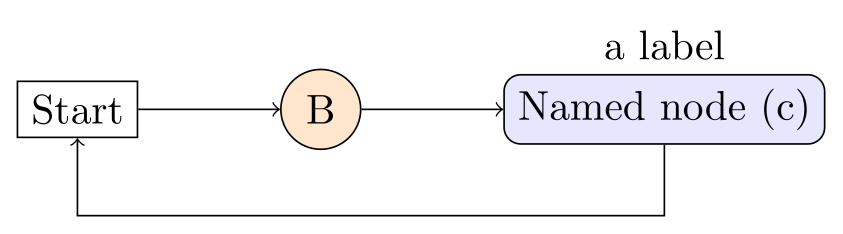
\usepackage{tikz} \usetikzlibrary{positioning}\begin{tikzpicture}[node distance=1.2cm]
\node[draw] (a) at (0,0) {Start};
\node[draw, circle, fill=orange!20, right=of a] (b) {B};
\node[draw, rounded corners, fill=blue!10, right=of b,
label=above:{a label}] (c) {Named node (c)};
\draw[->] (a) -- (b);
\draw[->] (b) -- (c);
\draw[->] (c.south) -- ++(0,-0.6) -| (a.south);
\end{tikzpicture}Full document
\documentclass[border=4pt]{standalone}
\usepackage{tikz}
\usetikzlibrary{positioning}
\begin{document}
\begin{tikzpicture}[node distance=1.2cm]
  \node[draw] (a) at (0,0) {Start};
  \node[draw, circle, fill=orange!20, right=of a] (b) {B};
  \node[draw, rounded corners, fill=blue!10, right=of b,
        label=above:{a label}] (c) {Named node (c)};
  \draw[->] (a) -- (b);
  \draw[->] (b) -- (c);
  \draw[->] (c.south) -- ++(0,-0.6) -| (a.south);
\end{tikzpicture}
\end{document}Contents
The \node command: options, name, position, text
The full form is \node[⟨options⟩] (⟨name⟩) at (⟨coordinate⟩) {⟨text⟩};. Everything between \node and the text is optional and can come in any order, but the text in braces is required, even if it is empty: {} makes an empty node, and leaving the braces out stops LaTeX with A node must have a (possibly empty) label text. \node is short for \path node, so it ends with a semicolon like any path.
A node can also sit on a path: \draw (0,0) node {A} -- (2,0) node {B}; puts A and B at the two ends of the line. Nodes are not part of the path itself; TikZ draws them on top of it once the path is finished, and draw or fill given to the path never applies to its nodes (give them to the node).
\coordinate (p) at (1,2); is a node with no text and no size, just a named point; it is the same as \node[shape=coordinate] (p) at (1,2) {};. Without at, a node goes to the current point of the path, which for \node alone is the origin.
Node shapes: rectangle, circle, ellipse and more
The shape is set with shape=circle or simply circle: when TikZ meets an option it does not know, it tries it as a colour, then as an arrow specification, then as a shape name (§12.4.1). Only rectangle (the default), circle and coordinate are built in. ellipse, diamond, regular polygon, star, trapezium, isosceles triangle and cylinder need \usetikzlibrary{shapes.geometric}; rounded rectangle and cross out are in shapes.misc, cloud in shapes.symbols. Without the library, ellipse is just an unknown key.
A shape is only an outline until you add draw (stroke it) or fill. Every shape is fitted around the text: the circle is the smallest circle around the text box plus the inner sep, which is why a long word in a regular polygon makes a large polygon. The shapes library page has all of them with their options: see TikZ shapes.
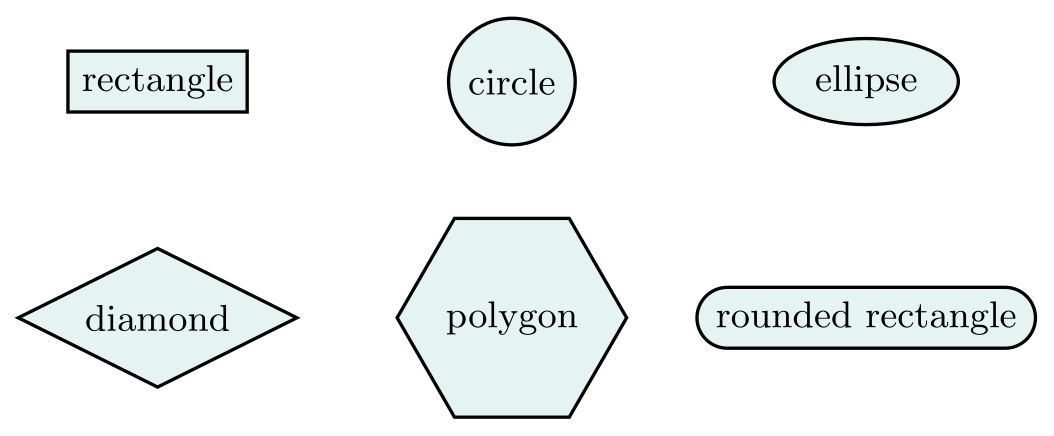
\usepackage{tikz} \usetikzlibrary{shapes.geometric, shapes.misc}\begin{tikzpicture}[every node/.style={draw, thick, fill=teal!10, font=\small}]
\node[rectangle] at (0,0) {rectangle};
\node[circle] at (3,0) {circle};
\node[ellipse] at (6,0) {ellipse};
\node[diamond, aspect=2] at (0,-2) {diamond};
\node[regular polygon, regular polygon sides=6, inner sep=1pt]
at (3,-2) {polygon};
\node[rounded rectangle] at (6,-2) {rounded rectangle};
\end{tikzpicture}Full document
\documentclass[border=4pt]{standalone}
\usepackage{tikz}
\usetikzlibrary{shapes.geometric, shapes.misc}
\begin{document}
\begin{tikzpicture}[every node/.style={draw, thick, fill=teal!10, font=\small}]
  \node[rectangle]         at (0,0)   {rectangle};
  \node[circle]            at (3,0)   {circle};
  \node[ellipse]           at (6,0)   {ellipse};
  \node[diamond, aspect=2] at (0,-2)  {diamond};
  \node[regular polygon, regular polygon sides=6, inner sep=1pt]
                           at (3,-2)  {polygon};
  \node[rounded rectangle] at (6,-2)  {rounded rectangle};
\end{tikzpicture}
\end{document}Node size: inner sep, minimum size and outer sep
A node is as large as its text plus the inner sep on every side, initially .3333em (a third of the font size); inner xsep and inner ysep set the two directions separately. inner sep=0pt makes the border touch the text.
minimum width, minimum height and minimum size (both at once) make the shape at least that big, inner sep included; text that needs more room still grows the node. That is how you get circles of equal size: without a minimum, a circle around “100” is larger than one around “1”; with minimum size=1cm, larger than every label, they all match. Always give a unit: minimum size=1 means 1pt. For wrapped text, text width=3cm fixes the width of the text itself.
outer sep is invisible space outside the border, half the line width by default, so the anchors sit on the outside of a drawn line and arrows stop exactly at it. The manual recommends outer sep=auto early in a document: it also makes the outer sep 0 for nodes that are filled but not drawn and compensates for scaled nodes.
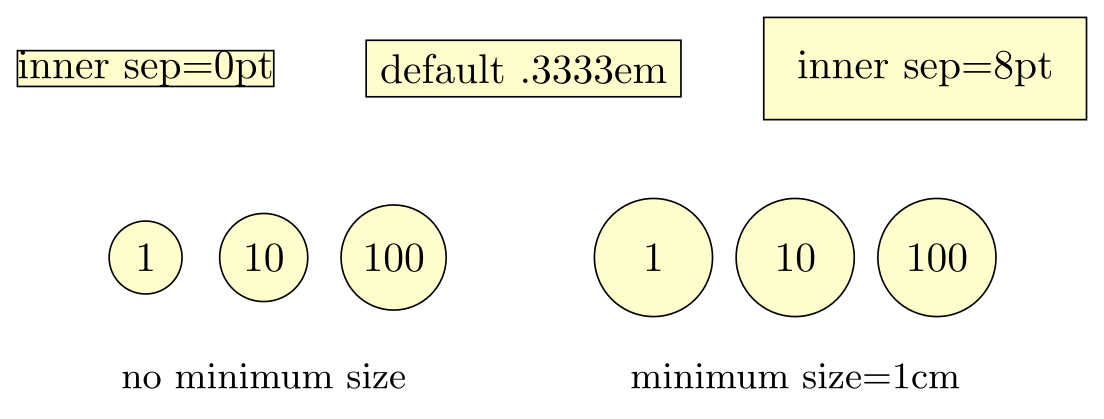
\usepackage{tikz}\begin{tikzpicture}[every node/.style={draw, fill=yellow!20}]
% inner sep: the padding between text and border
\node[inner sep=0pt] at (0,0) {inner sep=0pt};
\node at (3.2,0) {default .3333em};
\node[inner sep=8pt] at (6.6,0) {inner sep=8pt};
% circles grow with their text...
\node[circle] at (0,-1.6) {1};
\node[circle] at (1,-1.6) {10};
\node[circle] at (2.1,-1.6) {100};
% ...unless a minimum size is larger than every label
\begin{scope}[every node/.append style={circle, minimum size=1cm}]
\node at (4.3,-1.6) {1};
\node at (5.5,-1.6) {10};
\node at (6.7,-1.6) {100};
\end{scope}
\node[draw=none, fill=none, font=\small] at (1,-2.6) {no minimum size};
\node[draw=none, fill=none, font=\small] at (5.5,-2.6) {minimum size=1cm};
\end{tikzpicture}Full document
\documentclass[border=4pt]{standalone}
\usepackage{tikz}
\begin{document}
\begin{tikzpicture}[every node/.style={draw, fill=yellow!20}]
  % inner sep: the padding between text and border
  \node[inner sep=0pt] at (0,0)   {inner sep=0pt};
  \node                at (3.2,0) {default .3333em};
  \node[inner sep=8pt] at (6.6,0) {inner sep=8pt};
  % circles grow with their text...
  \node[circle] at (0,-1.6)   {1};
  \node[circle] at (1,-1.6)   {10};
  \node[circle] at (2.1,-1.6) {100};
  % ...unless a minimum size is larger than every label
  \begin{scope}[every node/.append style={circle, minimum size=1cm}]
    \node at (4.3,-1.6) {1};
    \node at (5.5,-1.6) {10};
    \node at (6.7,-1.6) {100};
  \end{scope}
  \node[draw=none, fill=none, font=\small] at (1,-2.6) {no minimum size};
  \node[draw=none, fill=none, font=\small] at (5.5,-2.6) {minimum size=1cm};
\end{tikzpicture}
\end{document}Node anchors: north, south east, center, base and angles
Every shape defines anchors, named points on and in it. The rectangle and circle have the eight compass points north, north east, east, south east, south, south west, west, north west, plus center, base, base west, base east (on the text baseline), mid, mid west, mid east (.5ex, half the height of an “x”, above the baseline) and text (where the text starts: the left end of its baseline). A number is a border anchor: (r.20) is where a ray from the centre at 20° meets the border.
The compass anchors follow the shape, not its bounding box: on a circle, north east is on the circle at 45°, not at the corner of the square around it. Shapes from the libraries add their own, such as apex and left corner on a triangle or corner 1 on a polygon; the manual draws every anchor of every shape in §71.
You use anchors in two ways: (r.north east) is a coordinate for drawing, and anchor=north east in a node’s options places that point of the node at its position. The base anchors matter for text: with the default anchor=center, letters with and without descenders end up at different heights, while anchor=base puts all baselines on the coordinate, as the second row below shows.
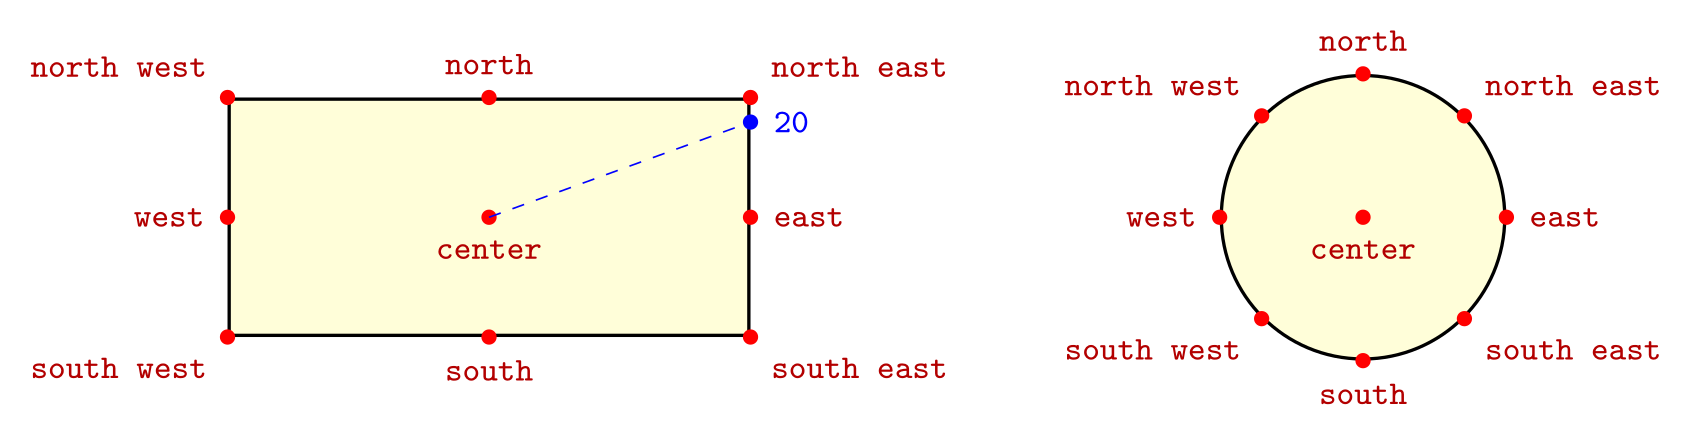
\usepackage{tikz}\begin{tikzpicture}[dot/.style={circle, fill=red, inner sep=1.3pt},
lbl/.style={font=\ttfamily\footnotesize, text=red!70!black}]
\node[draw, thick, fill=yellow!15, minimum width=4.4cm, minimum height=2cm] (r) {};
\foreach \a/\p in {north west/above left, north/above, north east/above right,
west/left, center/below, east/right,
south west/below left, south/below, south east/below right}
\node[dot, label={[lbl]\p:\a}] at (r.\a) {};
\draw[blue, dashed] (r.center) -- (r.20);
\node[dot, fill=blue, label={[lbl, text=blue]right:20}] at (r.20) {};
\node[draw, thick, fill=yellow!15, circle, minimum size=2.4cm] (c) at (7.4,0) {};
\foreach \a/\p in {north west/above left, north/above, north east/above right,
west/left, center/below, east/right,
south west/below left, south/below, south east/below right}
\node[dot, label={[lbl]\p:\a}] at (c.\a) {};
\end{tikzpicture}Full document
\documentclass[border=4pt]{standalone}
\usepackage{tikz}
\begin{document}
\begin{tikzpicture}[dot/.style={circle, fill=red, inner sep=1.3pt},
                    lbl/.style={font=\ttfamily\footnotesize, text=red!70!black}]
  \node[draw, thick, fill=yellow!15, minimum width=4.4cm, minimum height=2cm] (r) {};
  \foreach \a/\p in {north west/above left, north/above, north east/above right,
                     west/left, center/below, east/right,
                     south west/below left, south/below, south east/below right}
    \node[dot, label={[lbl]\p:\a}] at (r.\a) {};
  \draw[blue, dashed] (r.center) -- (r.20);
  \node[dot, fill=blue, label={[lbl, text=blue]right:20}] at (r.20) {};

  \node[draw, thick, fill=yellow!15, circle, minimum size=2.4cm] (c) at (7.4,0) {};
  \foreach \a/\p in {north west/above left, north/above, north east/above right,
                     west/left, center/below, east/right,
                     south west/below left, south/below, south east/below right}
    \node[dot, label={[lbl]\p:\a}] at (c.\a) {};
\end{tikzpicture}
\end{document}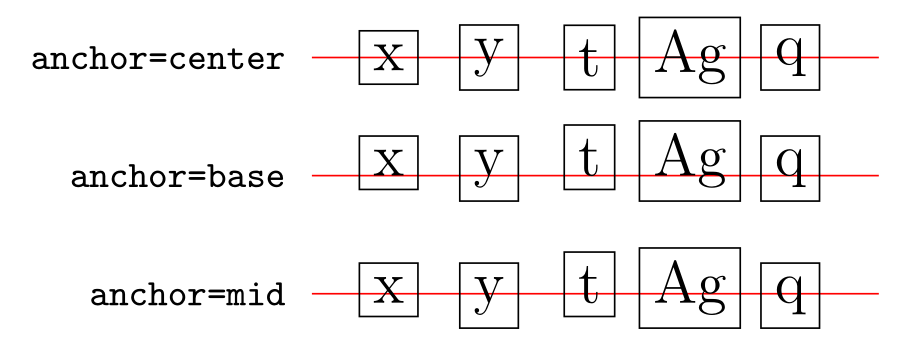
\usepackage{tikz}\begin{tikzpicture}[every node/.style={draw, font=\Large}]
\foreach \y/\anc in {2/center, 1/base, 0/mid} {
\draw[red] (-0.4,\y) -- (4.4,\y);
\node[draw=none, anchor=east, font=\ttfamily\small] at (-0.5,\y) {anchor=\anc};
\foreach \t [count=\i] in {x, y, t, Ag, q}
\node[anchor=\anc] at (\i*0.85-0.6,\y) {\t};
}
\end{tikzpicture}Full document
\documentclass[border=4pt]{standalone}
\usepackage{tikz}
\begin{document}
\begin{tikzpicture}[every node/.style={draw, font=\Large}]
  \foreach \y/\anc in {2/center, 1/base, 0/mid} {
    \draw[red] (-0.4,\y) -- (4.4,\y);
    \node[draw=none, anchor=east, font=\ttfamily\small] at (-0.5,\y) {anchor=\anc};
    \foreach \t [count=\i] in {x, y, t, Ag, q}
      \node[anchor=\anc] at (\i*0.85-0.6,\y) {\t};
  }
\end{tikzpicture}
\end{document}Node position: at, anchor, above, below, left, right
By default a node is centred on its coordinate. above is the same as anchor=south: the node’s bottom edge goes on the point, so the node is above it. Likewise below means anchor=north, left means anchor=east, right means anchor=west, and above left means anchor=south east. A length moves the node further: above=3mm. Note that above, left is not the same as above left: only the last of the two keys counts.
To place a node at a point of another node, combine both: \node[anchor=north west] at (a.south west) {…}; hangs the new node under a, aligned on the left. To shift a node by a fixed amount, use xshift and yshift, as in \node[xshift=5mm] at (a) {…};.
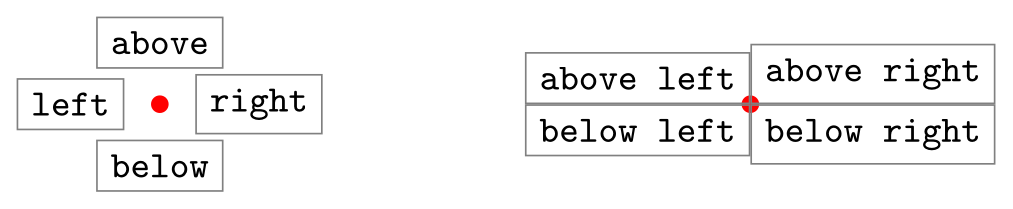
\usepackage{tikz}\begin{tikzpicture}[every node/.style={draw=gray, font=\ttfamily\small},
dot/.style={circle, fill=red, inner sep=1.5pt, draw=none}]
\node[dot] at (0,0) {};
\node[above=3mm] at (0,0) {above};
\node[below=3mm] at (0,0) {below};
\node[left=3mm] at (0,0) {left};
\node[right=3mm] at (0,0) {right};
\node[dot] at (5,0) {};
\node[above left] at (5,0) {above left};
\node[above right] at (5,0) {above right};
\node[below left] at (5,0) {below left};
\node[below right] at (5,0) {below right};
\end{tikzpicture}Full document
\documentclass[border=4pt]{standalone}
\usepackage{tikz}
\begin{document}
\begin{tikzpicture}[every node/.style={draw=gray, font=\ttfamily\small},
                    dot/.style={circle, fill=red, inner sep=1.5pt, draw=none}]
  \node[dot] at (0,0) {};
  \node[above=3mm] at (0,0) {above};
  \node[below=3mm] at (0,0) {below};
  \node[left=3mm]  at (0,0) {left};
  \node[right=3mm] at (0,0) {right};

  \node[dot] at (5,0) {};
  \node[above left]  at (5,0) {above left};
  \node[above right] at (5,0) {above right};
  \node[below left]  at (5,0) {below left};
  \node[below right] at (5,0) {below right};
\end{tikzpicture}
\end{document}The positioning library: right=of, node distance and on grid
For nodes placed next to each other, load \usetikzlibrary{positioning} and write right=of a: the new node’s west border is placed one node distance to the right of a’s east border, whatever the widths of the two nodes. right=2cm of a uses another gap, and below=5mm of a.south west places relative to a single point. node distance is 1cm and 1cm once the library is loaded; with two values, as in node distance=5mm and 2cm, the first is used vertically and the second horizontally.
With on grid, the distance is measured between the centres instead, so a chain of nodes sits on a regular grid even when their sizes differ (and nodes can overlap if the distance is too small). The diagonal keys differ subtly: above left=1cm of b moves 1 cm along the 135° diagonal, while above left=1cm and 1cm of b moves 1 cm up and 1 cm left. The library also adds base right=of and mid right=of, which line up the text baselines of a row of nodes.
The older right of=a (with “of” before the equals sign) works without the library but is deprecated: it puts the centres a node distance apart, ignoring the sizes. Writing right=of a without loading the library fails with Unknown function `of', because without the library right expects a length.
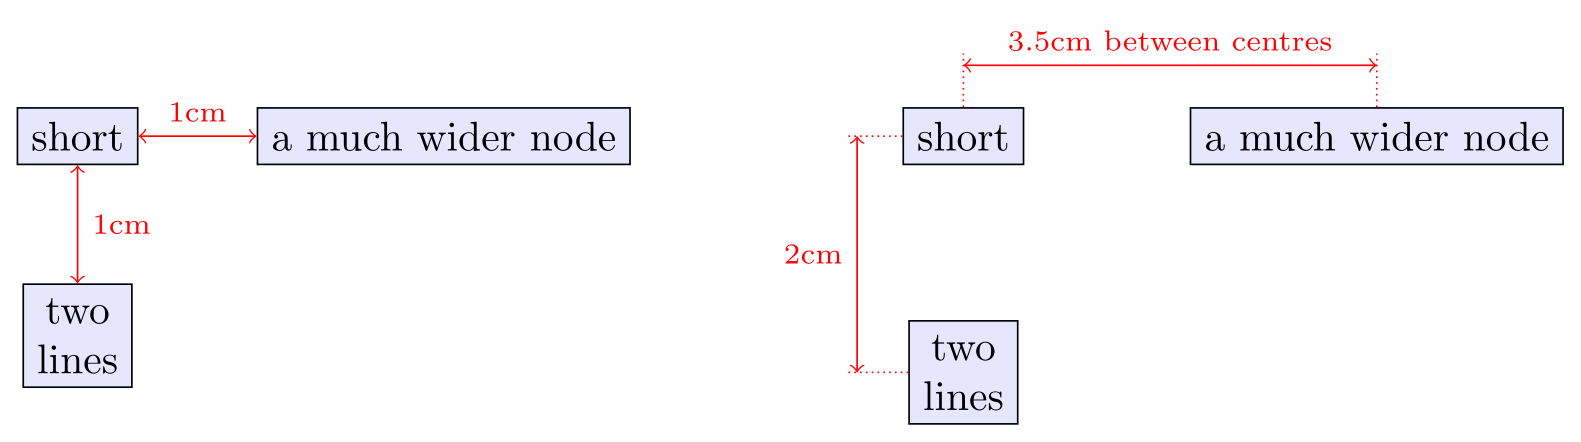
\usepackage{tikz} \usetikzlibrary{positioning}\begin{tikzpicture}[every node/.style={draw, fill=blue!10}, node distance=1cm,
gap/.style={<->, red}, note/.style={font=\scriptsize, text=red}]
% default: node distance is measured between the borders
\node (a) {short};
\node (b) [right=of a] {a much wider node};
\node (c) [below=of a, align=center] {two\\lines};
\draw[gap] (a.east) -- (b.west) node[midway, above, draw=none, fill=none, note] {1cm};
\draw[gap] (a.south) -- (c.north) node[midway, right, draw=none, fill=none, note] {1cm};
% on grid: the distances are measured between the centres
\begin{scope}[xshift=7.5cm, on grid, node distance=2cm and 3.5cm]
\node (a2) {short};
\node (b2) [right=of a2] {a much wider node};
\node (c2) [below=of a2, align=center] {two\\lines};
\draw[red, densely dotted] (a2.north) -- ([yshift=7mm]a2.center)
(b2.north) -- ([yshift=7mm]b2.center)
(a2.west) -- ([xshift=-1cm]a2.center)
(c2.west) -- ([xshift=-1cm]c2.center);
\draw[gap] ([yshift=6mm]a2.center) -- ([yshift=6mm]b2.center)
node[midway, above, draw=none, fill=none, note] {3.5cm between centres};
\draw[gap] ([xshift=-9mm]a2.center) -- ([xshift=-9mm]c2.center)
node[midway, left, draw=none, fill=none, note] {2cm};
\end{scope}
\end{tikzpicture}Full document
\documentclass[border=4pt]{standalone}
\usepackage{tikz}
\usetikzlibrary{positioning}
\begin{document}
\begin{tikzpicture}[every node/.style={draw, fill=blue!10}, node distance=1cm,
                    gap/.style={<->, red}, note/.style={font=\scriptsize, text=red}]
  % default: node distance is measured between the borders
  \node (a) {short};
  \node (b) [right=of a] {a much wider node};
  \node (c) [below=of a, align=center] {two\\lines};
  \draw[gap] (a.east) -- (b.west) node[midway, above, draw=none, fill=none, note] {1cm};
  \draw[gap] (a.south) -- (c.north) node[midway, right, draw=none, fill=none, note] {1cm};

  % on grid: the distances are measured between the centres
  \begin{scope}[xshift=7.5cm, on grid, node distance=2cm and 3.5cm]
    \node (a2) {short};
    \node (b2) [right=of a2] {a much wider node};
    \node (c2) [below=of a2, align=center] {two\\lines};
    \draw[red, densely dotted] (a2.north) -- ([yshift=7mm]a2.center)
                               (b2.north) -- ([yshift=7mm]b2.center)
                               (a2.west) -- ([xshift=-1cm]a2.center)
                               (c2.west) -- ([xshift=-1cm]c2.center);
    \draw[gap] ([yshift=6mm]a2.center) -- ([yshift=6mm]b2.center)
      node[midway, above, draw=none, fill=none, note] {3.5cm between centres};
    \draw[gap] ([xshift=-9mm]a2.center) -- ([xshift=-9mm]c2.center)
      node[midway, left, draw=none, fill=none, note] {2cm};
  \end{scope}
\end{tikzpicture}
\end{document}Node labels and pins
label=above:text adds a second node next to the first without making it bigger, the usual way to name a state or a vertex. The position is an angle (label=30:text, measured from the centre, the label pointing away from the border) or a direction (above, below left …); without one, label position applies, initially above. Options for the label go in square brackets first, and then the whole value needs braces: label={[red, font=\small]below:text}. Braces are also needed when the text contains a comma or a colon: label=above:$f(x,y)$ breaks at the comma.
label distance (initially 0pt) moves labels away from the border. pin=60:text is a label joined to the node by a line; pin distance is initially 3ex and the line uses the every pin edge style (initially help lines), changed per pin with pin edge={blue, thick}.
The quotes library shortens all of this: \node["top" above, "right" right] {A}; is a label at each position. If you use a babel language that makes " active (German, French and others), also load \usetikzlibrary{babel}.
One trap: label and pin nodes are nodes, so every node/.style applies to them too. A picture-wide every node/.style={circle, minimum size=1cm} turns every label into an invisible 1 cm circle and pushes it away from its node. Put the shape in a named style instead, like state/.style below.
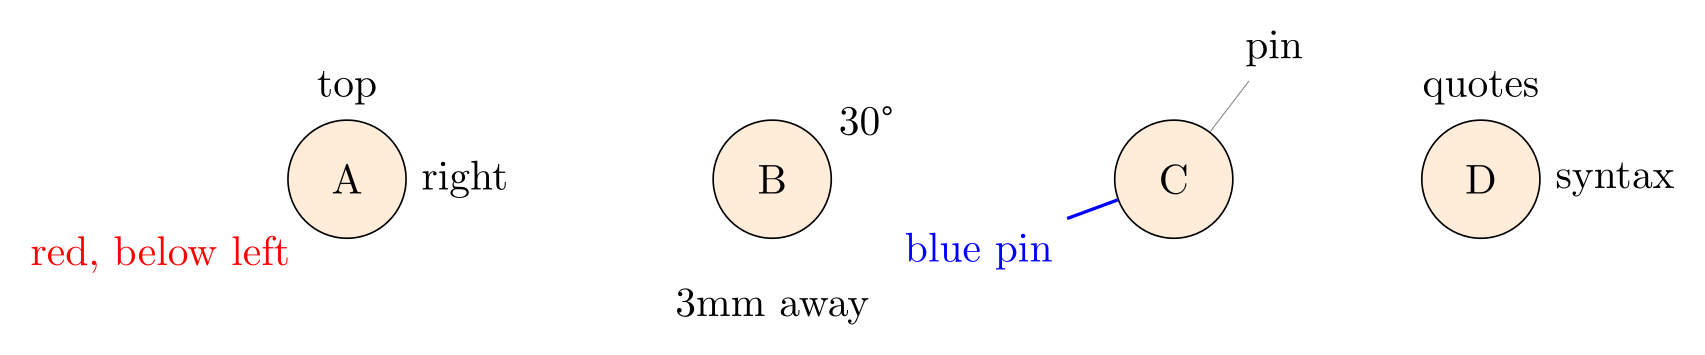
\usepackage{tikz} \usetikzlibrary{quotes}\begin{tikzpicture}[state/.style={circle, draw, fill=orange!15, minimum size=1cm}]
\node[state, label=above:top, label=right:right,
label={[red]below left:{red, below left}}] at (0,0) {A};
\node[state, label=30:30°, label={[label distance=3mm]-90:3mm away}] at (3.6,0) {B};
\node[state, pin=60:pin, pin={[pin edge={blue, thick}, text=blue]200:blue pin}] at (7,0) {C};
\node[state, "quotes" above, "syntax" right] at (9.6,0) {D};
\end{tikzpicture}Full document
\documentclass[border=4pt]{standalone}
\usepackage{tikz}
\usetikzlibrary{quotes}
\begin{document}
\begin{tikzpicture}[state/.style={circle, draw, fill=orange!15, minimum size=1cm}]
  \node[state, label=above:top, label=right:right,
        label={[red]below left:{red, below left}}] at (0,0) {A};
  \node[state, label=30:30°, label={[label distance=3mm]-90:3mm away}] at (3.6,0) {B};
  \node[state, pin=60:pin, pin={[pin edge={blue, thick}, text=blue]200:blue pin}] at (7,0) {C};
  \node[state, "quotes" above, "syntax" right] at (9.6,0) {D};
\end{tikzpicture}
\end{document}Naming nodes and connecting them
A name in parentheses after the options (or name=a) makes the node usable as a coordinate. (a) alone is special in a path: a line drawn from or to it stops at the node’s border, in the direction of the other end, so \draw[->] (a) -- (b); joins two boxes neatly. (a.center) goes to the true centre, (a.east) or (a.-40) to that anchor. |- goes vertically then horizontally and -| the other way, which suits flowcharts; both also respect node borders.
A coordinate has no border, so a line to (p) ends exactly on the point. Node names may contain spaces, digits and underscores (start node, y_1), but not dots, commas or colons: in (v1.2) TikZ reads the dot as “anchor 2 of node v1” and reports No shape named `v1' is known. Node positions do not follow later transformations: (a.north) stays where the node is even inside a scope with scale=2.
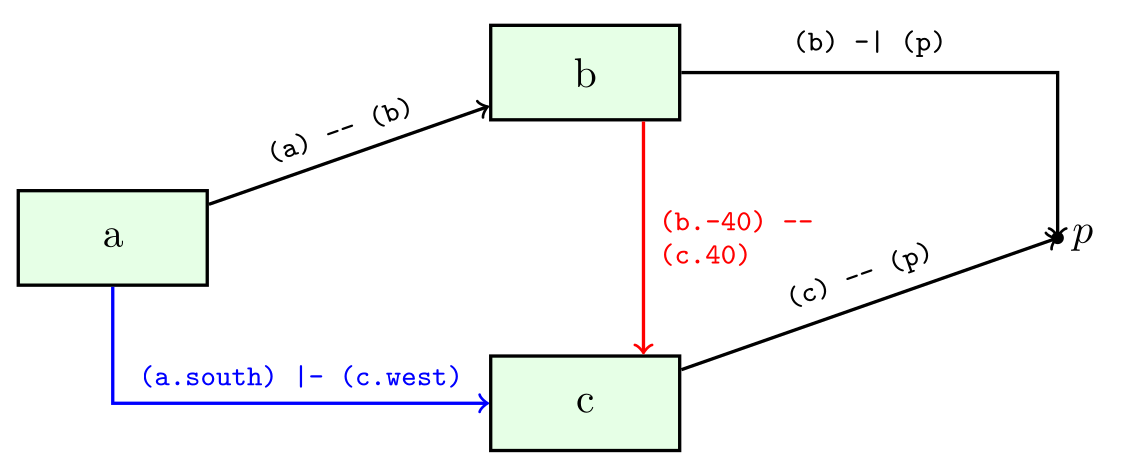
\usepackage{tikz}\begin{tikzpicture}[box/.style={draw, thick, fill=green!10, minimum width=1.6cm, minimum height=8mm},
code/.style={font=\ttfamily\scriptsize, sloped, above}]
\node[box] (a) at (0,0) {a};
\node[box] (b) at (4,1.4) {b};
\node[box] (c) at (4,-1.4) {c};
\coordinate (p) at (8,0);
\fill (p) circle[radius=1.5pt] node[right] {$p$};
\draw[->, thick] (a) -- node[code] {(a) -- (b)} (b);
\draw[->, thick, blue] (a.south) |- node[code, pos=0.75] {(a.south) |- (c.west)} (c.west);
\draw[->, thick, red] (b.-40) -- node[font=\ttfamily\scriptsize, right, align=left]
{(b.-40) --\\(c.40)} (c.40);
\draw[->, thick] (b) -| node[code, pos=0.25] {(b) -| (p)} (p);
\draw[->, thick] (c) -- node[code] {(c) -- (p)} (p);
\end{tikzpicture}Full document
\documentclass[border=4pt]{standalone}
\usepackage{tikz}
\begin{document}
\begin{tikzpicture}[box/.style={draw, thick, fill=green!10, minimum width=1.6cm, minimum height=8mm},
                    code/.style={font=\ttfamily\scriptsize, sloped, above}]
  \node[box] (a) at (0,0)    {a};
  \node[box] (b) at (4,1.4)  {b};
  \node[box] (c) at (4,-1.4) {c};
  \coordinate (p) at (8,0);
  \fill (p) circle[radius=1.5pt] node[right] {$p$};

  \draw[->, thick] (a) -- node[code] {(a) -- (b)} (b);
  \draw[->, thick, blue] (a.south) |- node[code, pos=0.75] {(a.south) |- (c.west)} (c.west);
  \draw[->, thick, red] (b.-40) -- node[font=\ttfamily\scriptsize, right, align=left]
    {(b.-40) --\\(c.40)} (c.40);
  \draw[->, thick] (b) -| node[code, pos=0.25] {(b) -| (p)} (p);
  \draw[->, thick] (c) -- node[code] {(c) -- (p)} (p);
\end{tikzpicture}
\end{document}Nodes on a path: pos, midway and sloped
A node after a line or curve with pos=⟨fraction⟩ sits on that segment: 0 is its start, 1 its end. midway is pos=0.5, near start 0.25, near end 0.75, very near start 0.125, very near end 0.875, and at start and at end are 0 and 1. A node written directly after --, as in (0,0) -- node[above] {midway} (2,0), gets midway automatically. On a -| or |- path, 0.5 is the corner. On a curve, pos is a time parameter, not an exact fraction of the length.
sloped rotates the node to follow the line, never upside down (allow upside down lifts that rule), and auto places labels beside the line rather than on it, with swap (or ') for the other side. The arrows page shows labels on arrows in more detail.
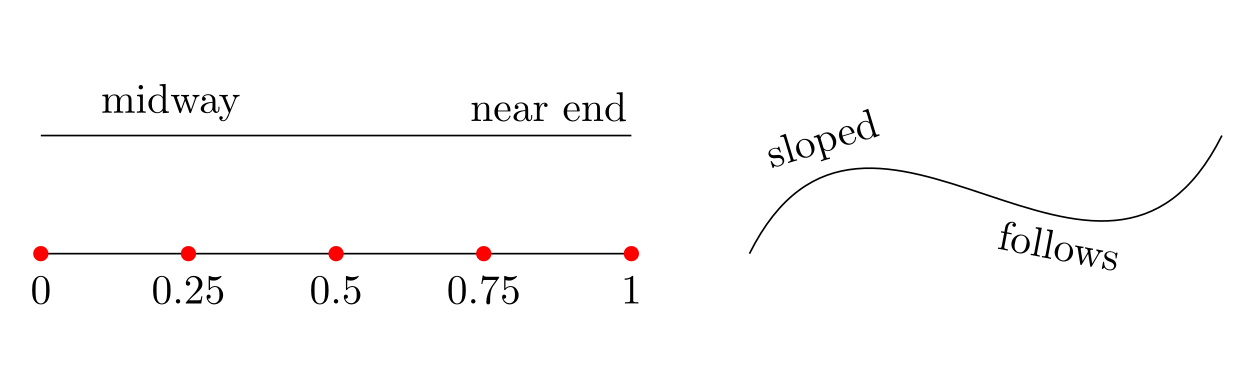
\usepackage{tikz}\begin{tikzpicture}[dot/.style={circle, fill=red, inner sep=1.3pt}]
\draw (0,0) -- (5,0)
foreach \p in {0, 0.25, 0.5, 0.75, 1} { node[dot, pos=\p, label=below:\p] {} };
\draw (0,1) -- node[above] {midway} (2.2,1) -- node[above, near end] {near end} (5,1);
\draw (6,0) .. controls (7,2) and (9,-1) .. (10,1)
node[pos=0.2, sloped, above] {sloped}
node[pos=0.65, sloped, below] {follows};
\end{tikzpicture}Full document
\documentclass[border=4pt]{standalone}
\usepackage{tikz}
\begin{document}
\begin{tikzpicture}[dot/.style={circle, fill=red, inner sep=1.3pt}]
  \draw (0,0) -- (5,0)
    foreach \p in {0, 0.25, 0.5, 0.75, 1} { node[dot, pos=\p, label=below:\p] {} };
  \draw (0,1) -- node[above] {midway} (2.2,1) -- node[above, near end] {near end} (5,1);

  \draw (6,0) .. controls (7,2) and (9,-1) .. (10,1)
    node[pos=0.2, sloped, above] {sloped}
    node[pos=0.65, sloped, below] {follows};
\end{tikzpicture}
\end{document}Scaling and rotating nodes: transform shape
scale=2 on a picture or scope scales coordinates, so lines and shapes drawn with paths get bigger, but nodes keep their size and font. The manual’s reasoning: “Scaling text is evil, rotating slightly less so.” To scale nodes with the picture, add transform shape. A transformation given in the node’s own options always applies to it: \node[scale=2] {A}; doubles the node and its text, and \node[rotate=90] {…}; turns it.
For larger text, a bigger font is usually better than scaling, because the letter shapes and line widths stay right: font=\Large or node font=\Large (with node font, sizes given in em follow the new font). To shrink a whole finished figure, text included, wrap the picture in \resizebox{\linewidth}{!}{…} or \scalebox{0.8}{…} from the graphicx package.
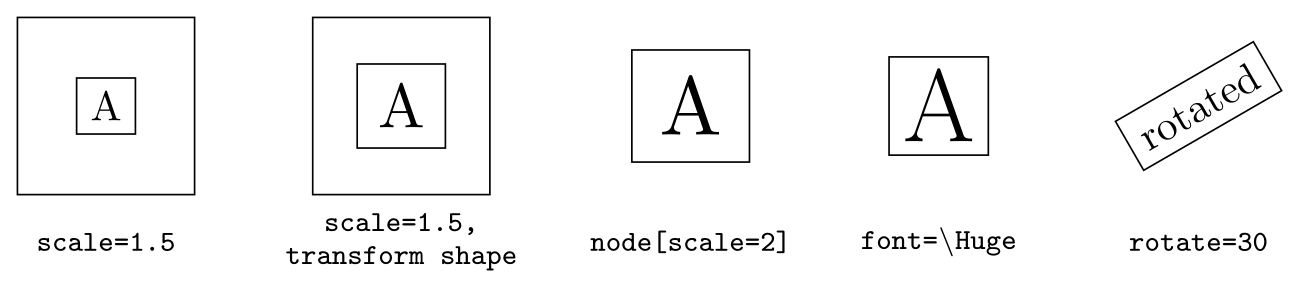
\usepackage{tikz}\begin{tikzpicture}[lbl/.style={font=\ttfamily\scriptsize, align=center}]
\begin{scope}[scale=1.5]
\draw (0,0) rectangle (1,1);
\node[draw] at (0.5,0.5) {A};
\end{scope}
\node[lbl] at (0.75,-0.4) {scale=1.5};
\begin{scope}[xshift=2.5cm, scale=1.5, transform shape]
\draw (0,0) rectangle (1,1);
\node[draw] at (0.5,0.5) {A};
\end{scope}
\node[lbl] at (3.25,-0.4) {scale=1.5,\\transform shape};
\node[draw, scale=2] at (5.7,0.75) {A};
\node[lbl] at (5.7,-0.4) {node[scale=2]};
\node[draw, font=\Huge] at (7.8,0.75) {A};
\node[lbl] at (7.8,-0.4) {font=\textbackslash Huge};
\node[draw, rotate=30] at (10,0.75) {rotated};
\node[lbl] at (10,-0.4) {rotate=30};
\end{tikzpicture}Full document
\documentclass[border=4pt]{standalone}
\usepackage{tikz}
\begin{document}
\begin{tikzpicture}[lbl/.style={font=\ttfamily\scriptsize, align=center}]
  \begin{scope}[scale=1.5]
    \draw (0,0) rectangle (1,1);
    \node[draw] at (0.5,0.5) {A};
  \end{scope}
  \node[lbl] at (0.75,-0.4) {scale=1.5};

  \begin{scope}[xshift=2.5cm, scale=1.5, transform shape]
    \draw (0,0) rectangle (1,1);
    \node[draw] at (0.5,0.5) {A};
  \end{scope}
  \node[lbl] at (3.25,-0.4) {scale=1.5,\\transform shape};

  \node[draw, scale=2]   at (5.7,0.75) {A};
  \node[lbl] at (5.7,-0.4) {node[scale=2]};

  \node[draw, font=\Huge] at (7.8,0.75) {A};
  \node[lbl] at (7.8,-0.4) {font=\textbackslash Huge};

  \node[draw, rotate=30] at (10,0.75) {rotated};
  \node[lbl] at (10,-0.4) {rotate=30};
\end{tikzpicture}
\end{document}Styling many nodes at once
Repeating draw, circle, fill=orange!15, minimum size=1cm on every node is error-prone; define a style instead. In the picture options, state/.style={circle, draw, minimum size=1cm} lets you write \node[state] {A};; with \tikzset{…} in the preamble the style works in every picture. every node/.style={…} applies to all nodes of a picture or scope (and, as noted above, to labels), every circle node/.style only to nodes of that shape, and font=\small on the picture sets the font of all its nodes. More on styles is on the shapes page.
Common errors and how to fix them
| LaTeX says (or you see) | Cause and fix |
|---|---|
| Package PGF Math Error: Unknown function `of' (in 'of a'). | right=of a, below=of a and the like need \usetikzlibrary{positioning}. Without it, right expects a length, and “of a” is not one. |
| Package pgfkeys Error: I do not know the key '/tikz/ellipse' and I am going to ignore it. Perhaps you misspelled it. | Only rectangle, circle and coordinate are built in. Load \usetikzlibrary{shapes.geometric} for ellipse, diamond, star, regular polygon, trapezium, isosceles triangle and cylinder, shapes.misc for rounded rectangle and cross out, shapes.symbols for cloud. |
| Package pgf Error: No shape named `b' is known. | The path refers to a node that does not exist (yet): a typo in the name, a node defined later in the code, or one defined in another tikzpicture. Define the node first; across pictures you need remember picture and two LaTeX runs. |
| Package tikz Error: A node must have a (possibly empty) label text. | Every \node needs its text in braces at the end, even an empty one: \node[draw, circle] (a) at (0,0) {};. For a named point without text or size, use \coordinate (a) at (0,0);. |
| Package pgfkeys Error: I do not know the key '/tikz/y)$' and I am going to ignore it. Perhaps you misspelled it. | A comma inside a label (here label=above:$f(x,y)$) splits the option list. Put braces around the text: label=above:{$f(x,y)$}, or around the whole value when it has options: label={[red]above:{$f(x,y)$}}. |
| Package pgf Error: No shape named `v1' is known. | The node name contains a dot (v1.2), which TikZ reads as node v1, anchor 2. Node names must not contain dots, commas or colons; use v1-2 or v12. |
| Labels or pins end up far away from their node (no error) | every node/.style also applies to label and pin nodes, so a minimum size or shape set there makes each label a large invisible node. Put the node look in a named style (state/.style={…}) and use it on the nodes. |
| scale=2 makes the drawing bigger but not the nodes (no error) | Transformations of the picture do not apply to nodes. Add transform shape to the picture or scope, give the node its own scale=2, or use a larger font. |
Frequently asked questions
How do I place a node relative to another node in TikZ?
Load \usetikzlibrary{positioning} and write \node[right=of a] (b) {B};. The gap between the borders is the node distance (1cm unless you set node distance=…); right=2cm of a sets it directly. Add on grid to measure between centres instead. Without the library, \node[anchor=west] at (a.east) {B}; does the same with no gap.
What are the anchors of a TikZ node?
Rectangles and circles have center, the compass points north, north east, east, south east, south, south west, west and north west, the baseline anchors base, base west and base east, the mid anchors mid, mid west and mid east, text, and border anchors given as an angle such as (a.30). Library shapes add their own (apex, corner 1, …); §71 of the manual draws them all.
How do I change the size of a node in TikZ?
Use minimum width, minimum height or minimum size (with a unit, such as 1cm) for a node that is at least that big, inner sep for the padding around the text, and text width for wrapped text of a fixed width. A node never becomes smaller than its text plus the inner sep. To enlarge the text as well, use a bigger font or the node’s own scale option.
How do I add a label to a node in TikZ?
Add label=above:Text to the node’s options (or below, left, right, or an angle such as label=30:Text). Options for the label go in brackets with braces around everything: label={[red]below:Text}. pin=above:Text adds a label connected by a line, and with the quotes library \node["Text" above] {…}; is a short form.
How do I set the distance between nodes in TikZ?
With the positioning library, set node distance=1.5cm on the picture (or node distance=1cm and 2cm for vertical and horizontal), then place nodes with right=of a, below=of a and so on; a single node can override it with right=3cm of a. The distance is between borders unless on grid is set.
How do I scale a node in TikZ?
Give the node its own scale: \node[scale=1.5] {…};. scale on the tikzpicture or a scope does not affect nodes unless you add transform shape. For text, font=\Large usually looks better than scaling, and \scalebox or \resizebox around the whole picture scales everything including the text.
References
- PGF/TikZ manual, §17.2.1 Syntax of the Node Commandtikz.dev
- PGF/TikZ manual, §17.2.2 Predefined Shapestikz.dev
- PGF/TikZ manual, §17.2.3 Common Options: Separations, Margins, Padding and Border Rotationtikz.dev
- PGF/TikZ manual, §17.5.1 Positioning Nodes Using Anchorstikz.dev
- PGF/TikZ manual, §17.5.2 Basic Placement Options (above, left, above left)tikz.dev
- PGF/TikZ manual, §17.5.3 Advanced Placement Options (positioning library, node distance, on grid)tikz.dev
- PGF/TikZ manual, §17.7 Transformations (transform shape)tikz.dev
- PGF/TikZ manual, §17.8 Placing Nodes on a Line or Curve Explicitly (pos, sloped, auto)tikz.dev
- PGF/TikZ manual, §17.10 The Label and Pin Options (and the quotes syntax)tikz.dev
- PGF/TikZ manual, §17.11 Connecting Nodes: Using Nodes as Coordinatestikz.dev
- PGF/TikZ manual, §71.2 Predefined Shapes (anchor diagrams of rectangle and circle)tikz.dev
- PGF/TikZ manual, §12.4.1 How Graphic Options Are Processed (unknown keys as colours, arrows, shapes)tikz.dev
- pgf package (TikZ) on CTAN, with the full manual as PDFctan.org
The facts on this page were checked against these sources, and every picture is the code with it typeset with TeX Live 2026. Code on this page: CC0 1.0, copy it freely.
Try the code in your browserEvery snippet on this page opens in the free TikZ editor: it is typeset with TeX Live as you type, with errors pointed at their line.
Open the TikZ editor