TikZ libraries: what each one adds and how to load it
Quick answer
\usepackage{tikz}, with \usetikzlibrary{positioning, arrows.meta, calc}: one command, names separated by commas. Libraries add keys and shapes that plain TikZ does not know, so a missing one shows up as an error such as I do not know the key ‘/tikz/diamond’. The most used are positioning (right=of a), calc (($(A)!0.5!(B)$)), arrows.meta (-Stealth), shapes.geometric, decorations.*, patterns, fit, backgrounds and matrix.
\usepackage{tikz} \usetikzlibrary{positioning, arrows.meta, shapes.geometric}\begin{tikzpicture}[node distance=12mm, thick]
\node[draw, rounded corners] (a) {start};
\node[draw, diamond, aspect=2, right=of a] (b) {test}; % shapes.geometric, positioning
\node[draw, ellipse, right=of b] (c) {end};
\draw[-{Stealth[length=3mm]}] (a) -- (b); % arrows.meta
\draw[-{Stealth[length=3mm]}] (b) -- (c);
\end{tikzpicture}Full document
\documentclass[border=4pt]{standalone}
\usepackage{tikz}
\usetikzlibrary{positioning, arrows.meta, shapes.geometric}
\begin{document}
\begin{tikzpicture}[node distance=12mm, thick]
  \node[draw, rounded corners] (a) {start};
  \node[draw, diamond, aspect=2, right=of a] (b) {test};  % shapes.geometric, positioning
  \node[draw, ellipse, right=of b] (c) {end};
  \draw[-{Stealth[length=3mm]}] (a) -- (b);               % arrows.meta
  \draw[-{Stealth[length=3mm]}] (b) -- (c);
\end{tikzpicture}
\end{document}Contents
How to load a library
\usetikzlibrary{⟨list⟩} loads one or more libraries, separated by commas, and can be repeated: \usetikzlibrary{positioning} and \usetikzlibrary{calc, arrows.meta} on two lines are fine. It must come after \usepackage{tikz} (before it, LaTeX stops with Undefined control sequence at \usetikzlibrary) and belongs in the preamble with the other setup. Loading a library a second time does nothing, so it is safe to list a library that another one also loads.
For each name, TikZ loads the file tikzlibrary⟨name⟩.code.tex, or pgflibrary⟨name⟩.code.tex if the first does not exist. A misspelt name stops with I did not find the tikz library ‘positionning’. I looked for files named tikzlibrarypositionning.code.tex and pgflibrarypositionning.code.tex, but neither could be found in the current texmf trees. Related commands load other kinds of library: \usepgflibrary for libraries of the basic pgf layer, \usegdlibrary for graph-drawing algorithms (after graphdrawing), and \usepgfplotslibrary for pgfplots. Packages built on TikZ, such as pgfplots, tikz-cd and circuitikz, are not libraries: they are loaded with \usepackage.
The most used TikZ libraries
| Library | What it adds | Example | Manual |
|---|---|---|---|
positioning | Placement relative to other nodes, measured between borders, with node distance and on grid | \node[right=of a] {B}; | §17.5.3 |
calc | Coordinate arithmetic inside ($ … $): partway, distance, projection, sums | ($(A)!0.5!(B)$) | §13.5, §46 |
arrows.meta | Configurable arrow tips: Stealth, Latex, Triangle, Circle, Bar, Bracket, Hooks… | -{Stealth[length=3mm]} | §16.5 |
bending | Arrow tips that follow curved paths (flex, bend) | -{Stealth[bend]} | §16.3.8 |
shapes.geometric | Node shapes: ellipse, diamond, regular polygon, star, trapezium, cylinder, isosceles triangle, kite, dart, semicircle, circular sector | \node[draw, diamond] {?}; | §71.3 |
shapes.symbols | cloud, starburst, signal, tape, magnetic tape, magnifying glass, forbidden sign | \node[draw, cloud] {}; | §71.4 |
shapes.arrows | single arrow, double arrow, arrow box | \node[draw, single arrow] {go}; | §71.5 |
shapes.multipart | Nodes with several text parts: rectangle split, circle split, ellipse split, diamond split | {a \nodepart{second} b} | §71.6 |
shapes.callouts | rectangle, ellipse and cloud callouts (speech bubbles) | \node[draw, ellipse callout] {hi}; | §71.7 |
shapes.misc | rounded rectangle, chamfered rectangle, cross out, strike out | \node[draw, rounded rectangle] {x}; | §71.8 |
decorations.pathmorphing | zigzag, snake, coil, bumps, saw, random steps, bent | decorate, decoration=snake | §50.3 |
decorations.pathreplacing | brace, ticks, border, waves, expanding waves, show path construction | decoration={brace, mirror} | §50.4 |
decorations.markings | Arrow tips or any code at positions along a path | mark=at position 0.5 with {\arrow{>}} | §50.5 |
decorations.text | Text set along a path | decoration={text along path, text={…}} | §50.7 |
patterns | Named fill patterns: north east lines, grid, crosshatch, dots, bricks, checkerboard, stars… | pattern=north east lines | §62.1 |
patterns.meta | Patterns with options: Lines, Hatch, Dots, Stars (marked experimental) | pattern={Lines[angle=45, distance=2mm]} | §62.3 |
shadows | drop shadow, copy shadow, double copy shadow, circular drop shadow | \node[draw, drop shadow] {x}; | §70 |
shadows.blur | Soft, blurred shadows (from the separate package pgf-blur, included in TeX Live) | \node[draw, blur shadow] {x}; | CTAN |
fit | A node sized to enclose given coordinates or nodes | \node[draw, fit=(a) (b)] {}; | §54 |
backgrounds | Background layer (on background layer), framed, show background rectangle | \begin{scope}[on background layer] | §45 |
matrix | matrix of nodes, matrix of math nodes, delimiters (the basic \matrix is built in) | \matrix[matrix of nodes] {a & b \\}; | §59 |
trees | Growth functions (grow cyclic, grow via three points) and edge from parent fork down (trees themselves are built in) | [grow cyclic, sibling angle=60] | §76 |
mindmap | Mind maps: mindmap, concept, concept color | \node[concept] {idea}; | §60 |
intersections | Intersection points of any two named paths | name intersections={of=a and b} | §13.3.2 |
through | Circles through a given point | \node[draw, circle through=(B)] at (A) {}; | §75 |
quotes | Short "text" syntax for labels, pins, edge labels and pic texts | (a) edge["3"] (b) | §17.10.4 |
angles | angle and right angle pics to mark angles | \pic[draw] {angle=A--B--C}; | §41 |
graphs | The \graph syntax: a -> b -> {c, d} | \graph {a -> b -> c}; | §19 |
graphdrawing | Automatic layouts (tree, layered, force, circular); LuaLaTeX only | \graph[tree layout] {…}; | §28 |
external | Saves each picture as a separate PDF and reuses it in later runs | \tikzexternalize | §52 |
babel | Resets catcodes that babel languages change, inside pictures | \usetikzlibrary{babel} | §44 |
More libraries, in one line each
| Library | What it is for | Manual |
|---|---|---|
3d | Drawing on planes in 3D, e.g. canvas is xy plane at z=1 | §40 |
perspective | Three-point perspective drawings | §63 |
spy | Magnified insets of part of a picture | §72 |
automata | States, initial and accepting states for finite automata | §43 |
chains | Nodes placed one after another with start chain, on chain and join | §48 |
scopes | The {[options] …} shorthand for scopes | §12.3.2 |
math | \tikzmath{…} for variables, loops and functions | §58 |
fpu | Floating-point arithmetic for large or tiny numbers (pgfplots uses it) | §56 |
fadings | Predefined fadings (transparency masks) | §53 |
shadings | More shadings, such as color wheel | §69 |
circuits.ee.IEC, circuits.logic.US … | TikZ’s own circuit symbols (the circuitikz package is the more common choice) | §49 |
calendar, er, petri, folding | Calendars, entity–relationship diagrams, Petri nets, paper-folding nets | §47, §51, §64, §61 |
lindenmayersystems, turtle, svg.path | L-system fractals, turtle graphics, paths written in SVG path syntax | §57, §77, §73 |
plotmarks, views | More plot mark symbols; fitting a picture into a view box | §66, §78 |
arrows, arrows.spaced | Old arrow tips such as triangle 45; the manual calls them deprecated, use arrows.meta | §42 |
positioning: place nodes relative to each other
With positioning, right=of a places a node to the right of node a with a gap of node distance (initially 1 cm and 1 cm) between their borders, and right=5mm of a sets the gap directly. node distance=8mm and 12mm sets the vertical and horizontal gaps; diagonal placements such as below right=of b use both. With on grid, the distance is measured centre to centre instead, which keeps nodes of different sizes aligned. Without the library, right=of a stops with Package PGF Math Error: Unknown function `of' (in 'of a').
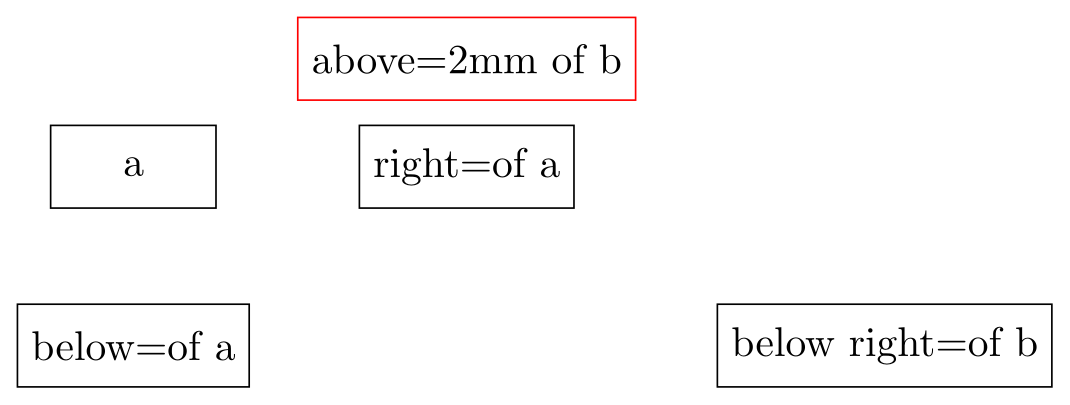
\usepackage{tikz} \usetikzlibrary{positioning}\begin{tikzpicture}[node distance=8mm and 12mm,
every node/.style={draw, minimum width=14mm, minimum height=7mm}]
\node (a) {a};
\node[right=of a] (b) {right=of a};
\node[below=of a] (c) {below=of a};
\node[below right=of b] (d) {below right=of b};
\node[above=2mm of b, draw=red] {above=2mm of b};
\end{tikzpicture}Full document
\documentclass[border=4pt]{standalone}
\usepackage{tikz}
\usetikzlibrary{positioning}
\begin{document}
\begin{tikzpicture}[node distance=8mm and 12mm,
                    every node/.style={draw, minimum width=14mm, minimum height=7mm}]
  \node (a) {a};
  \node[right=of a] (b) {right=of a};
  \node[below=of a] (c) {below=of a};
  \node[below right=of b] (d) {below right=of b};
  \node[above=2mm of b, draw=red] {above=2mm of b};
\end{tikzpicture}
\end{document}arrows.meta: arrow tips
arrows.meta defines the modern arrow tips with capitalised names and options in square brackets; a tip with options needs braces around it, -{Stealth[length=4mm, open]}. Without the library, -Stealth stops with Package pgf Error: Unknown arrow tip kind 'Stealth'. The lowercase tips ->, -latex and -stealth are built in. Every tip, size and style is shown on the TikZ arrows page.
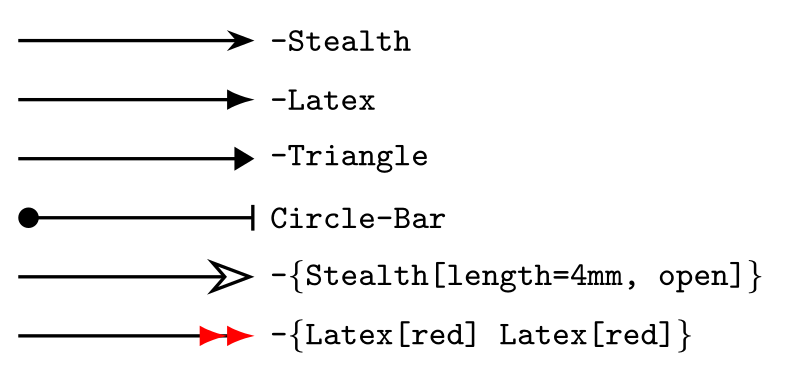
\usepackage{tikz} \usetikzlibrary{arrows.meta}\begin{tikzpicture}[thick, every node/.style={right, font=\footnotesize\ttfamily}]
\draw[-Stealth] (0,0) -- (2,0) node {-Stealth};
\draw[-Latex] (0,-0.5) -- (2,-0.5) node {-Latex};
\draw[-Triangle] (0,-1) -- (2,-1) node {-Triangle};
\draw[Circle-Bar] (0,-1.5) -- (2,-1.5) node {Circle-Bar};
\draw[-{Stealth[length=4mm, open]}] (0,-2) -- (2,-2) node {-\{Stealth[length=4mm, open]\}};
\draw[-{Latex[red] Latex[red]}] (0,-2.5) -- (2,-2.5) node {-\{Latex[red] Latex[red]\}};
\end{tikzpicture}Full document
\documentclass[border=4pt]{standalone}
\usepackage{tikz}
\usetikzlibrary{arrows.meta}
\begin{document}
\begin{tikzpicture}[thick, every node/.style={right, font=\footnotesize\ttfamily}]
  \draw[-Stealth]  (0,0)    -- (2,0)    node {-Stealth};
  \draw[-Latex]    (0,-0.5) -- (2,-0.5) node {-Latex};
  \draw[-Triangle] (0,-1)   -- (2,-1)   node {-Triangle};
  \draw[Circle-Bar] (0,-1.5) -- (2,-1.5) node {Circle-Bar};
  \draw[-{Stealth[length=4mm, open]}] (0,-2) -- (2,-2) node {-\{Stealth[length=4mm, open]\}};
  \draw[-{Latex[red] Latex[red]}] (0,-2.5) -- (2,-2.5) node {-\{Latex[red] Latex[red]\}};
\end{tikzpicture}
\end{document}shapes.*: node shapes
Plain TikZ knows only three node shapes: rectangle, circle and coordinate. Everything else comes from one of six sub-libraries, listed in the table above. Note that the ellipse node shape is in shapes.geometric: \node[ellipse] without it stops with I do not know the key '/tikz/ellipse', even though the ellipse path operation (\draw (0,0) ellipse[x radius=2, y radius=1];) needs no library. The umbrella \usetikzlibrary{shapes} loads all of them, but the manual says it is provided for compatibility only and recommends naming the sub-libraries.
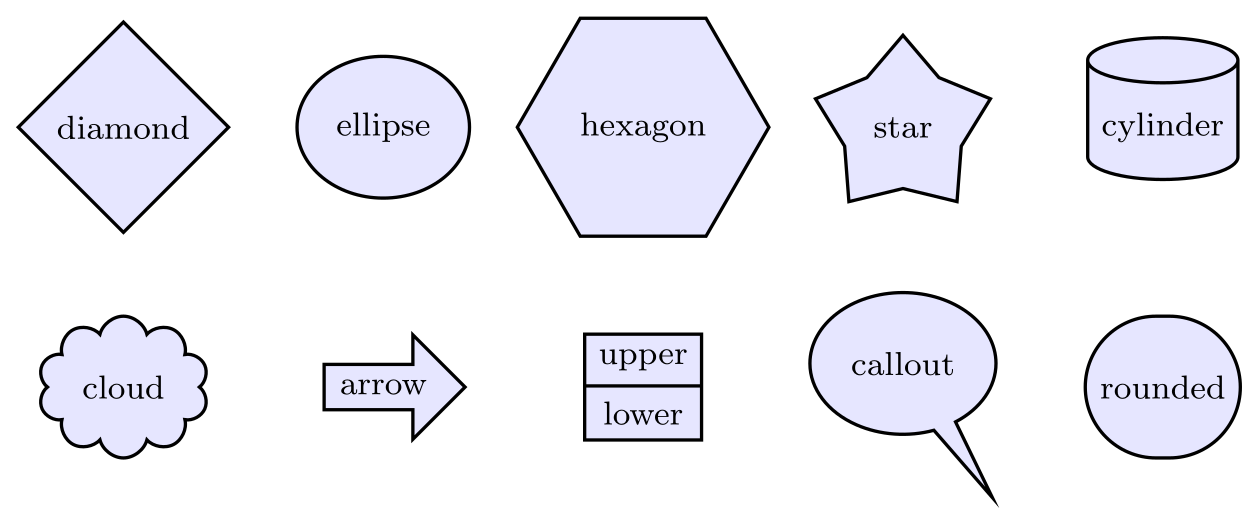
\usepackage{tikz} \usetikzlibrary{shapes.geometric, shapes.symbols, shapes.arrows} \usetikzlibrary{shapes.multipart, shapes.callouts, shapes.misc}\begin{tikzpicture}[every node/.style={draw, thick, fill=blue!10, minimum size=12mm, font=\footnotesize}]
% shapes.geometric
\node[diamond] at (0,0) {diamond};
\node[ellipse] at (2.2,0) {ellipse};
\node[regular polygon, regular polygon sides=6] at (4.4,0) {hexagon};
\node[star, star points=5, minimum size=15mm] at (6.6,0) {star};
\node[cylinder, shape border rotate=90, aspect=0.3] at (8.8,0) {cylinder};
% shapes.symbols, shapes.arrows, shapes.multipart, shapes.callouts, shapes.misc
\node[cloud, aspect=1.6] at (0,-2.2) {cloud};
\node[single arrow, minimum size=8mm] at (2.2,-2.2) {arrow};
\node[rectangle split, rectangle split parts=2, minimum size=0pt] at (4.4,-2.2)
{upper \nodepart{second} lower};
\node[ellipse callout, callout relative pointer={(0.4,-0.6)}] at (6.6,-2) {callout};
\node[rounded rectangle] at (8.8,-2.2) {rounded};
\end{tikzpicture}Full document
\documentclass[border=4pt]{standalone}
\usepackage{tikz}
\usetikzlibrary{shapes.geometric, shapes.symbols, shapes.arrows}
\usetikzlibrary{shapes.multipart, shapes.callouts, shapes.misc}
\begin{document}
\begin{tikzpicture}[every node/.style={draw, thick, fill=blue!10, minimum size=12mm, font=\footnotesize}]
  % shapes.geometric
  \node[diamond]                             at (0,0) {diamond};
  \node[ellipse]                             at (2.2,0) {ellipse};
  \node[regular polygon, regular polygon sides=6] at (4.4,0) {hexagon};
  \node[star, star points=5, minimum size=15mm] at (6.6,0) {star};
  \node[cylinder, shape border rotate=90, aspect=0.3] at (8.8,0) {cylinder};
  % shapes.symbols, shapes.arrows, shapes.multipart, shapes.callouts, shapes.misc
  \node[cloud, aspect=1.6]                   at (0,-2.2) {cloud};
  \node[single arrow, minimum size=8mm]      at (2.2,-2.2) {arrow};
  \node[rectangle split, rectangle split parts=2, minimum size=0pt] at (4.4,-2.2)
    {upper \nodepart{second} lower};
  \node[ellipse callout, callout relative pointer={(0.4,-0.6)}] at (6.6,-2) {callout};
  \node[rounded rectangle]                   at (8.8,-2.2) {rounded};
\end{tikzpicture}
\end{document}decorations.*: change, replace or annotate a path
The decoration libraries are split by what they do: decorations.pathmorphing changes the shape of a path, decorations.pathreplacing replaces it (braces, ticks), decorations.markings puts marks along it, decorations.text sets text along it, and decorations.shapes, decorations.footprints and decorations.fractals add the rest. All are used the same way: decorate, decoration={name, options}. Without any decoration library, decorate stops with Package tikz Error: You need to load a decoration library. Examples of each kind are on the coordinates and paths page.
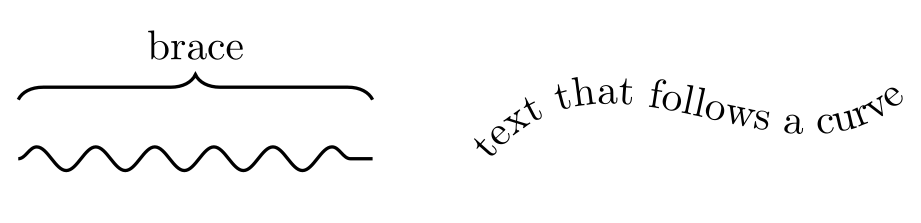
\usepackage{tikz} \usetikzlibrary{decorations.pathmorphing, decorations.pathreplacing} \usetikzlibrary{decorations.text}\begin{tikzpicture}[thick]
% decorations.pathmorphing: change the shape of the path
\draw[decorate, decoration={snake, amplitude=1mm, segment length=5mm}] (0,0) -- (3,0);
% decorations.pathreplacing: replace it, here by a brace
\draw[decorate, decoration={brace, amplitude=6pt}] (0,0.5) -- (3,0.5)
node[midway, above=6pt] {brace};
% decorations.text: typeset text along the path (the path itself is not drawn)
\path[decorate, decoration={text along path, text={text that follows a curve},
text align=center}] (4,0) .. controls (5,1.2) and (6.5,-0.4) .. (7.5,0.5);
\end{tikzpicture}Full document
\documentclass[border=4pt]{standalone}
\usepackage{tikz}
\usetikzlibrary{decorations.pathmorphing, decorations.pathreplacing}
\usetikzlibrary{decorations.text}
\begin{document}
\begin{tikzpicture}[thick]
  % decorations.pathmorphing: change the shape of the path
  \draw[decorate, decoration={snake, amplitude=1mm, segment length=5mm}] (0,0) -- (3,0);
  % decorations.pathreplacing: replace it, here by a brace
  \draw[decorate, decoration={brace, amplitude=6pt}] (0,0.5) -- (3,0.5)
    node[midway, above=6pt] {brace};
  % decorations.text: typeset text along the path (the path itself is not drawn)
  \path[decorate, decoration={text along path, text={text that follows a curve},
        text align=center}] (4,0) .. controls (5,1.2) and (6.5,-0.4) .. (7.5,0.5);
\end{tikzpicture}
\end{document}patterns and patterns.meta: hatching and dots
patterns provides named fill patterns, set with pattern=… and coloured with pattern color=…. Their size is fixed. patterns.meta adds patterns with options, Lines, Hatch, Dots and Stars, written like arrow tips: pattern={Lines[angle=30, distance=2mm, line width=0.8pt]}. The manual marks patterns.meta as experimental. Using pattern= without the library stops with Package tikz Error: You need to say \usetikzlibrary{patterns}.
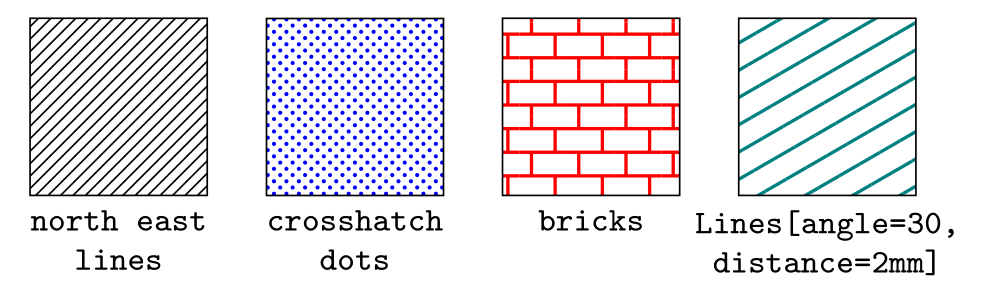
\usepackage{tikz} \usetikzlibrary{patterns, patterns.meta}\begin{tikzpicture}[every node/.style={below, font=\footnotesize\ttfamily, align=center}]
% patterns: fixed patterns by name
\draw[pattern=north east lines] (0,0) rectangle (1.5,1.5);
\node at (0.75,0) {north east\\lines};
\draw[pattern=crosshatch dots, pattern color=blue] (2,0) rectangle (3.5,1.5);
\node at (2.75,0) {crosshatch\\dots};
\draw[pattern=bricks, pattern color=red] (4,0) rectangle (5.5,1.5);
\node at (4.75,0) {bricks};
% patterns.meta: patterns with options
\draw[pattern={Lines[angle=30, distance=2mm, line width=0.8pt]}, pattern color=teal]
(6,0) rectangle (7.5,1.5);
\node at (6.75,0) {Lines[angle=30,\\distance=2mm]};
\end{tikzpicture}Full document
\documentclass[border=4pt]{standalone}
\usepackage{tikz}
\usetikzlibrary{patterns, patterns.meta}
\begin{document}
\begin{tikzpicture}[every node/.style={below, font=\footnotesize\ttfamily, align=center}]
  % patterns: fixed patterns by name
  \draw[pattern=north east lines] (0,0) rectangle (1.5,1.5);
  \node at (0.75,0) {north east\\lines};
  \draw[pattern=crosshatch dots, pattern color=blue] (2,0) rectangle (3.5,1.5);
  \node at (2.75,0) {crosshatch\\dots};
  \draw[pattern=bricks, pattern color=red] (4,0) rectangle (5.5,1.5);
  \node at (4.75,0) {bricks};
  % patterns.meta: patterns with options
  \draw[pattern={Lines[angle=30, distance=2mm, line width=0.8pt]}, pattern color=teal]
    (6,0) rectangle (7.5,1.5);
  \node at (6.75,0) {Lines[angle=30,\\distance=2mm]};
\end{tikzpicture}
\end{document}shadows and shadows.blur
shadows draws a shifted copy of a path behind it: drop shadow (gray, offset down and right), copy shadow and double copy shadow (stacked copies, like a pile of cards) and circular drop shadow. A shadow is drawn behind the node, so give the node a fill, or the shadow shows through. shadows.blur, from the separate pgf-blur package (included in TeX Live), adds blur shadow with soft edges; its options go in braces, as in blur shadow={shadow blur steps=8}.
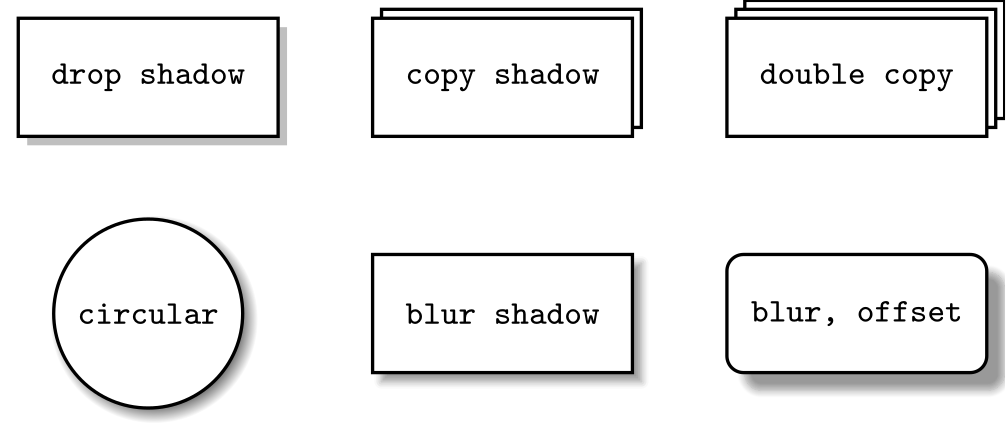
\usepackage{tikz} \usetikzlibrary{shadows, shadows.blur}\begin{tikzpicture}[every node/.style={draw, thick, fill=white, minimum width=22mm, minimum height=10mm, font=\footnotesize\ttfamily}]
\node[drop shadow] at (0,0) {drop shadow};
\node[copy shadow] at (3,0) {copy shadow};
\node[double copy shadow] at (6,0) {double copy};
\node[circular drop shadow, circle, minimum size=16mm, minimum width=0pt] at (0,-2) {circular};
\node[blur shadow] at (3,-2) {blur shadow};
\node[blur shadow={shadow blur steps=8, shadow xshift=1.5mm, shadow yshift=-1.5mm}, rounded corners]
at (6,-2) {blur, offset};
\end{tikzpicture}Full document
\documentclass[border=4pt]{standalone}
\usepackage{tikz}
\usetikzlibrary{shadows, shadows.blur}
\begin{document}
\begin{tikzpicture}[every node/.style={draw, thick, fill=white, minimum width=22mm, minimum height=10mm, font=\footnotesize\ttfamily}]
  \node[drop shadow]          at (0,0)   {drop shadow};
  \node[copy shadow]          at (3,0)   {copy shadow};
  \node[double copy shadow]   at (6,0)   {double copy};
  \node[circular drop shadow, circle, minimum size=16mm, minimum width=0pt] at (0,-2) {circular};
  \node[blur shadow]          at (3,-2)  {blur shadow};
  \node[blur shadow={shadow blur steps=8, shadow xshift=1.5mm, shadow yshift=-1.5mm}, rounded corners]
                              at (6,-2)  {blur, offset};
\end{tikzpicture}
\end{document}fit and backgrounds: frames behind groups of nodes
fit=(a) (b) (c) makes a node just large enough to contain the listed nodes or coordinates, plus its inner sep; it can carry a label like any node. Drawn last, it would cover the nodes, so put it in a scope with on background layer from the backgrounds library, which draws the scope’s contents behind everything else. backgrounds also offers framed (a rectangle around the whole picture) and show background rectangle.
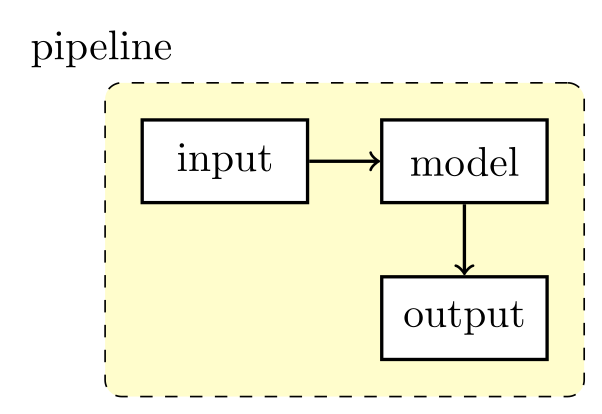
\usepackage{tikz} \usetikzlibrary{fit, backgrounds, positioning}\begin{tikzpicture}[node distance=6mm, box/.style={draw, thick, fill=white, minimum width=14mm, minimum height=7mm}]
\node[box] (a) {input};
\node[box, right=of a] (b) {model};
\node[box, below=of b] (c) {output};
\draw[->, thick] (a) -- (b);
\draw[->, thick] (b) -- (c);
% fit: a node around the others; backgrounds: drawn behind them
\begin{scope}[on background layer]
\node[fit=(a) (b) (c), draw, dashed, rounded corners, fill=yellow!20, inner sep=3mm,
label=above left:pipeline] {};
\end{scope}
\end{tikzpicture}Full document
\documentclass[border=4pt]{standalone}
\usepackage{tikz}
\usetikzlibrary{fit, backgrounds, positioning}
\begin{document}
\begin{tikzpicture}[node distance=6mm, box/.style={draw, thick, fill=white, minimum width=14mm, minimum height=7mm}]
  \node[box] (a) {input};
  \node[box, right=of a] (b) {model};
  \node[box, below=of b] (c) {output};
  \draw[->, thick] (a) -- (b);
  \draw[->, thick] (b) -- (c);
  % fit: a node around the others; backgrounds: drawn behind them
  \begin{scope}[on background layer]
    \node[fit=(a) (b) (c), draw, dashed, rounded corners, fill=yellow!20, inner sep=3mm,
          label=above left:pipeline] {};
  \end{scope}
\end{tikzpicture}
\end{document}matrix: tables and grids of nodes
The plain \matrix needs a node command in every cell. With the matrix library, matrix of nodes makes every cell a node automatically, named (m-row-column) after the matrix name, so (m-3-3) is row 3, column 3. row 1/.style and column 2/.style style whole rows and columns, and column sep and row sep set the spacing (negative \pgflinewidth makes borders overlap into one grid). matrix of math nodes puts every cell in math mode. Inside another command’s argument, & fails; use ampersand replacement=\& and write \& between cells.
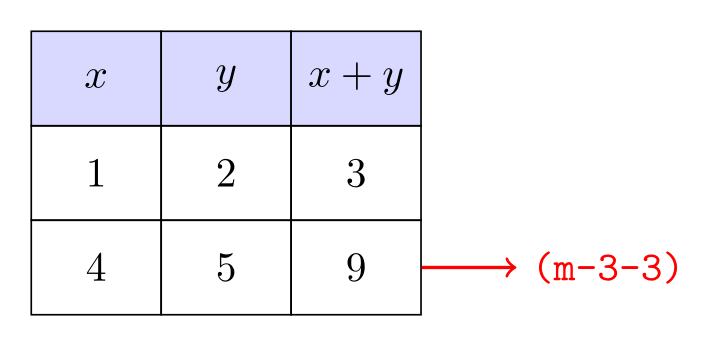
\usepackage{tikz} \usetikzlibrary{matrix}\begin{tikzpicture}
\matrix (m) [matrix of nodes, nodes={draw, minimum width=11mm, minimum height=8mm, anchor=center},
column sep=-\pgflinewidth, row sep=-\pgflinewidth,
row 1/.style={nodes={fill=blue!15, font=\bfseries}}] {
$x$ & $y$ & $x+y$ \\
1 & 2 & 3 \\
4 & 5 & 9 \\
};
\draw[->, thick, red] (m-3-3.east) -- ++(0.8,0) node[right] {\texttt{(m-3-3)}};
\end{tikzpicture}Full document
\documentclass[border=4pt]{standalone}
\usepackage{tikz}
\usetikzlibrary{matrix}
\begin{document}
\begin{tikzpicture}
  \matrix (m) [matrix of nodes, nodes={draw, minimum width=11mm, minimum height=8mm, anchor=center},
               column sep=-\pgflinewidth, row sep=-\pgflinewidth,
               row 1/.style={nodes={fill=blue!15, font=\bfseries}}] {
    $x$ & $y$ & $x+y$ \\
    1   & 2   & 3     \\
    4   & 5   & 9     \\
  };
  \draw[->, thick, red] (m-3-3.east) -- ++(0.8,0) node[right] {\texttt{(m-3-3)}};
\end{tikzpicture}
\end{document}trees and mindmap
Trees with child are part of TikZ itself; the trees library adds other growth functions, such as grow cyclic (children around the parent, sibling angle apart) and grow via three points, and fork-shaped edges (edge from parent fork down). The mindmap library builds on this: the mindmap style, concept nodes that shrink with each level, and concept color, which also shades the connecting bars between levels. Loading mindmap was enough for grow cyclic in our test.
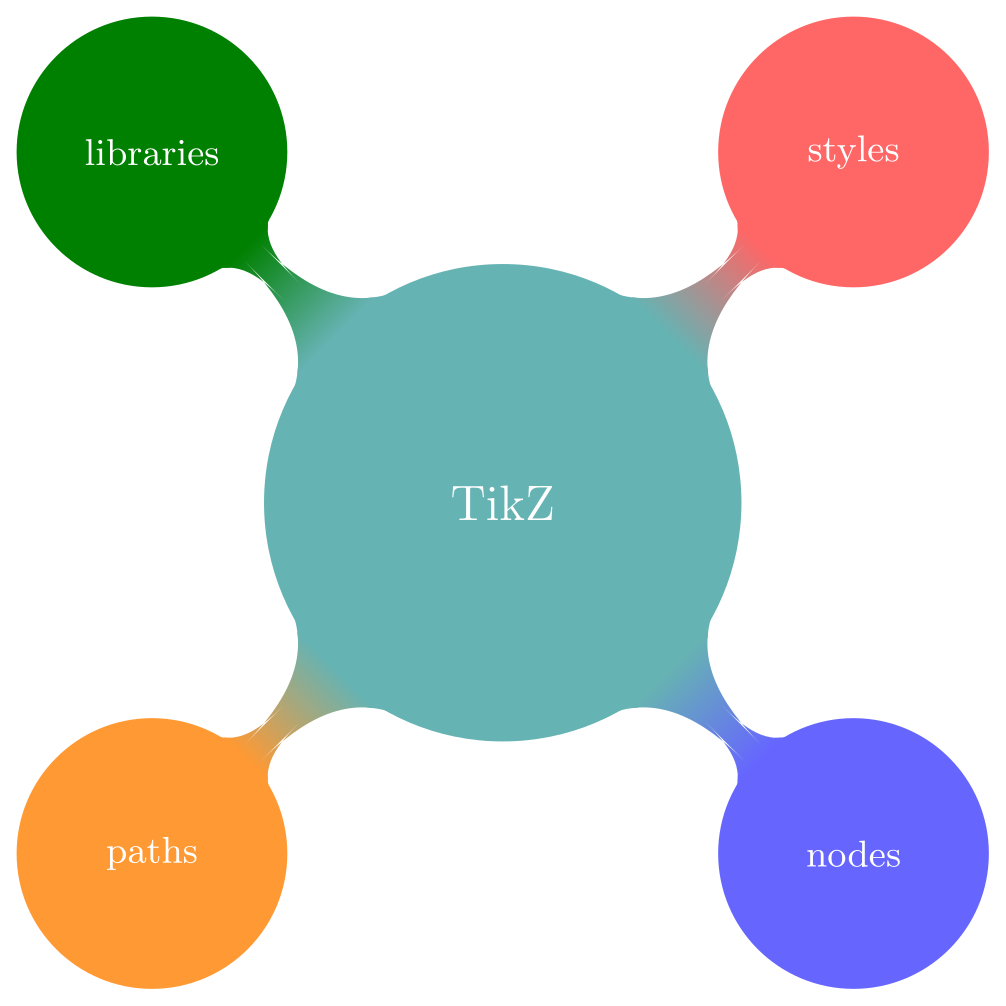
\usepackage{tikz} \usetikzlibrary{mindmap}\begin{tikzpicture}[mindmap, grow cyclic, every node/.style=concept,
concept color=teal!60, text=white,
level 1/.append style={level distance=42mm, sibling angle=90}]
\node {TikZ}
child[concept color=orange!80] {node {paths}}
child[concept color=blue!60] {node {nodes}}
child[concept color=red!60] {node {styles}}
child[concept color=green!50!black] {node {libraries}};
\end{tikzpicture}Full document
\documentclass[border=4pt]{standalone}
\usepackage{tikz}
\usetikzlibrary{mindmap}
\begin{document}
\begin{tikzpicture}[mindmap, grow cyclic, every node/.style=concept,
                    concept color=teal!60, text=white,
                    level 1/.append style={level distance=42mm, sibling angle=90}]
  \node {TikZ}
    child[concept color=orange!80] {node {paths}}
    child[concept color=blue!60]   {node {nodes}}
    child[concept color=red!60]    {node {styles}}
    child[concept color=green!50!black] {node {libraries}};
\end{tikzpicture}
\end{document}angles and quotes: angle marks and short labels
angles defines the pics angle = A--B--C (the angle at B, counter-clockwise from BA to BC) and right angle = A--B--C; angle radius sets the arc size and angle eccentricity how far out the label sits. quotes lets you write a label as "text" in the options of edges, to paths, nodes (as a label) and pics. On edges and to paths the label goes beside the line, on its left; an apostrophe after the closing quote, "text"', puts it on the other side.
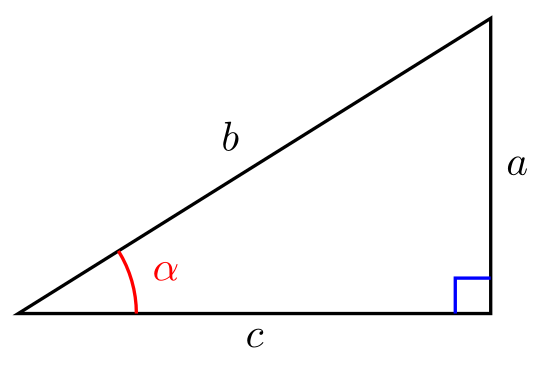
\usepackage{tikz} \usetikzlibrary{angles, quotes}\begin{tikzpicture}[thick]
\coordinate (A) at (4,0);
\coordinate (B) at (0,0);
\coordinate (C) at (4,2.5);
% quotes: "text" on a to-path puts a label beside it, ' moves it to the other side
\draw (B) to["$c$"'] (A) to["$a$"'] (C) to["$b$"'] cycle;
% angles: the angle at B from BA to BC, labelled with the quotes syntax
\pic[draw, red, "$\alpha$", angle radius=10mm, angle eccentricity=1.3] {angle = A--B--C};
\pic[draw, blue, angle radius=3mm] {right angle = C--A--B};
\end{tikzpicture}Full document
\documentclass[border=4pt]{standalone}
\usepackage{tikz}
\usetikzlibrary{angles, quotes}
\begin{document}
\begin{tikzpicture}[thick]
  \coordinate (A) at (4,0);
  \coordinate (B) at (0,0);
  \coordinate (C) at (4,2.5);
  % quotes: "text" on a to-path puts a label beside it, ' moves it to the other side
  \draw (B) to["$c$"'] (A) to["$a$"'] (C) to["$b$"'] cycle;
  % angles: the angle at B from BA to BC, labelled with the quotes syntax
  \pic[draw, red, "$\alpha$", angle radius=10mm, angle eccentricity=1.3] {angle = A--B--C};
  \pic[draw, blue, angle radius=3mm] {right angle = C--A--B};
\end{tikzpicture}
\end{document}graphs and graphdrawing
The graphs library adds \graph, which describes nodes and edges in a compact syntax: a -> b -> {c, d} -> e joins a to b, b to both c and d, and both to e. By default the nodes are placed on a grid, chains along one direction and groups across (the manual calls this Cartesian placement); grow right sep and branch down set the directions and spacing. Edge options go in brackets after the arrow, ->["skip", bend left=45].
graphdrawing computes layouts automatically with algorithms written in Lua, so it requires LuaLaTeX. After loading it, load the algorithms with \usegdlibrary{trees} (or layered, force, circular…) and add a layout to the graph: tree layout, layered layout, spring layout. The example below is compiled with LuaLaTeX.
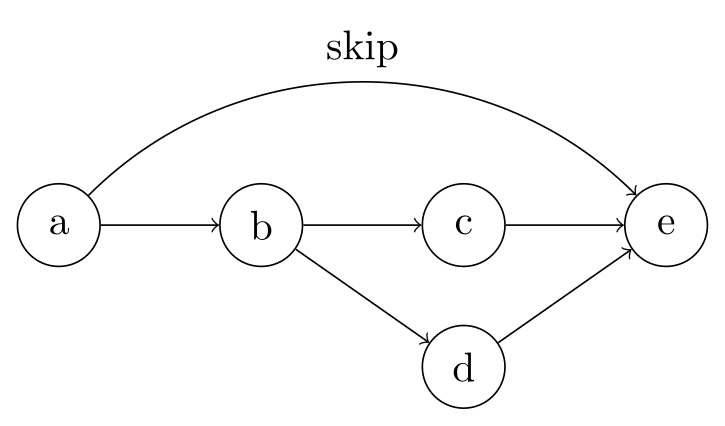
\usepackage{tikz} \usetikzlibrary{graphs, quotes}\begin{tikzpicture}
\graph[grow right sep=10mm, branch down=12mm, nodes={draw, circle, minimum size=7mm}] {
a -> b -> {c, d} -> e,
a ->["skip", bend left=45] e
};
\end{tikzpicture}Full document
\documentclass[border=4pt]{standalone}
\usepackage{tikz}
\usetikzlibrary{graphs, quotes}
\begin{document}
\begin{tikzpicture}
  \graph[grow right sep=10mm, branch down=12mm, nodes={draw, circle, minimum size=7mm}] {
    a -> b -> {c, d} -> e,
    a ->["skip", bend left=45] e
  };
\end{tikzpicture}
\end{document}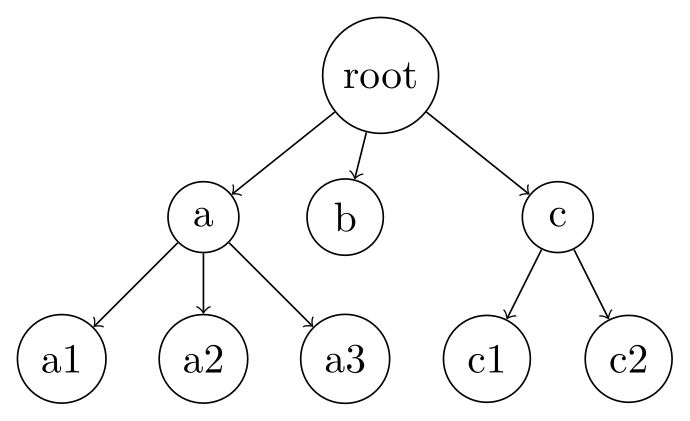
\usepackage{tikz} \usetikzlibrary{graphs, graphdrawing} \usegdlibrary{trees}Compile with LuaLaTeX\begin{tikzpicture}
\graph[tree layout, level distance=12mm, sibling distance=12mm,
nodes={draw, circle, minimum size=6mm}] {
root -> {a -> {a1, a2, a3}, b, c -> {c1, c2}}
};
\end{tikzpicture}Full document
\documentclass[border=4pt]{standalone}
\usepackage{tikz}
\usetikzlibrary{graphs, graphdrawing}
\usegdlibrary{trees}
\begin{document}
\begin{tikzpicture}
  \graph[tree layout, level distance=12mm, sibling distance=12mm,
         nodes={draw, circle, minimum size=6mm}] {
    root -> {a -> {a1, a2, a3}, b, c -> {c1, c2}}
  };
\end{tikzpicture}
\end{document}automata and spy
automata provides state nodes with initial and accepting styles for finite-state machines; loops are drawn with edge[loop above]. spy magnifies a part of a picture: spy using outlines={circle, magnification=4, size=25mm, connect spies} on the picture, then \spy on (point) in node at (position);. The magnified copy is a scaled copy of the drawing, so lines get thicker, as in the inset below.
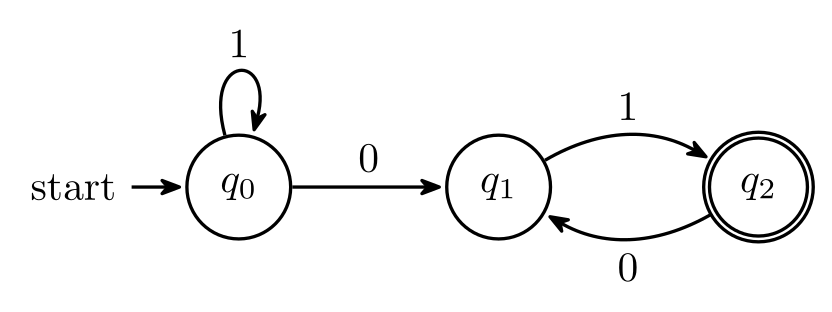
\usepackage{tikz} \usetikzlibrary{automata, positioning, arrows.meta}\begin{tikzpicture}[shorten >=1pt, node distance=22mm, on grid, auto, >={Stealth[round]}, thick]
\node[state, initial] (q0) {$q_0$};
\node[state] (q1) [right=of q0] {$q_1$};
\node[state, accepting] (q2) [right=of q1] {$q_2$};
\path[->] (q0) edge node {0} (q1)
edge [loop above] node {1} ()
(q1) edge [bend left] node {1} (q2)
(q2) edge [bend left] node {0} (q1);
\end{tikzpicture}Full document
\documentclass[border=4pt]{standalone}
\usepackage{tikz}
\usetikzlibrary{automata, positioning, arrows.meta}
\begin{document}
\begin{tikzpicture}[shorten >=1pt, node distance=22mm, on grid, auto, >={Stealth[round]}, thick]
  \node[state, initial]   (q0) {$q_0$};
  \node[state]            (q1) [right=of q0] {$q_1$};
  \node[state, accepting] (q2) [right=of q1] {$q_2$};
  \path[->] (q0) edge node {0} (q1)
                 edge [loop above] node {1} ()
            (q1) edge [bend left] node {1} (q2)
            (q2) edge [bend left] node {0} (q1);
\end{tikzpicture}
\end{document}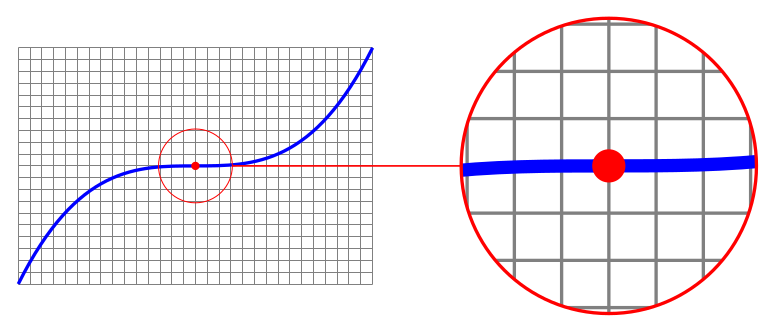
\usepackage{tikz} \usetikzlibrary{spy}\begin{tikzpicture}[spy using outlines={circle, magnification=4, size=25mm, connect spies}]
\draw[help lines, step=0.1] (0,0) grid (3,2);
\draw[thick, blue] (0,0) .. controls (1,2) and (2,0) .. (3,2);
\fill[red] (1.5,1) circle (1pt);
\spy[red] on (1.5,1) in node at (5,1);
\end{tikzpicture}Full document
\documentclass[border=4pt]{standalone}
\usepackage{tikz}
\usetikzlibrary{spy}
\begin{document}
\begin{tikzpicture}[spy using outlines={circle, magnification=4, size=25mm, connect spies}]
  \draw[help lines, step=0.1] (0,0) grid (3,2);
  \draw[thick, blue] (0,0) .. controls (1,2) and (2,0) .. (3,2);
  \fill[red] (1.5,1) circle (1pt);
  \spy[red] on (1.5,1) in node at (5,1);
\end{tikzpicture}
\end{document}Load order and conflicts
- After tikz, in the preamble.
\usetikzlibraryis defined by TikZ, so it must follow\usepackage{tikz}. The order among libraries does not matter for the common ones. - positioning changes above, below, left, right. The manual notes that with the library loaded these options behave differently: they accept
ofand measure between borders. Plain values likeabove=2ptkeep working. - Load sub-libraries, not umbrellas. Prefer
shapes.geometrictoshapes, andarrows.metato the deprecatedarrows. - babel. Some babel languages make characters such as
<,>or"active, which breaks TikZ syntax. In our tests with TeX Live 2026,\usepackage[spanish]{babel}with\draw[<->]stopped with Argument of \language@active@arg> has an extra }., andngermanwith the quotes syntaxto["a"]stopped with Argument of \language@active@arg" has an extra }. Both compiled after adding\usetikzlibrary{babel}, which resets the character codes inside pictures. French and Turkish did not break our test pictures. The library is harmless to load whenever you use babel. - external must be activated in the preamble.
\tikzexternalizehas to come before\begin{document}(next section).
The external library: faster compiles (needs shell escape)
Large pictures, pgfplots with many points especially, are typeset again on every run. The external library saves each tikzpicture as its own PDF and, on later runs, includes that PDF instead of recomputing the picture; a picture is remade only when its code changes (it compares an MD5 checksum by default). Activate it in the preamble:
\usetikzlibrary{external}
\tikzexternalize[prefix=figures/]   % before \begin{document}
To make the missing PDFs, the library starts a separate LaTeX run for each picture from inside your document, which TeX only allows with shell escape: compile with pdflatex -shell-escape main.tex (TeX Live; for MiKTeX the manual gives \tikzexternalize[shell escape=-enable-write18]). Without it, the run stops with:
Package tikz Error: Sorry, the system call 'pdflatex -halt-on-error -interaction=batchmode -jobname "main-figure0" "\def\tikzexternalrealjob{main}\input{main}"' did NOT result in a usable output file 'main-figure0' (expected one of .pdf:.jpg:.jpeg:.png:). Please verify that you have enabled system calls. For pdflatex, this is 'pdflatex -shell-escape'.
Shell escape lets a document run programs on your computer, so only enable it for documents you trust. If you cannot or do not want to, \tikzexternalize[mode=list and make] writes a makefile instead and you run make yourself; the manual notes this mode works without shell escape. Other useful commands: \tikzsetnextfilename{name} names the next picture’s file, \tikzexternaldisable and \tikzexternalenable switch it off and on around pictures that should not be externalised. Online compilers and renderers that run without shell escape, including the LabCanvas TikZ renderer, cannot use this library.
Packages built on TikZ
Several popular tools are separate packages rather than TikZ libraries, so they are loaded with \usepackage and have their own manuals: pgfplots for function and data plots (with \pgfplotsset{compat=1.18} and its own \usepgfplotslibrary), tikz-cd for commutative diagrams, circuitikz for electrical circuits, and others such as forest (trees) and tkz-euclide (geometry). They load TikZ themselves, and you can still add TikZ libraries next to them.
Common errors and how to fix them
| LaTeX says (or you see) | Cause and fix |
|---|---|
| Package pgfkeys Error: I do not know the key '/tikz/diamond' and I am going to ignore it. Perhaps you misspelled it. | The shape comes from a library: add \usetikzlibrary{shapes.geometric}. The same message for other keys usually means another missing library or a typo. |
| Package PGF Math Error: Unknown function `of' (in 'of a'). | right=of a needs \usetikzlibrary{positioning}. |
| Package pgf Error: Unknown arrow tip kind 'Stealth'. | Add \usetikzlibrary{arrows.meta}. |
| Package tikz Error: You need to say \usetikzlibrary{patterns}. | Add the library, as the message says. |
| Package tikz Error: I did not find the tikz library 'positionning'. | A misspelt library name: check the spelling (positioning). |
| Undefined control sequence. (at \usetikzlibrary) | The library line comes before \usepackage{tikz}: move it after. |
| Package tikz Error: Sorry, the system call 'pdflatex …' did NOT result in a usable output file | The external library needs shell escape: compile with pdflatex -shell-escape, use mode=list and make, or remove \tikzexternalize. |
Frequently asked questions
How do I load a TikZ library?
Write \usetikzlibrary{name} in the preamble after \usepackage{tikz}, for example \usetikzlibrary{positioning, arrows.meta, calc}. Several names go in one command, separated by commas, and the command can be repeated.
Which TikZ libraries should I load by default?
There is no required set. A practical start for diagrams is positioning, arrows.meta, calc and shapes.geometric, plus fit and backgrounds for frames and decorations.pathreplacing for braces. Loading an unused library costs little compile time, and loading one twice is harmless.
Why do I get "I do not know the key" for a TikZ option?
Either the option is misspelt or it comes from a library you have not loaded: diamond and ellipse (node shapes) need shapes.geometric, name path needs intersections, pattern needs patterns. The message names the key, which tells you what to look up.
How do I make TikZ compile faster?
Externalise the pictures with \usetikzlibrary{external} and \tikzexternalize in the preamble, and compile with -shell-escape: each picture becomes a PDF that is reused until its code changes. Reducing samples in pgfplots and avoiding very long decorated paths also helps.
Does the external library work without shell escape?
Not in its default mode, which runs LaTeX for each picture from inside your document. With mode=list and make it writes a makefile instead, which you run yourself, and that works without shell escape.
Is graphdrawing available with pdfLaTeX?
No. The graph drawing algorithms are written in Lua and the manual states that the library requires LuaTeX, so compile with LuaLaTeX. The plain graphs library (the \graph syntax without automatic layouts) works with every engine.
References
- PGF/TikZ manual, §12.1 Loading the Package and the Librariestikz.dev
- PGF/TikZ manual, Part V Libraries (§40–§78, one chapter per library)tikz.dev
- PGF/TikZ manual, §17.5.3 Advanced Placement Options (positioning)tikz.dev
- PGF/TikZ manual, §16.5 Reference: Arrow Tips (arrows.meta)tikz.dev
- PGF/TikZ manual, §71 Shape Librarytikz.dev
- PGF/TikZ manual, §50 Decoration Librarytikz.dev
- PGF/TikZ manual, §62 Pattern Librarytikz.dev
- PGF/TikZ manual, §28 Using Graph Drawing in TikZtikz.dev
- PGF/TikZ manual, §52 Externalization Librarytikz.dev
- PGF/TikZ manual, §44 Babel Librarytikz.dev
- pgf-blur (shadows.blur) on CTANctan.org
- pgf package (TikZ) on CTAN, with the full manual as PDFctan.org
The facts on this page were checked against these sources, and every picture is the code with it typeset with TeX Live 2026. Code on this page: CC0 1.0, copy it freely.
Try the code in your browserEvery snippet on this page opens in the free TikZ editor: it is typeset with TeX Live as you type, with errors pointed at their line.
Open the TikZ editor