TikZ cheat sheet
Quick answer
\draw (0,0) -- (2,1); draws, \fill fills, \node[draw] at (1,1) {text}; places text, every path ends with a semicolon, and options in square brackets (thick, dashed, red, ->) change the look. Plain numbers are centimetres. The blocks below cover paths, shapes, nodes and anchors, positioning, arrows, line styles, colours, coordinates, \foreach and styles, each with a rendered example; the same reference is available as two printable A4 pages.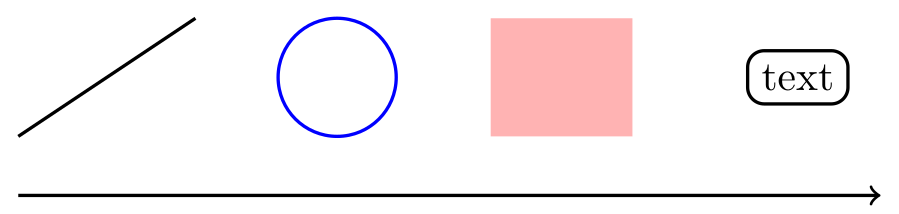
\usepackage{tikz}\begin{tikzpicture}[thick]
\draw (0,0) -- (1.5,1); % a line
\draw[blue] (2.7,0.5) circle (0.5); % a circle
\fill[red!30] (4,0) rectangle (5.2,1); % a filled rectangle
\node[draw, rounded corners] at (6.6,0.5) {text}; % a node
\draw[->] (0,-0.5) -- (7.3,-0.5); % an arrow
\end{tikzpicture}Full document
\documentclass[border=4pt]{standalone}
\usepackage{tikz}
\begin{document}
\begin{tikzpicture}[thick]
  \draw (0,0) -- (1.5,1);                          % a line
  \draw[blue] (2.7,0.5) circle (0.5);              % a circle
  \fill[red!30] (4,0) rectangle (5.2,1);           % a filled rectangle
  \node[draw, rounded corners] at (6.6,0.5) {text}; % a node
  \draw[->] (0,-0.5) -- (7.3,-0.5);                % an arrow
\end{tikzpicture}
\end{document}Contents
Printable TikZ cheat sheet (two A4 pages)
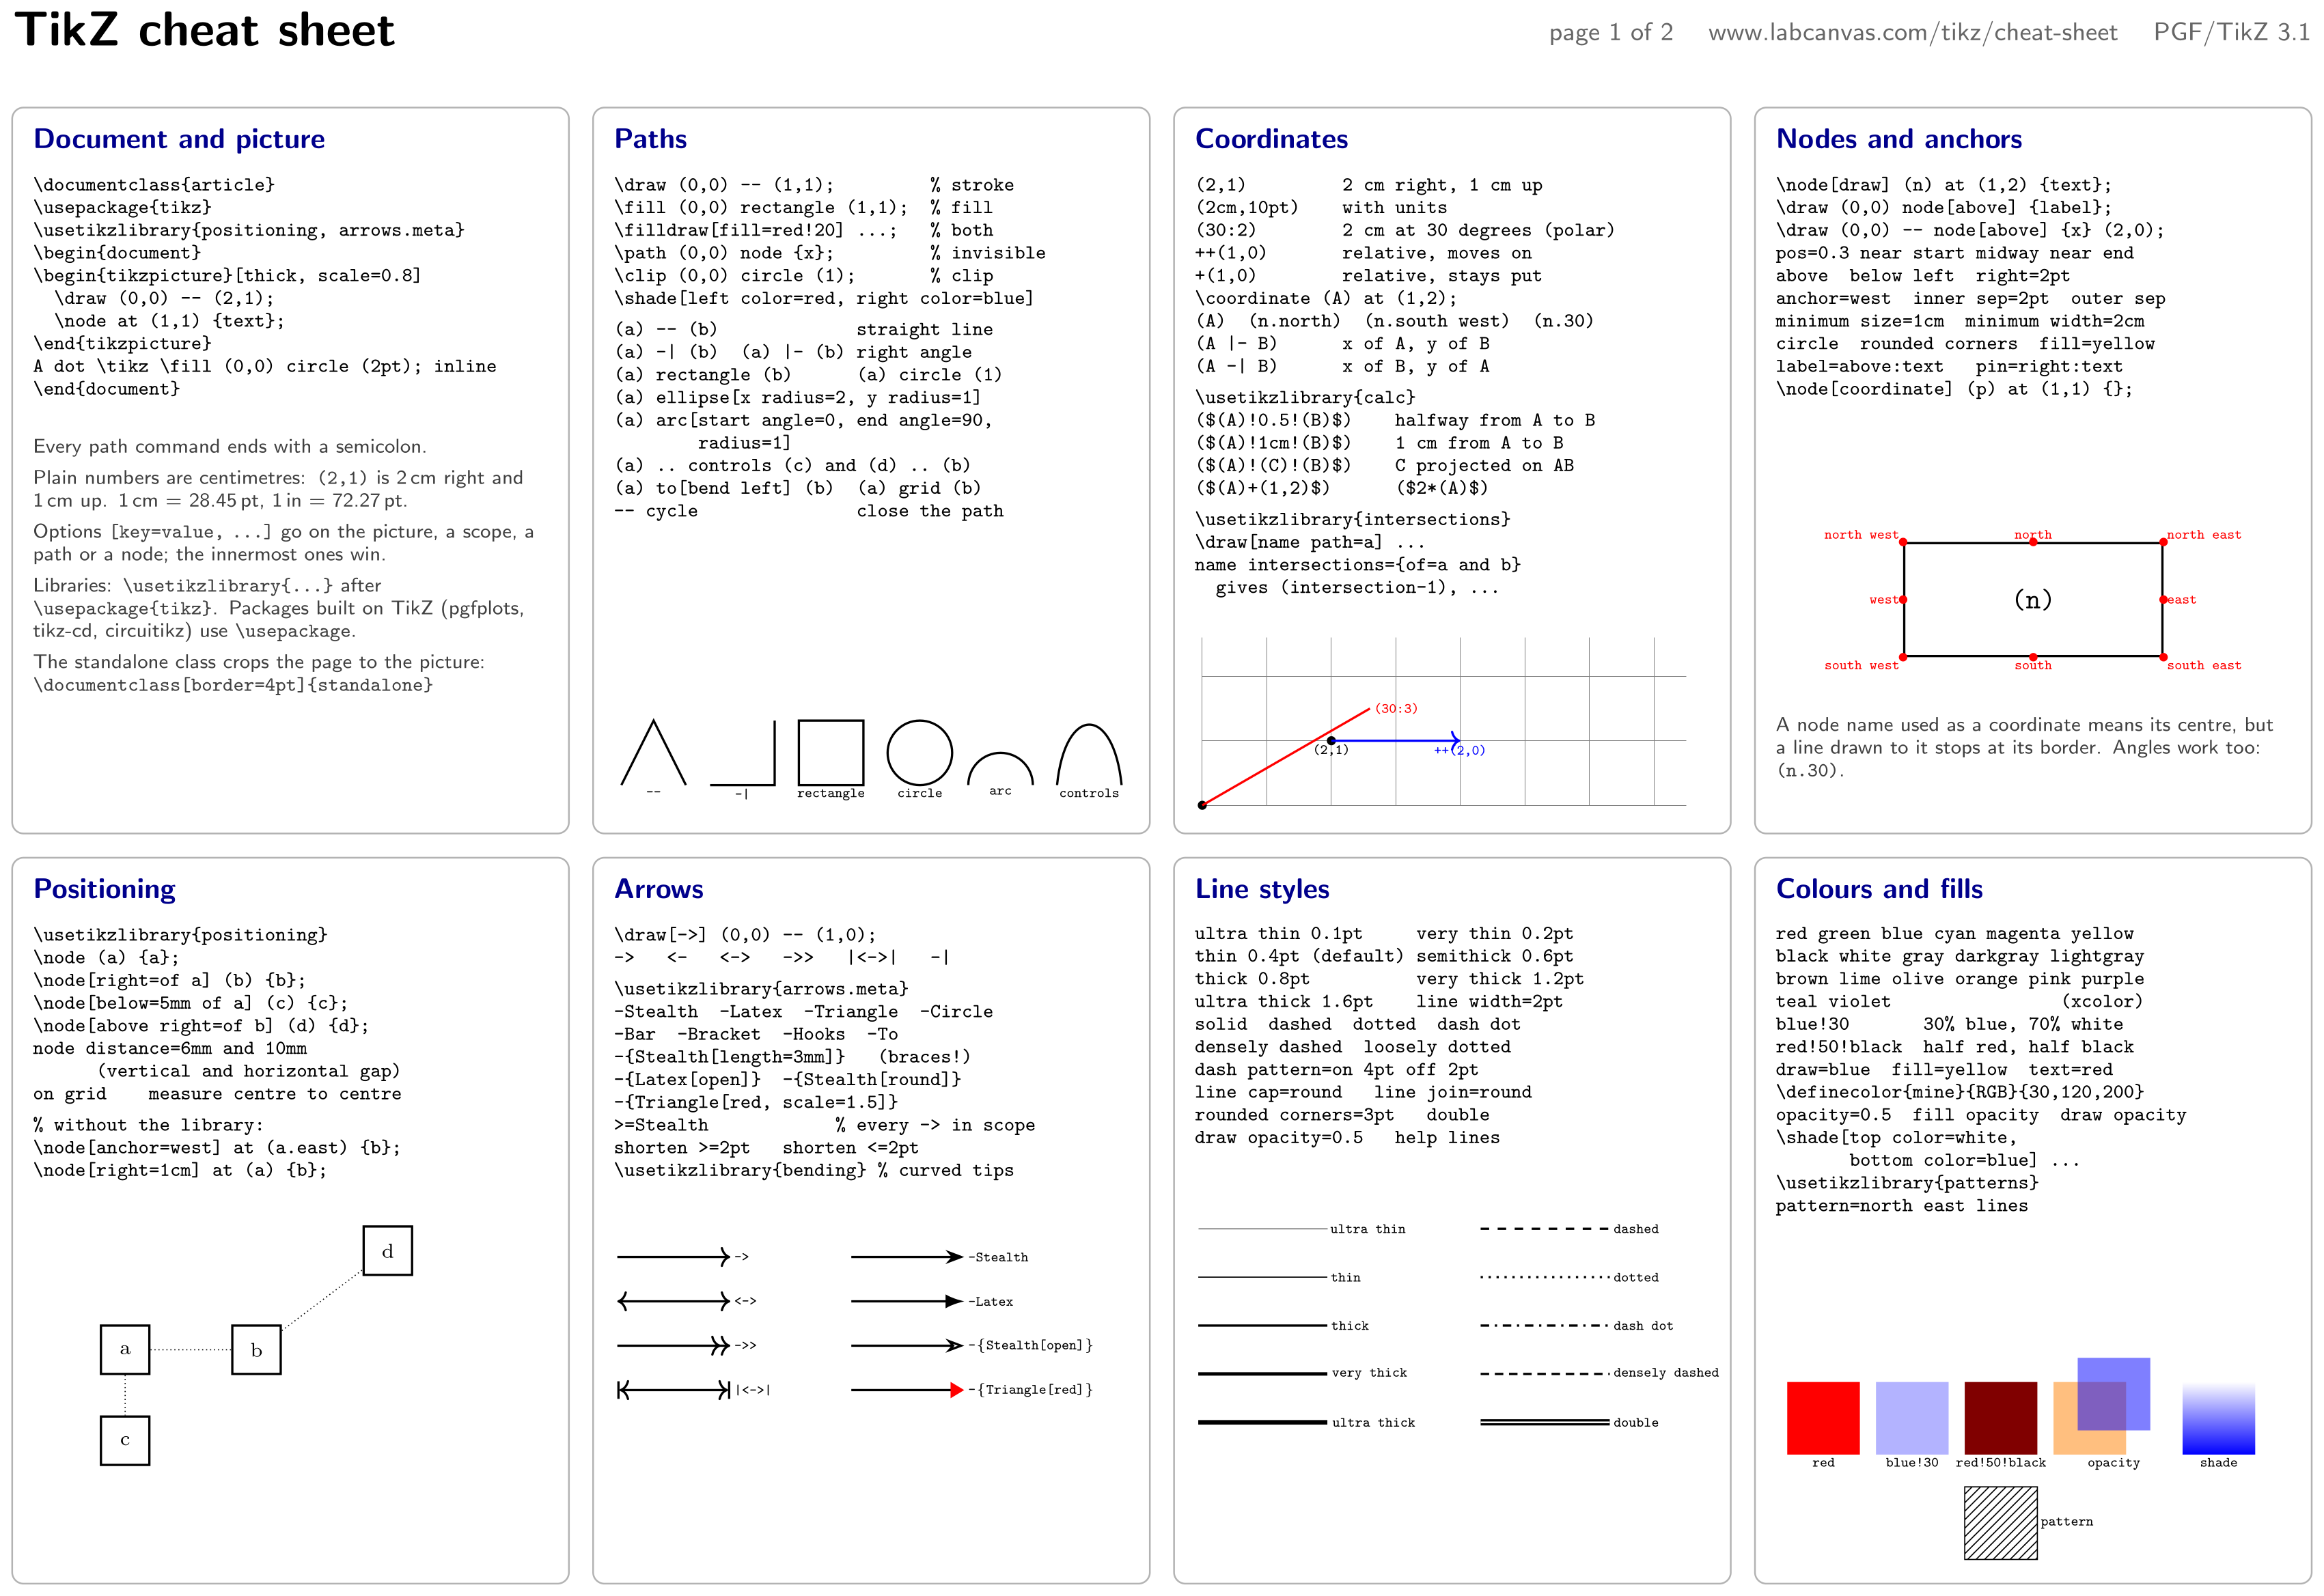
The whole reference as two landscape A4 pages, rendered from the TikZ code below with TeX Live: page 1 covers the document setup, paths, coordinates, nodes and anchors, positioning, arrows, line styles and colours; page 2 covers node shapes, text in nodes, \foreach, styles, scopes and transformations, curves and decorations, plots and grids, and the most common errors.
- Page 1 as PNG (3508 × 2480 px, 300 dpi, 0.9 MB)
- Page 2 as PNG (3508 × 2480 px, 300 dpi, 0.9 MB)
- Both pages as one PDF for printing (1.5 MB; the pages are the same two pictures, so the text cannot be selected or searched)
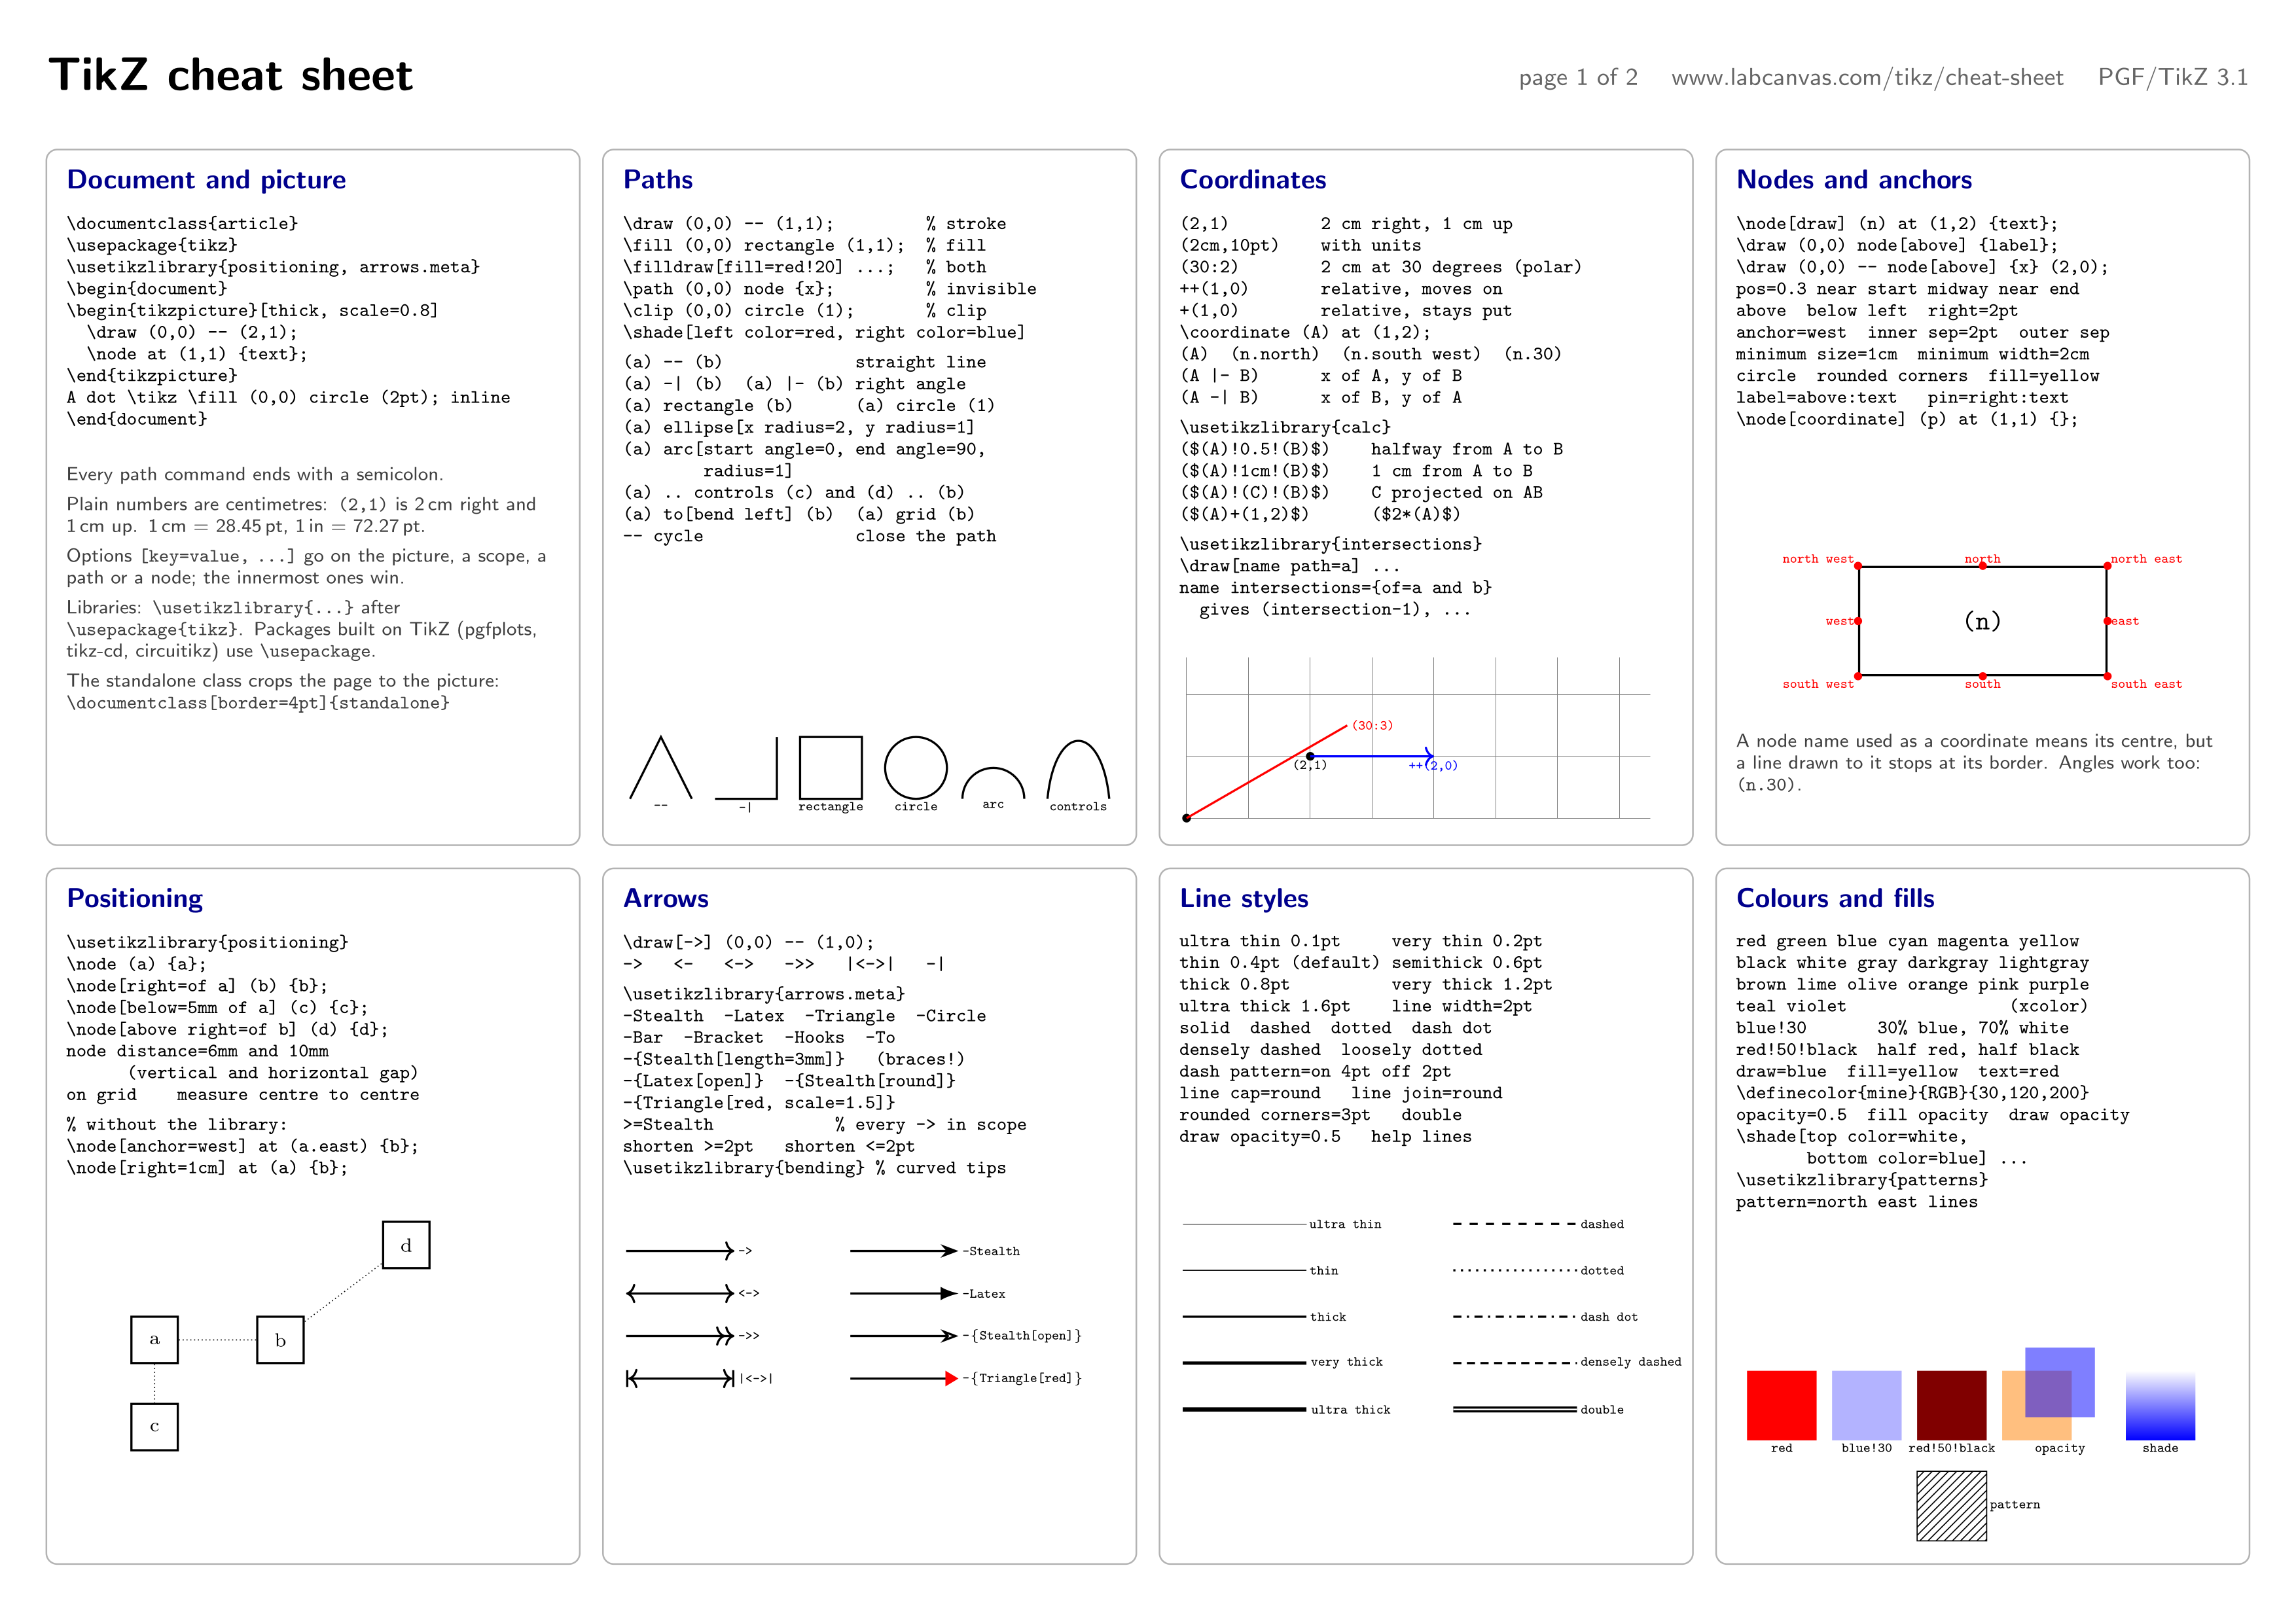
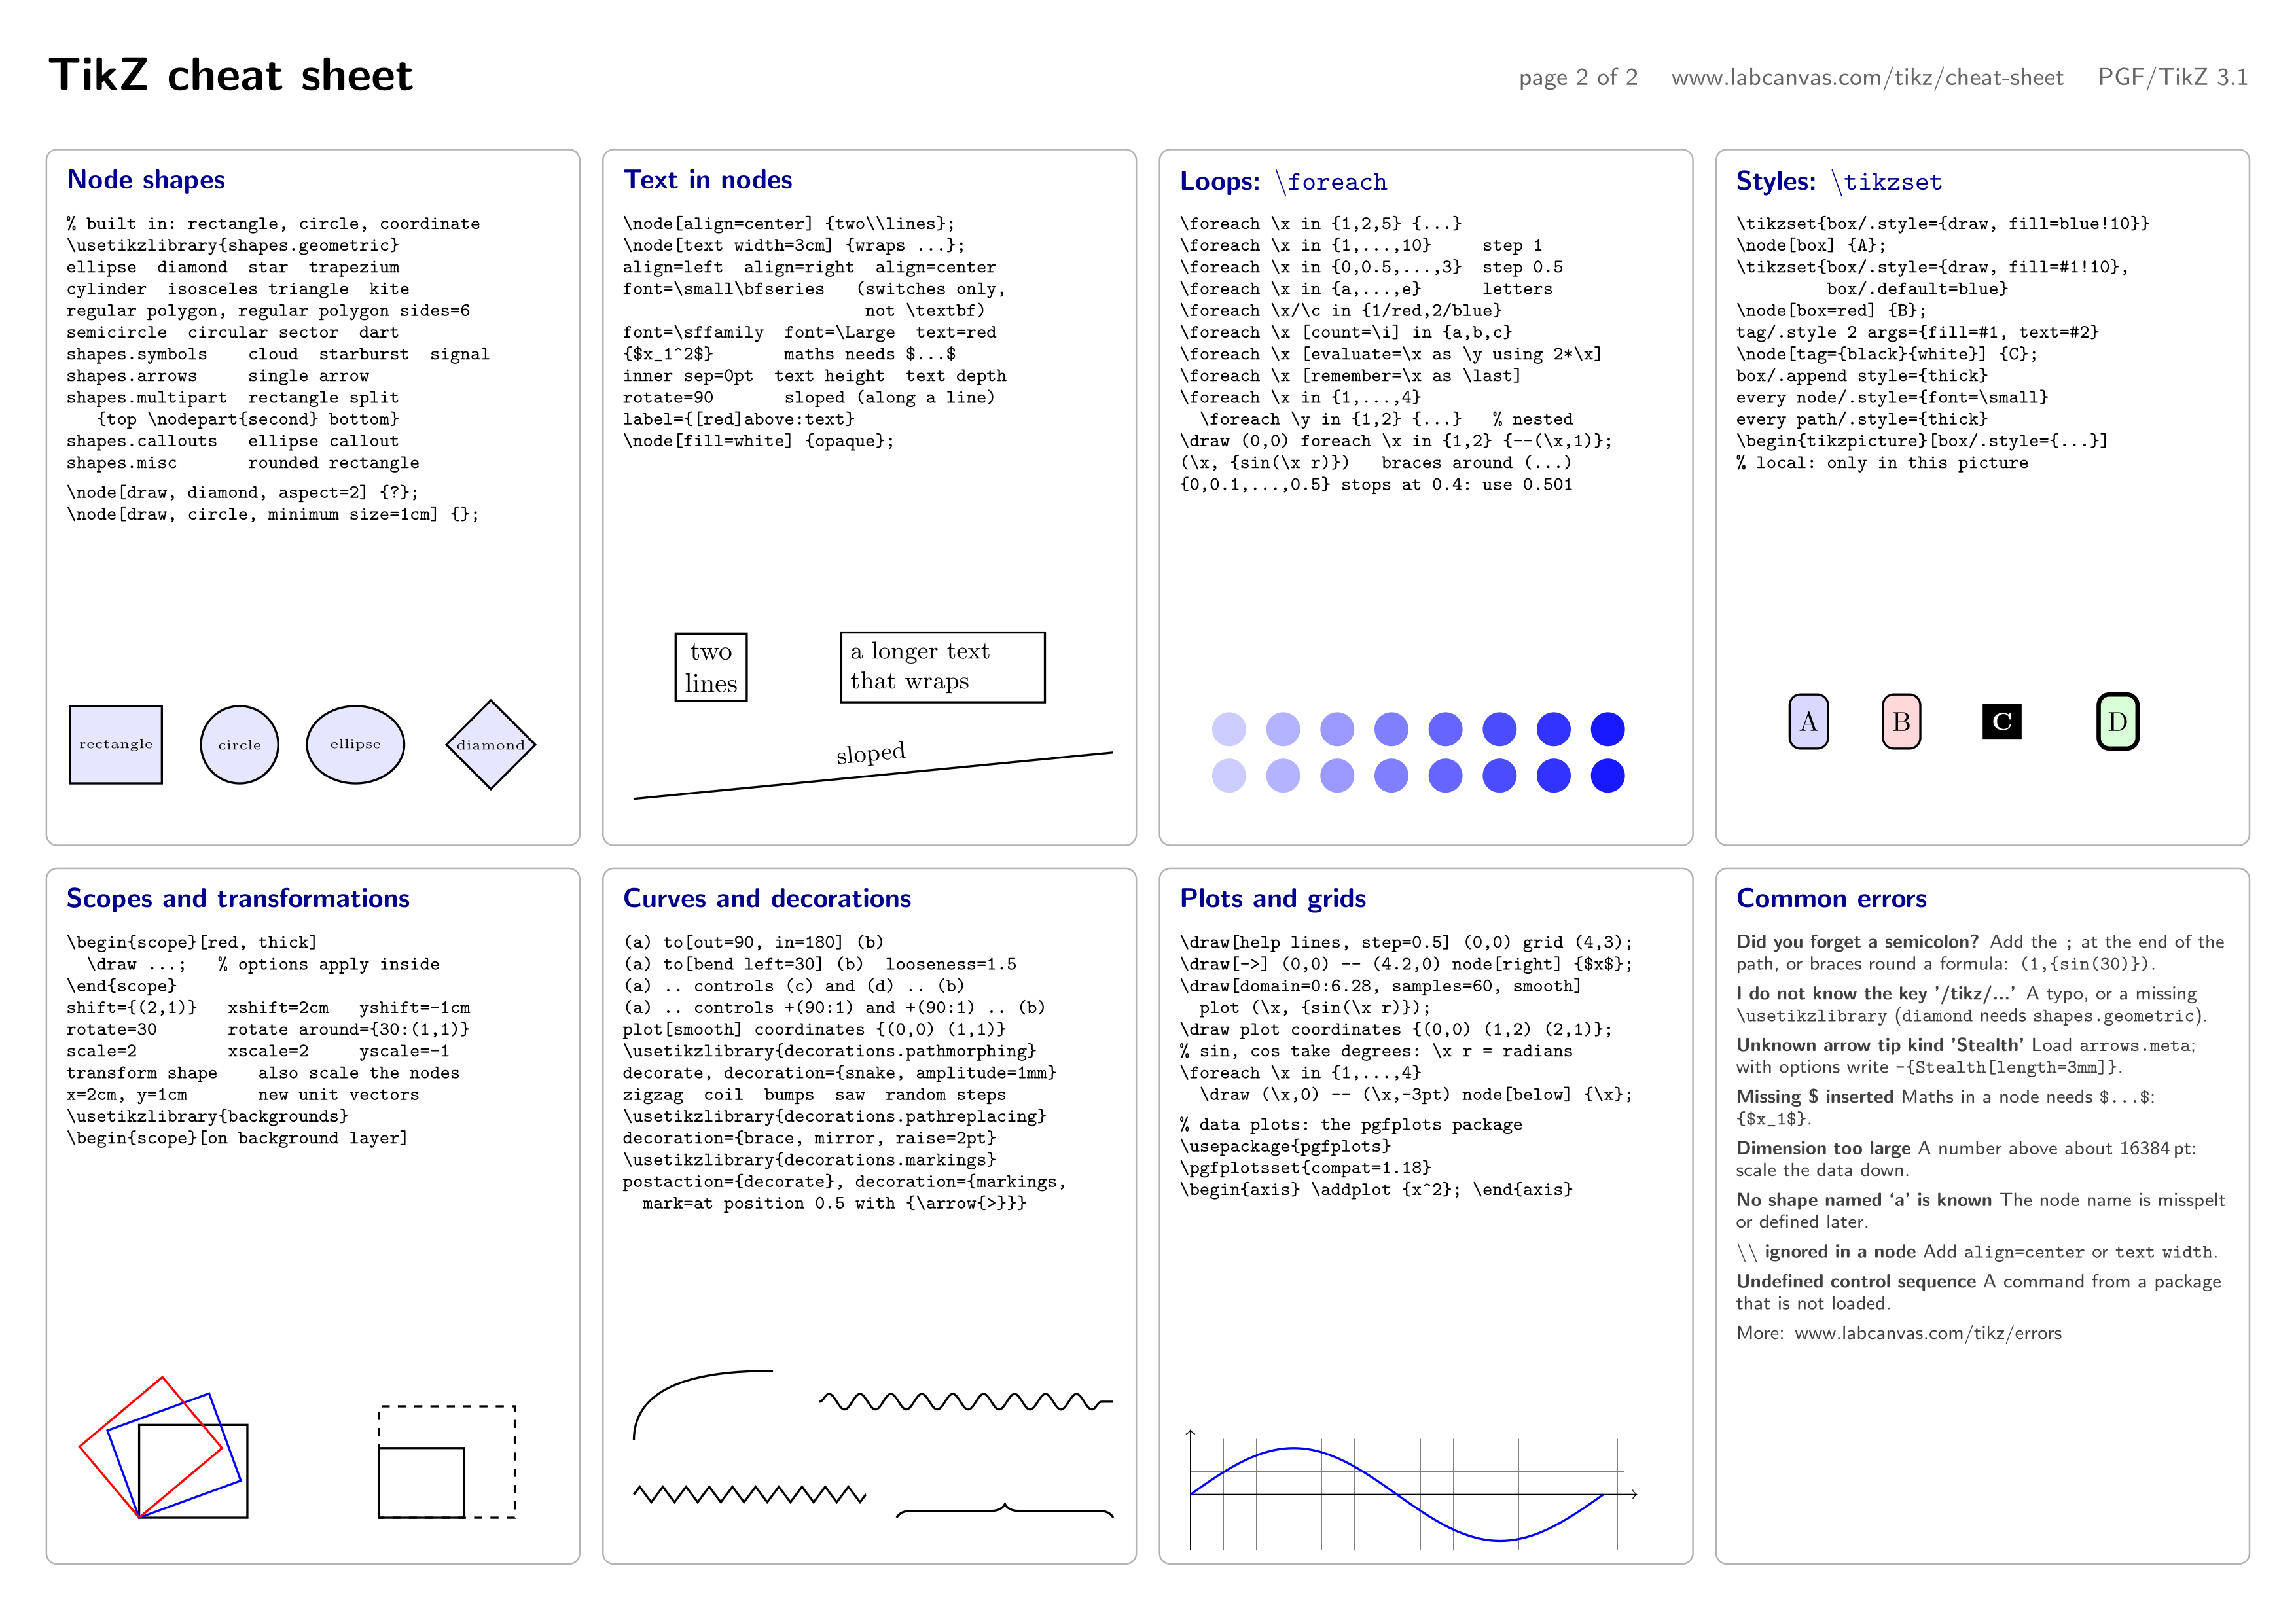
Print at 100% (actual size) on A4 landscape. The code of each sheet is a single tikzpicture and compiles on its own; it uses \verb inside nodes to show code, which works in a normal document but not when the picture is inside another command’s argument (for example a beamer frame without [fragile]).
\usepackage{tikz} \usetikzlibrary{positioning, arrows.meta, patterns}\begin{tikzpicture}[
blk/.style={draw=black!30, rounded corners=4pt, line width=0.6pt},
ttl/.style={anchor=north west, inner sep=0pt, font=\sffamily\bfseries, text=blue!55!black},
code/.style={anchor=north west, inner sep=0pt, align=left, font=\scriptsize},
note/.style={anchor=north west, inner sep=0pt, align=left, text width=6.4cm,
font=\sffamily\scriptsize, text=black!75},
lbl/.style={font=\tiny\ttfamily, inner sep=1pt}]
% A4 landscape: 28.5 cm x 19.5 cm of content, 4 x 2 blocks
\node[anchor=north west, inner sep=0pt, font=\sffamily\bfseries\LARGE] at (0,0) {TikZ cheat sheet};
\node[anchor=north east, inner sep=0pt, font=\sffamily\small, text=black!60] at (28.5,-0.12)
{page 1 of 2 \quad www.labcanvas.com/tikz/cheat-sheet \quad PGF/TikZ 3.1};
\foreach \x in {0, 7.2, 14.4, 21.6}
\foreach \y in {-1.2, -10.5}
\draw[blk] (\x,\y) rectangle +(6.9,-9);
% ---------------------------------------------------------------- 1 document
\node[ttl] at (0.25,-1.45) {Document and picture};
\node[code] at (0.25,-2.05) {%
\verb|\|\verb|documentclass{article}|\\
\verb|\usepackage{tikz}|\\
\verb|\usetikzlibrary{positioning, arrows.meta}|\\
\verb|\|\verb|begin{document}|\\
\verb|\begin{tikzpicture}[thick, scale=0.8]|\\
\verb| \draw (0,0) -- (2,1);|\\
\verb| \node at (1,1) {text};|\\
\verb|\end{tikzpicture}|\\
\verb|A dot \tikz \fill (0,0) circle (2pt); inline|\\
\verb|\end{document}|};
\node[note] at (0.25,-5.3) {%
Every path command ends with a semicolon.\\[3pt]
Plain numbers are centimetres: \verb|(2,1)| is 2\,cm right and 1\,cm up. 1\,cm = 28.45\,pt, 1\,in = 72.27\,pt.\\[3pt]
Options \verb|[key=value, ...]| go on the picture, a scope, a path or a node; the innermost ones win.\\[3pt]
Libraries: \verb|\usetikzlibrary{...}| after \verb|\usepackage{tikz}|. Packages built on TikZ (pgfplots, tikz-cd, circuitikz) use \verb|\usepackage|.\\[3pt]
The standalone class crops the page to the picture: \verb|\|\verb|documentclass[border=4pt]{standalone}|};
% ---------------------------------------------------------------- 2 paths
\node[ttl] at (7.45,-1.45) {Paths};
\node[code] at (7.45,-2.05) {%
\verb|\draw (0,0) -- (1,1); % stroke|\\
\verb|\fill (0,0) rectangle (1,1); % fill|\\
\verb|\filldraw[fill=red!20] ...; % both|\\
\verb|\path (0,0) node {x}; % invisible|\\
\verb|\clip (0,0) circle (1); % clip|\\
\verb|\shade[left color=red, right color=blue]|\\[3pt]
\verb|(a) -- (b) straight line|\\
\verb!(a) -| (b) (a) |- (b) right angle!\\
\verb|(a) rectangle (b) (a) circle (1)|\\
\verb|(a) ellipse[x radius=2, y radius=1]|\\
\verb|(a) arc[start angle=0, end angle=90,|\\
\verb| radius=1]|\\
\verb|(a) .. controls (c) and (d) .. (b)|\\
\verb|(a) to[bend left] (b) (a) grid (b)|\\
\verb|-- cycle close the path|};
\begin{scope}[shift={(7.55,-9.6)}, thick]
\draw (0,0) -- (0.4,0.8) -- (0.8,0);
\draw (1.1,0) -| (1.9,0.8);
\draw (2.2,0) rectangle (3,0.8);
\draw (3.7,0.4) circle (0.4);
\draw (5.1,0) arc[start angle=0, end angle=180, radius=0.4];
\draw (5.4,0) .. controls (5.5,1) and (6.1,1) .. (6.2,0);
\end{scope}
\foreach \t/\x in {--/7.95, -|/9.05, rectangle/10.15, circle/11.25, arc/12.25, controls/13.35}
\node[lbl, below] at (\x,-9.6) {\t};
% ---------------------------------------------------------------- 3 coordinates
\node[ttl] at (14.65,-1.45) {Coordinates};
\node[code] at (14.65,-2.05) {%
\verb|(2,1) 2 cm right, 1 cm up|\\
\verb|(2cm,10pt) with units|\\
\verb|(30:2) 2 cm at 30 degrees (polar)|\\
\verb|++(1,0) relative, moves on|\\
\verb|+(1,0) relative, stays put|\\
\verb|\coordinate (A) at (1,2);|\\
\verb|(A) (n.north) (n.south west) (n.30)|\\
\verb!(A |- B) x of A, y of B!\\
\verb!(A -| B) x of B, y of A!\\[3pt]
\verb|\usetikzlibrary{calc}|\\
\verb|($(A)!0.5!(B)$) halfway from A to B|\\
\verb|($(A)!1cm!(B)$) 1 cm from A to B|\\
\verb|($(A)!(C)!(B)$) C projected on AB|\\
\verb|($(A)+(1,2)$) ($2*(A)$)|\\[3pt]
\verb|\usetikzlibrary{intersections}|\\
\verb|\draw[name path=a] ...|\\
\verb|name intersections={of=a and b}|\\
\verb| gives (intersection-1), ...|};
\begin{scope}[shift={(14.75,-9.85)}, scale=0.8]
\draw[help lines] (0,0) grid (7.5,2.6);
\fill (0,0) circle (2pt);
\draw[thick, red] (0,0) -- (30:3) node[lbl, right] {(30:3)};
\fill (2,1) circle (2pt) node[lbl, below] {(2,1)};
\draw[thick, blue, ->] (2,1) -- ++(2,0) node[lbl, below] {++(2,0)};
\end{scope}
% ---------------------------------------------------------------- 4 nodes
\node[ttl] at (21.85,-1.45) {Nodes and anchors};
\node[code] at (21.85,-2.05) {%
\verb|\node[draw] (n) at (1,2) {text};|\\
\verb|\draw (0,0) node[above] {label};|\\
\verb|\draw (0,0) -- node[above] {x} (2,0);|\\
\verb|pos=0.3 near start midway near end|\\
\verb|above below left right=2pt|\\
\verb|anchor=west inner sep=2pt outer sep|\\
\verb|minimum size=1cm minimum width=2cm|\\
\verb|circle rounded corners fill=yellow|\\
\verb|label=above:text pin=right:text|\\
\verb|\node[coordinate] (p) at (1,1) {};|};
\node[draw, thick, minimum width=3.2cm, minimum height=1.4cm] (an) at (25.05,-7.3) {\texttt{(n)}};
\foreach \a/\p in {north/above, south/below, east/right, west/left,
north east/above right, north west/above left,
south east/below right, south west/below left}
\fill[red] (an.\a) circle (1.5pt) node[lbl, \p] {\a};
\node[note, text width=6.4cm] at (21.85,-8.75) {%
A node name used as a coordinate means its centre, but a line drawn to it stops at its border. Angles work too: \verb|(n.30)|.};
% ---------------------------------------------------------------- 5 positioning
\node[ttl] at (0.25,-10.75) {Positioning};
\node[code] at (0.25,-11.35) {%
\verb|\usetikzlibrary{positioning}|\\
\verb|\node (a) {a};|\\
\verb|\node[right=of a] (b) {b};|\\
\verb|\node[below=5mm of a] (c) {c};|\\
\verb|\node[above right=of b] (d) {d};|\\
\verb|node distance=6mm and 10mm|\\
\verb| (vertical and horizontal gap)|\\
\verb|on grid measure centre to centre|\\[3pt]
\verb|% without the library:|\\
\verb|\node[anchor=west] at (a.east) {b};|\\
\verb|\node[right=1cm] at (a) {b};|};
\begin{scope}[node distance=6mm and 10mm, every node/.style={draw, thick, minimum size=6mm, font=\scriptsize}]
\node (pa) at (1.4,-16.6) {a};
\node[right=of pa] (pb) {b};
\node[below=5mm of pa] (pc) {c};
\node[above right=of pb] (pd) {d};
\end{scope}
\draw[densely dotted] (pa) -- (pb) (pa) -- (pc) (pb) -- (pd);
% ---------------------------------------------------------------- 6 arrows
\node[ttl] at (7.45,-10.75) {Arrows};
\node[code] at (7.45,-11.35) {%
\verb|\draw[->] (0,0) -- (1,0);|\\
\verb!-> <- <-> ->> |<->| -|!\\[3pt]
\verb|\usetikzlibrary{arrows.meta}|\\
\verb|-Stealth -Latex -Triangle -Circle|\\
\verb|-Bar -Bracket -Hooks -To|\\
\verb|-{Stealth[length=3mm]} (braces!)|\\
\verb|-{Latex[open]} -{Stealth[round]}|\\
\verb|-{Triangle[red, scale=1.5]}|\\
\verb|>=Stealth % every -> in scope|\\
\verb|shorten >=2pt shorten <=2pt|\\
\verb|\usetikzlibrary{bending} % curved tips|};
\begin{scope}[thick]
\foreach \tip/\t [count=\i] in {->/->, <->/<->, ->>/->>, |<->|/|<->|}
\draw[\tip] (7.5,-14.9-0.55*\i) -- +(1.4,0) node[lbl, right] {\t};
\foreach \tip/\t [count=\i] in {-Stealth/-Stealth, -Latex/-Latex, -{Stealth[open]}/-\{Stealth[open]\}, -{Triangle[red]}/-\{Triangle[red]\}}
\draw[\tip] (10.4,-14.9-0.55*\i) -- +(1.4,0) node[lbl, right] {\t};
\end{scope}
% ---------------------------------------------------------------- 7 line styles
\node[ttl] at (14.65,-10.75) {Line styles};
\node[code] at (14.65,-11.35) {%
\verb|ultra thin 0.1pt very thin 0.2pt|\\
\verb|thin 0.4pt (default) semithick 0.6pt|\\
\verb|thick 0.8pt very thick 1.2pt|\\
\verb|ultra thick 1.6pt line width=2pt|\\
\verb|solid dashed dotted dash dot|\\
\verb|densely dashed loosely dotted|\\
\verb|dash pattern=on 4pt off 2pt|\\
\verb|line cap=round line join=round|\\
\verb|rounded corners=3pt double|\\
\verb|draw opacity=0.5 help lines|};
\foreach \s [count=\i] in {ultra thin, thin, thick, very thick, ultra thick}
\draw[\s] (14.7,-14.5-0.6*\i) -- +(1.6,0) node[lbl, right] {\s};
\foreach \s [count=\i] in {dashed, dotted, dash dot, densely dashed, double}
\draw[thick, \s] (18.2,-14.5-0.6*\i) -- +(1.6,0) node[lbl, right] {\s};
% ---------------------------------------------------------------- 8 colours
\node[ttl] at (21.85,-10.75) {Colours and fills};
\node[code] at (21.85,-11.35) {%
\verb|red green blue cyan magenta yellow|\\
\verb|black white gray darkgray lightgray|\\
\verb|brown lime olive orange pink purple|\\
\verb|teal violet (xcolor)|\\
\verb|blue!30 30% blue, 70% white|\\
\verb|red!50!black half red, half black|\\
\verb|draw=blue fill=yellow text=red|\\
\verb|\definecolor{mine}{RGB}{30,120,200}|\\
\verb|opacity=0.5 fill opacity draw opacity|\\
\verb|\shade[top color=white,|\\
\verb| bottom color=blue] ...|\\
\verb|\usetikzlibrary{patterns}|\\
\verb|pattern=north east lines|};
\fill[red] (22.0,-17.9) rectangle +(0.9,0.9);
\fill[blue!30] (23.1,-17.9) rectangle +(0.9,0.9);
\fill[red!50!black] (24.2,-17.9) rectangle +(0.9,0.9);
\fill[orange, opacity=0.5] (25.3,-17.9) rectangle +(0.9,0.9);
\fill[blue, opacity=0.5] (25.6,-17.6) rectangle +(0.9,0.9);
\shade[top color=white, bottom color=blue] (26.9,-17.9) rectangle +(0.9,0.9);
\draw[pattern=north east lines] (24.2,-19.2) rectangle +(0.9,0.9);
\foreach \t/\x in {red/22.45, blue!30/23.55, red!50!black/24.65, opacity/26.05, shade/27.35}
\node[lbl, below] at (\x,-17.9) {\t};
\node[lbl, right] at (25.1,-18.75) {pattern};
\end{tikzpicture}Full document
\documentclass[border=4pt]{standalone}
\usepackage{tikz}
\usetikzlibrary{positioning, arrows.meta, patterns}
\begin{document}
\begin{tikzpicture}[
    blk/.style={draw=black!30, rounded corners=4pt, line width=0.6pt},
    ttl/.style={anchor=north west, inner sep=0pt, font=\sffamily\bfseries, text=blue!55!black},
    code/.style={anchor=north west, inner sep=0pt, align=left, font=\scriptsize},
    note/.style={anchor=north west, inner sep=0pt, align=left, text width=6.4cm,
                 font=\sffamily\scriptsize, text=black!75},
    lbl/.style={font=\tiny\ttfamily, inner sep=1pt}]
  % A4 landscape: 28.5 cm x 19.5 cm of content, 4 x 2 blocks
  \node[anchor=north west, inner sep=0pt, font=\sffamily\bfseries\LARGE] at (0,0) {TikZ cheat sheet};
  \node[anchor=north east, inner sep=0pt, font=\sffamily\small, text=black!60] at (28.5,-0.12)
    {page 1 of 2 \quad www.labcanvas.com/tikz/cheat-sheet \quad PGF/TikZ 3.1};
  \foreach \x in {0, 7.2, 14.4, 21.6}
    \foreach \y in {-1.2, -10.5}
      \draw[blk] (\x,\y) rectangle +(6.9,-9);

  % ---------------------------------------------------------------- 1 document
  \node[ttl] at (0.25,-1.45) {Document and picture};
  \node[code] at (0.25,-2.05) {%
\verb|\|\verb|documentclass{article}|\\
\verb|\usepackage{tikz}|\\
\verb|\usetikzlibrary{positioning, arrows.meta}|\\
\verb|\|\verb|begin{document}|\\
\verb|\begin{tikzpicture}[thick, scale=0.8]|\\
\verb|  \draw (0,0) -- (2,1);|\\
\verb|  \node at (1,1) {text};|\\
\verb|\end{tikzpicture}|\\
\verb|A dot \tikz \fill (0,0) circle (2pt); inline|\\
\verb|\end{document}|};
  \node[note] at (0.25,-5.3) {%
Every path command ends with a semicolon.\\[3pt]
Plain numbers are centimetres: \verb|(2,1)| is 2\,cm right and 1\,cm up. 1\,cm = 28.45\,pt, 1\,in = 72.27\,pt.\\[3pt]
Options \verb|[key=value, ...]| go on the picture, a scope, a path or a node; the innermost ones win.\\[3pt]
Libraries: \verb|\usetikzlibrary{...}| after \verb|\usepackage{tikz}|. Packages built on TikZ (pgfplots, tikz-cd, circuitikz) use \verb|\usepackage|.\\[3pt]
The standalone class crops the page to the picture: \verb|\|\verb|documentclass[border=4pt]{standalone}|};

  % ---------------------------------------------------------------- 2 paths
  \node[ttl] at (7.45,-1.45) {Paths};
  \node[code] at (7.45,-2.05) {%
\verb|\draw (0,0) -- (1,1);         % stroke|\\
\verb|\fill (0,0) rectangle (1,1);  % fill|\\
\verb|\filldraw[fill=red!20] ...;   % both|\\
\verb|\path (0,0) node {x};         % invisible|\\
\verb|\clip (0,0) circle (1);       % clip|\\
\verb|\shade[left color=red, right color=blue]|\\[3pt]
\verb|(a) -- (b)             straight line|\\
\verb!(a) -| (b)  (a) |- (b) right angle!\\
\verb|(a) rectangle (b)      (a) circle (1)|\\
\verb|(a) ellipse[x radius=2, y radius=1]|\\
\verb|(a) arc[start angle=0, end angle=90,|\\
\verb|        radius=1]|\\
\verb|(a) .. controls (c) and (d) .. (b)|\\
\verb|(a) to[bend left] (b)  (a) grid (b)|\\
\verb|-- cycle               close the path|};
  \begin{scope}[shift={(7.55,-9.6)}, thick]
    \draw (0,0) -- (0.4,0.8) -- (0.8,0);
    \draw (1.1,0) -| (1.9,0.8);
    \draw (2.2,0) rectangle (3,0.8);
    \draw (3.7,0.4) circle (0.4);
    \draw (5.1,0) arc[start angle=0, end angle=180, radius=0.4];
    \draw (5.4,0) .. controls (5.5,1) and (6.1,1) .. (6.2,0);
  \end{scope}
  \foreach \t/\x in {--/7.95, -|/9.05, rectangle/10.15, circle/11.25, arc/12.25, controls/13.35}
    \node[lbl, below] at (\x,-9.6) {\t};

  % ---------------------------------------------------------------- 3 coordinates
  \node[ttl] at (14.65,-1.45) {Coordinates};
  \node[code] at (14.65,-2.05) {%
\verb|(2,1)         2 cm right, 1 cm up|\\
\verb|(2cm,10pt)    with units|\\
\verb|(30:2)        2 cm at 30 degrees (polar)|\\
\verb|++(1,0)       relative, moves on|\\
\verb|+(1,0)        relative, stays put|\\
\verb|\coordinate (A) at (1,2);|\\
\verb|(A)  (n.north)  (n.south west)  (n.30)|\\
\verb!(A |- B)      x of A, y of B!\\
\verb!(A -| B)      x of B, y of A!\\[3pt]
\verb|\usetikzlibrary{calc}|\\
\verb|($(A)!0.5!(B)$)    halfway from A to B|\\
\verb|($(A)!1cm!(B)$)    1 cm from A to B|\\
\verb|($(A)!(C)!(B)$)    C projected on AB|\\
\verb|($(A)+(1,2)$)      ($2*(A)$)|\\[3pt]
\verb|\usetikzlibrary{intersections}|\\
\verb|\draw[name path=a] ...|\\
\verb|name intersections={of=a and b}|\\
\verb|  gives (intersection-1), ...|};
  \begin{scope}[shift={(14.75,-9.85)}, scale=0.8]
    \draw[help lines] (0,0) grid (7.5,2.6);
    \fill (0,0) circle (2pt);
    \draw[thick, red] (0,0) -- (30:3) node[lbl, right] {(30:3)};
    \fill (2,1) circle (2pt) node[lbl, below] {(2,1)};
    \draw[thick, blue, ->] (2,1) -- ++(2,0) node[lbl, below] {++(2,0)};
  \end{scope}

  % ---------------------------------------------------------------- 4 nodes
  \node[ttl] at (21.85,-1.45) {Nodes and anchors};
  \node[code] at (21.85,-2.05) {%
\verb|\node[draw] (n) at (1,2) {text};|\\
\verb|\draw (0,0) node[above] {label};|\\
\verb|\draw (0,0) -- node[above] {x} (2,0);|\\
\verb|pos=0.3 near start midway near end|\\
\verb|above  below left  right=2pt|\\
\verb|anchor=west  inner sep=2pt  outer sep|\\
\verb|minimum size=1cm  minimum width=2cm|\\
\verb|circle  rounded corners  fill=yellow|\\
\verb|label=above:text   pin=right:text|\\
\verb|\node[coordinate] (p) at (1,1) {};|};
  \node[draw, thick, minimum width=3.2cm, minimum height=1.4cm] (an) at (25.05,-7.3) {\texttt{(n)}};
  \foreach \a/\p in {north/above, south/below, east/right, west/left,
                     north east/above right, north west/above left,
                     south east/below right, south west/below left}
    \fill[red] (an.\a) circle (1.5pt) node[lbl, \p] {\a};
  \node[note, text width=6.4cm] at (21.85,-8.75) {%
A node name used as a coordinate means its centre, but a line drawn to it stops at its border. Angles work too: \verb|(n.30)|.};

  % ---------------------------------------------------------------- 5 positioning
  \node[ttl] at (0.25,-10.75) {Positioning};
  \node[code] at (0.25,-11.35) {%
\verb|\usetikzlibrary{positioning}|\\
\verb|\node (a) {a};|\\
\verb|\node[right=of a] (b) {b};|\\
\verb|\node[below=5mm of a] (c) {c};|\\
\verb|\node[above right=of b] (d) {d};|\\
\verb|node distance=6mm and 10mm|\\
\verb|      (vertical and horizontal gap)|\\
\verb|on grid    measure centre to centre|\\[3pt]
\verb|% without the library:|\\
\verb|\node[anchor=west] at (a.east) {b};|\\
\verb|\node[right=1cm] at (a) {b};|};
  \begin{scope}[node distance=6mm and 10mm, every node/.style={draw, thick, minimum size=6mm, font=\scriptsize}]
    \node (pa) at (1.4,-16.6) {a};
    \node[right=of pa] (pb) {b};
    \node[below=5mm of pa] (pc) {c};
    \node[above right=of pb] (pd) {d};
  \end{scope}
  \draw[densely dotted] (pa) -- (pb) (pa) -- (pc) (pb) -- (pd);

  % ---------------------------------------------------------------- 6 arrows
  \node[ttl] at (7.45,-10.75) {Arrows};
  \node[code] at (7.45,-11.35) {%
\verb|\draw[->] (0,0) -- (1,0);|\\
\verb!->   <-   <->   ->>   |<->|   -|!\\[3pt]
\verb|\usetikzlibrary{arrows.meta}|\\
\verb|-Stealth  -Latex  -Triangle  -Circle|\\
\verb|-Bar  -Bracket  -Hooks  -To|\\
\verb|-{Stealth[length=3mm]}   (braces!)|\\
\verb|-{Latex[open]}  -{Stealth[round]}|\\
\verb|-{Triangle[red, scale=1.5]}|\\
\verb|>=Stealth            % every -> in scope|\\
\verb|shorten >=2pt   shorten <=2pt|\\
\verb|\usetikzlibrary{bending} % curved tips|};
  \begin{scope}[thick]
    \foreach \tip/\t [count=\i] in {->/->, <->/<->, ->>/->>, |<->|/|<->|}
      \draw[\tip] (7.5,-14.9-0.55*\i) -- +(1.4,0) node[lbl, right] {\t};
    \foreach \tip/\t [count=\i] in {-Stealth/-Stealth, -Latex/-Latex, -{Stealth[open]}/-\{Stealth[open]\}, -{Triangle[red]}/-\{Triangle[red]\}}
      \draw[\tip] (10.4,-14.9-0.55*\i) -- +(1.4,0) node[lbl, right] {\t};
  \end{scope}

  % ---------------------------------------------------------------- 7 line styles
  \node[ttl] at (14.65,-10.75) {Line styles};
  \node[code] at (14.65,-11.35) {%
\verb|ultra thin 0.1pt     very thin 0.2pt|\\
\verb|thin 0.4pt (default) semithick 0.6pt|\\
\verb|thick 0.8pt          very thick 1.2pt|\\
\verb|ultra thick 1.6pt    line width=2pt|\\
\verb|solid  dashed  dotted  dash dot|\\
\verb|densely dashed  loosely dotted|\\
\verb|dash pattern=on 4pt off 2pt|\\
\verb|line cap=round   line join=round|\\
\verb|rounded corners=3pt   double|\\
\verb|draw opacity=0.5   help lines|};
  \foreach \s [count=\i] in {ultra thin, thin, thick, very thick, ultra thick}
    \draw[\s] (14.7,-14.5-0.6*\i) -- +(1.6,0) node[lbl, right] {\s};
  \foreach \s [count=\i] in {dashed, dotted, dash dot, densely dashed, double}
    \draw[thick, \s] (18.2,-14.5-0.6*\i) -- +(1.6,0) node[lbl, right] {\s};

  % ---------------------------------------------------------------- 8 colours
  \node[ttl] at (21.85,-10.75) {Colours and fills};
  \node[code] at (21.85,-11.35) {%
\verb|red green blue cyan magenta yellow|\\
\verb|black white gray darkgray lightgray|\\
\verb|brown lime olive orange pink purple|\\
\verb|teal violet                (xcolor)|\\
\verb|blue!30       30% blue, 70% white|\\
\verb|red!50!black  half red, half black|\\
\verb|draw=blue  fill=yellow  text=red|\\
\verb|\definecolor{mine}{RGB}{30,120,200}|\\
\verb|opacity=0.5  fill opacity  draw opacity|\\
\verb|\shade[top color=white,|\\
\verb|       bottom color=blue] ...|\\
\verb|\usetikzlibrary{patterns}|\\
\verb|pattern=north east lines|};
  \fill[red]          (22.0,-17.9) rectangle +(0.9,0.9);
  \fill[blue!30]      (23.1,-17.9) rectangle +(0.9,0.9);
  \fill[red!50!black] (24.2,-17.9) rectangle +(0.9,0.9);
  \fill[orange, opacity=0.5] (25.3,-17.9) rectangle +(0.9,0.9);
  \fill[blue, opacity=0.5]   (25.6,-17.6) rectangle +(0.9,0.9);
  \shade[top color=white, bottom color=blue] (26.9,-17.9) rectangle +(0.9,0.9);
  \draw[pattern=north east lines] (24.2,-19.2) rectangle +(0.9,0.9);
  \foreach \t/\x in {red/22.45, blue!30/23.55, red!50!black/24.65, opacity/26.05, shade/27.35}
    \node[lbl, below] at (\x,-17.9) {\t};
  \node[lbl, right] at (25.1,-18.75) {pattern};
\end{tikzpicture}
\end{document}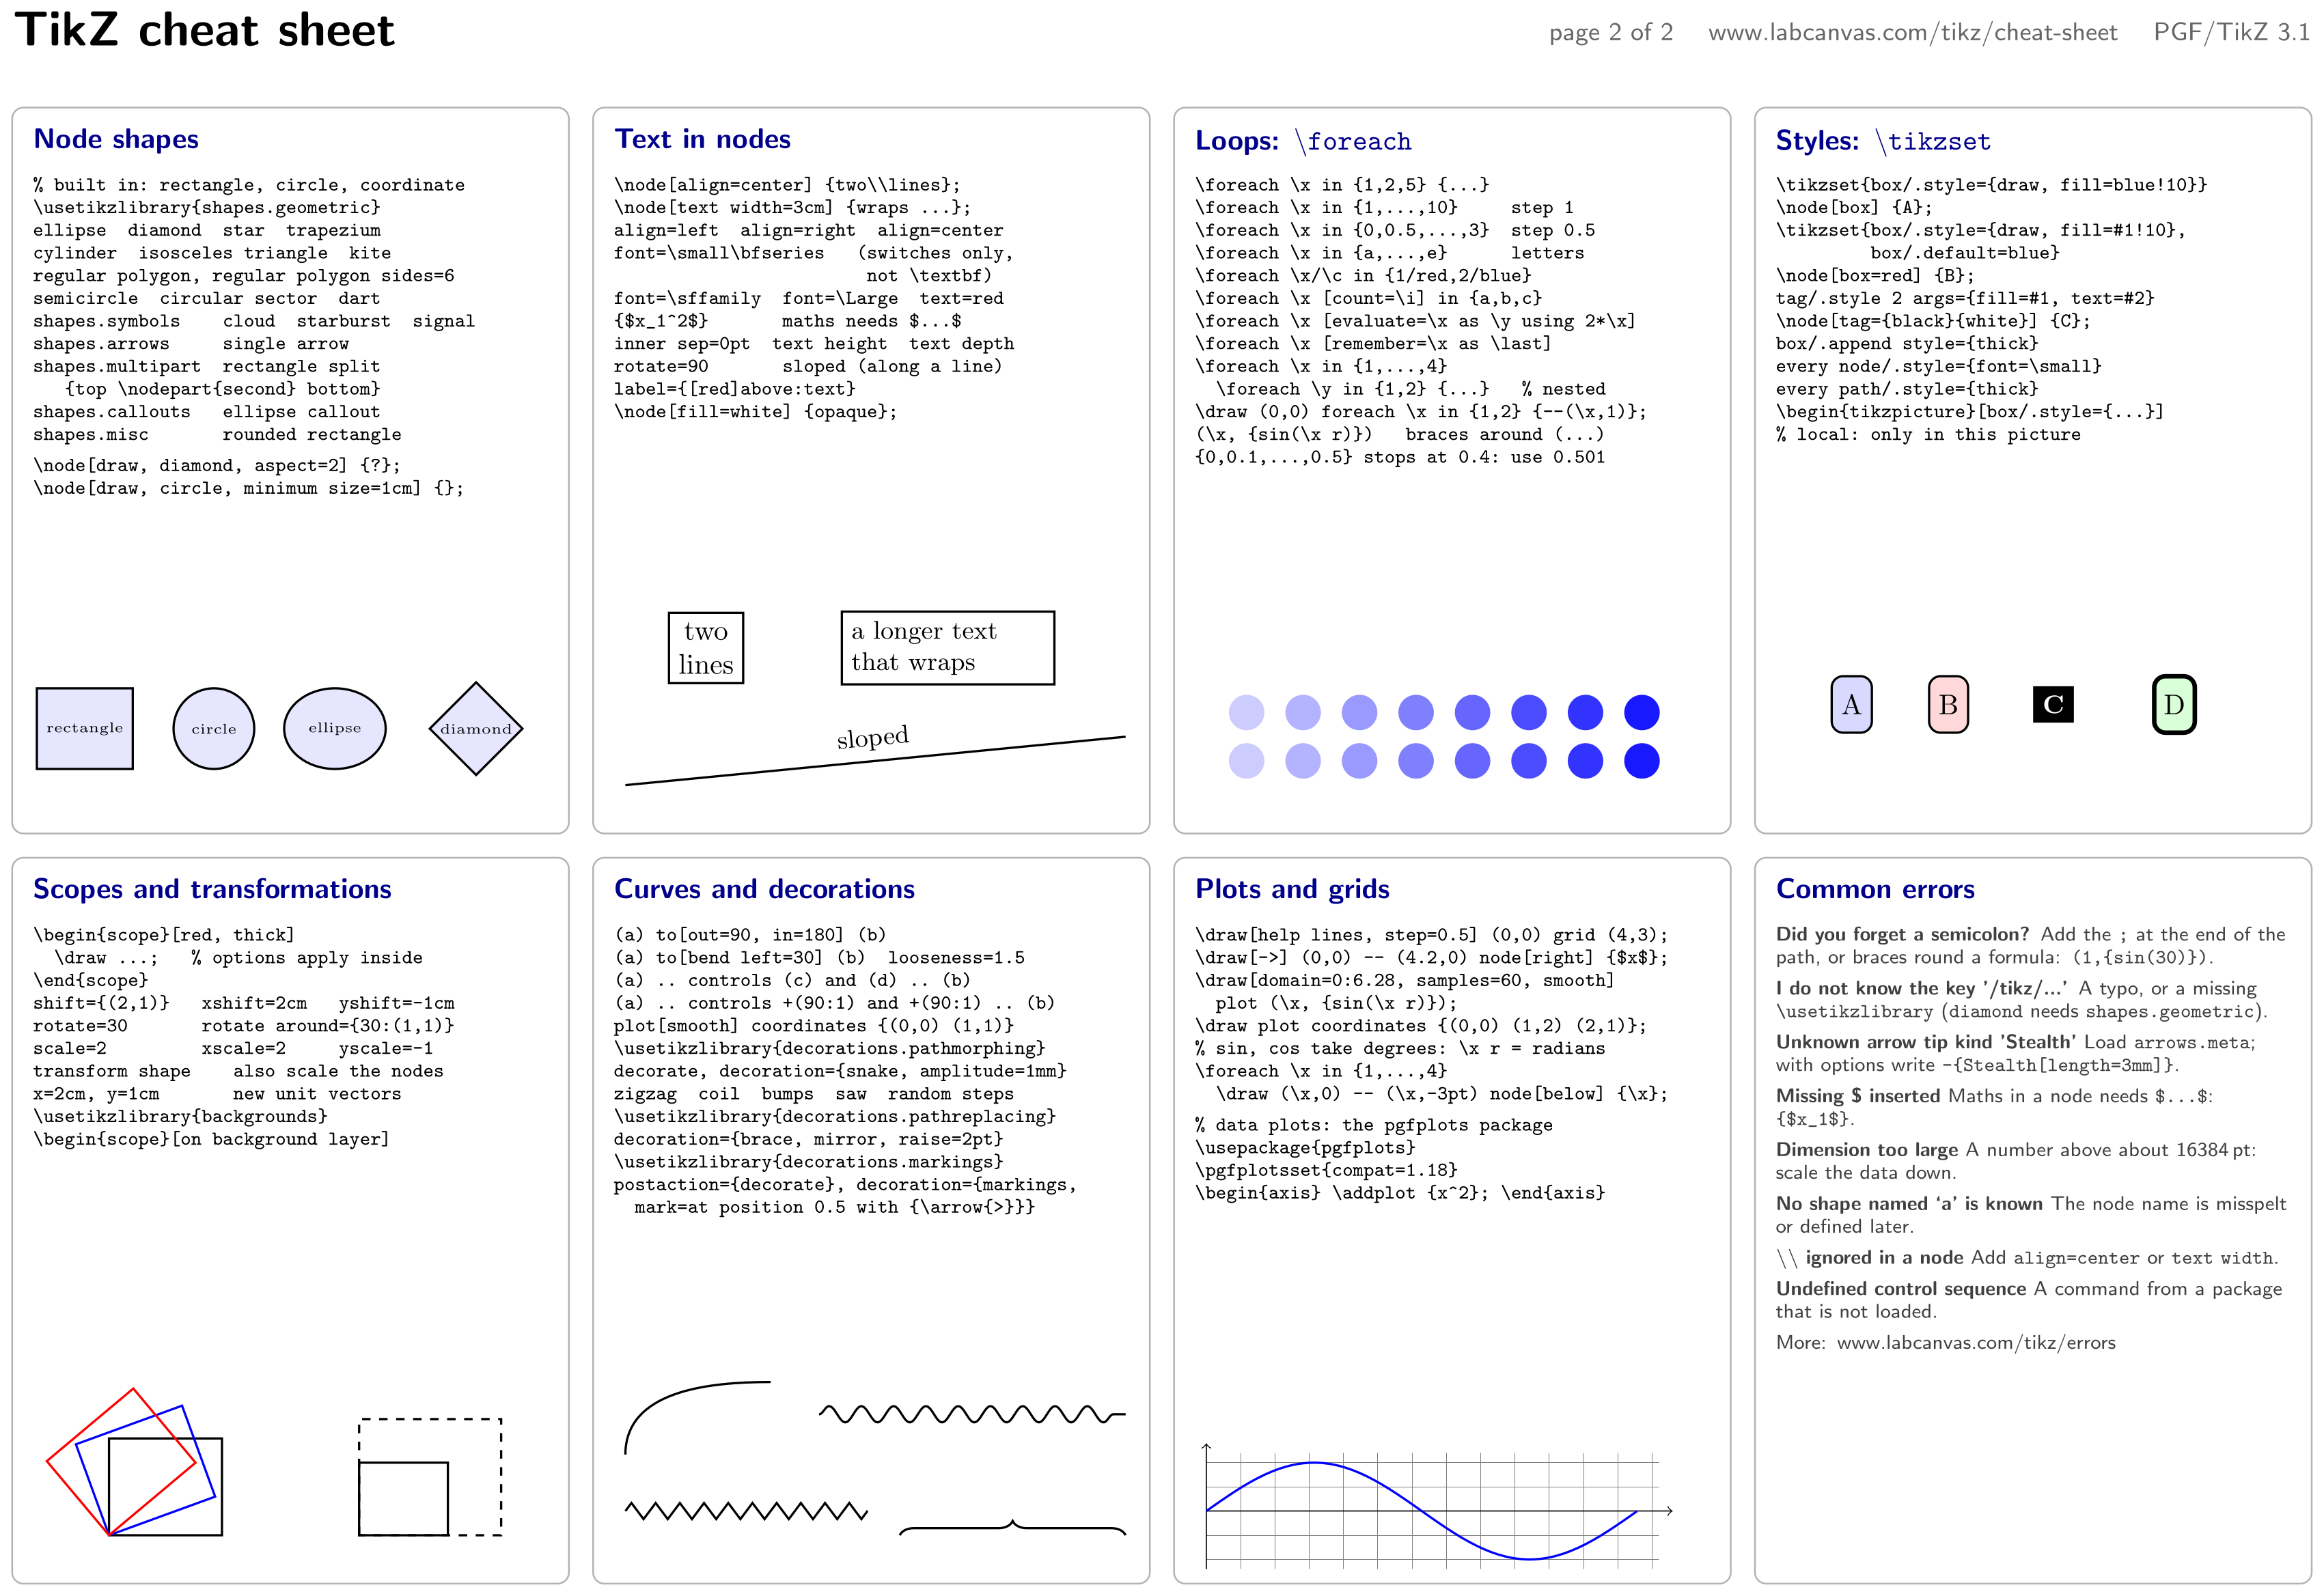
\usepackage{tikz} \usetikzlibrary{shapes.geometric} \usetikzlibrary{decorations.pathmorphing, decorations.pathreplacing}\begin{tikzpicture}[
blk/.style={draw=black!30, rounded corners=4pt, line width=0.6pt},
ttl/.style={anchor=north west, inner sep=0pt, font=\sffamily\bfseries, text=blue!55!black},
code/.style={anchor=north west, inner sep=0pt, align=left, font=\scriptsize},
note/.style={anchor=north west, inner sep=0pt, align=left, text width=6.4cm,
font=\sffamily\scriptsize, text=black!75},
lbl/.style={font=\tiny\ttfamily, inner sep=1pt}]
\node[anchor=north west, inner sep=0pt, font=\sffamily\bfseries\LARGE] at (0,0) {TikZ cheat sheet};
\node[anchor=north east, inner sep=0pt, font=\sffamily\small, text=black!60] at (28.5,-0.12)
{page 2 of 2 \quad www.labcanvas.com/tikz/cheat-sheet \quad PGF/TikZ 3.1};
\foreach \x in {0, 7.2, 14.4, 21.6}
\foreach \y in {-1.2, -10.5}
\draw[blk] (\x,\y) rectangle +(6.9,-9);
% ---------------------------------------------------------------- 9 shapes
\node[ttl] at (0.25,-1.45) {Node shapes};
\node[code] at (0.25,-2.05) {%
\verb|% built in: rectangle, circle, coordinate|\\
\verb|\usetikzlibrary{shapes.geometric}|\\
\verb|ellipse diamond star trapezium|\\
\verb|cylinder isosceles triangle kite|\\
\verb|regular polygon, regular polygon sides=6|\\
\verb|semicircle circular sector dart|\\
\verb|shapes.symbols cloud starburst signal|\\
\verb|shapes.arrows single arrow|\\
\verb|shapes.multipart rectangle split|\\
\verb| {top \nodepart{second} bottom}|\\
\verb|shapes.callouts ellipse callout|\\
\verb|shapes.misc rounded rectangle|\\[3pt]
\verb|\node[draw, diamond, aspect=2] {?};|\\
\verb|\node[draw, circle, minimum size=1cm] {};|};
\begin{scope}[every node/.style={draw, thick, fill=blue!10, minimum size=10mm, font=\tiny}]
\node[rectangle] at (0.9,-8.9) {rectangle};
\node[circle] at (2.5,-8.9) {circle};
\node[ellipse] at (4.0,-8.9) {ellipse};
\node[diamond, inner sep=1pt] at (5.75,-8.9) {diamond};
\end{scope}
% ---------------------------------------------------------------- 10 text
\node[ttl] at (7.45,-1.45) {Text in nodes};
\node[code] at (7.45,-2.05) {%
\verb|\node[align=center] {two\\lines};|\\
\verb|\node[text width=3cm] {wraps ...};|\\
\verb|align=left align=right align=center|\\
\verb|font=\small\bfseries (switches only,|\\
\verb| not \textbf)|\\
\verb|font=\sffamily font=\Large text=red|\\
\verb|{$x_1^2$} maths needs $...$|\\
\verb|inner sep=0pt text height text depth|\\
\verb|rotate=90 sloped (along a line)|\\
\verb|label={[red]above:text}|\\
\verb|\node[fill=white] {opaque};|};
\node[draw, thick, align=center] at (8.6,-7.9) {two\\lines};
\node[draw, thick, text width=2.4cm, align=left, font=\small] at (11.6,-7.9) {a longer text that wraps};
\draw[thick] (7.6,-9.6) -- (13.8,-9.0) node[midway, sloped, above, font=\small] {sloped};
% ---------------------------------------------------------------- 11 foreach
\node[ttl] at (14.65,-1.45) {Loops: \texttt{\textbackslash foreach}};
\node[code] at (14.65,-2.05) {%
\verb|\foreach \x in {1,2,5} {...}|\\
\verb|\foreach \x in {1,...,10} step 1|\\
\verb|\foreach \x in {0,0.5,...,3} step 0.5|\\
\verb|\foreach \x in {a,...,e} letters|\\
\verb|\foreach \x/\c in {1/red,2/blue}|\\
\verb|\foreach \x [count=\i] in {a,b,c}|\\
\verb|\foreach \x [evaluate=\x as \y using 2*\x]|\\
\verb|\foreach \x [remember=\x as \last]|\\
\verb|\foreach \x in {1,...,4}|\\
\verb| \foreach \y in {1,2} {...} % nested|\\
\verb|\draw (0,0) foreach \x in {1,2} {--(\x,1)};|\\
\verb|(\x, {sin(\x r)}) braces around (...)|\\
\verb|{0,0.1,...,0.5} stops at 0.4: use 0.501|};
\foreach \x in {1,...,8}
\foreach \y in {1,2}
\fill[blue!\the\numexpr 10*\x+10\relax] (14.6+0.7*\x, -9.9+0.6*\y) circle (0.22);
% ---------------------------------------------------------------- 12 styles
\node[ttl] at (21.85,-1.45) {Styles: \texttt{\textbackslash tikzset}};
\node[code] at (21.85,-2.05) {%
\verb|\tikzset{box/.style={draw, fill=blue!10}}|\\
\verb|\node[box] {A};|\\
\verb|\tikzset{box/.style={draw, fill=#1!10},|\\
\verb| box/.default=blue}|\\
\verb|\node[box=red] {B};|\\
\verb|tag/.style 2 args={fill=#1, text=#2}|\\
\verb|\node[tag={black}{white}] {C};|\\
\verb|box/.append style={thick}|\\
\verb|every node/.style={font=\small}|\\
\verb|every path/.style={thick}|\\
\verb|\begin{tikzpicture}[box/.style={...}]|\\
\verb|% local: only in this picture|};
\begin{scope}[box/.style={draw, thick, rounded corners, fill=#1!15, minimum height=7mm}, box/.default=blue,
tag/.style 2 args={fill=#1, text=#2, font=\small\bfseries}]
\node[box] at (22.8,-8.6) {A};
\node[box=red] at (24.0,-8.6) {B};
\node[tag={black}{white}] at (25.3,-8.6) {C};
\node[box=green, ultra thick] at (26.8,-8.6) {D};
\end{scope}
% ---------------------------------------------------------------- 13 scopes
\node[ttl] at (0.25,-10.75) {Scopes and transformations};
\node[code] at (0.25,-11.35) {%
\verb|\begin{scope}[red, thick]|\\
\verb| \draw ...; % options apply inside|\\
\verb|\end{scope}|\\
\verb|shift={(2,1)} xshift=2cm yshift=-1cm|\\
\verb|rotate=30 rotate around={30:(1,1)}|\\
\verb|scale=2 xscale=2 yscale=-1|\\
\verb|transform shape also scale the nodes|\\
\verb|x=2cm, y=1cm new unit vectors|\\
\verb|\usetikzlibrary{backgrounds}|\\
\verb|\begin{scope}[on background layer]|};
\foreach \a/\c in {0/black, 20/blue, 40/red}
\draw[thick, \c, rotate around={\a:(1.2,-18.9)}] (1.2,-18.9) rectangle +(1.4,1.2);
\begin{scope}[shift={(4.3,-18.9)}, scale=1.6, thick, dashed]
\draw (0,0) rectangle (1.1,0.9);
\end{scope}
\draw[thick] (4.3,-18.9) rectangle +(1.1,0.9);
% ---------------------------------------------------------------- 14 curves
\node[ttl] at (7.45,-10.75) {Curves and decorations};
\node[code] at (7.45,-11.35) {%
\verb|(a) to[out=90, in=180] (b)|\\
\verb|(a) to[bend left=30] (b) looseness=1.5|\\
\verb|(a) .. controls (c) and (d) .. (b)|\\
\verb|(a) .. controls +(90:1) and +(90:1) .. (b)|\\
\verb|plot[smooth] coordinates {(0,0) (1,1)}|\\
\verb|\usetikzlibrary{decorations.pathmorphing}|\\
\verb|decorate, decoration={snake, amplitude=1mm}|\\
\verb|zigzag coil bumps saw random steps|\\
\verb|\usetikzlibrary{decorations.pathreplacing}|\\
\verb|decoration={brace, mirror, raise=2pt}|\\
\verb|\usetikzlibrary{decorations.markings}|\\
\verb|postaction={decorate}, decoration={markings,|\\
\verb| mark=at position 0.5 with {\arrow{>}}}|};
\draw[thick] (7.6,-17.9) to[out=90, in=180] (9.4,-17.0);
\draw[thick, decorate, decoration={snake, amplitude=1mm, segment length=4mm}] (10.0,-17.4) -- (13.8,-17.4);
\draw[thick, decorate, decoration={zigzag, amplitude=1mm, segment length=3mm}] (7.6,-18.6) -- (10.6,-18.6);
\draw[thick, decorate, decoration={brace, amplitude=5pt}] (11.0,-18.9) -- (13.8,-18.9);
% ---------------------------------------------------------------- 15 plots and grids
\node[ttl] at (14.65,-10.75) {Plots and grids};
\node[code] at (14.65,-11.35) {%
\verb|\draw[help lines, step=0.5] (0,0) grid (4,3);|\\
\verb|\draw[->] (0,0) -- (4.2,0) node[right] {$x$};|\\
\verb|\draw[domain=0:6.28, samples=60, smooth]|\\
\verb| plot (\x, {sin(\x r)});|\\
\verb|\draw plot coordinates {(0,0) (1,2) (2,1)};|\\
\verb|% sin, cos take degrees: \x r = radians|\\
\verb|\foreach \x in {1,...,4}|\\
\verb| \draw (\x,0) -- (\x,-3pt) node[below] {\x};|\\[3pt]
\verb|% data plots: the pgfplots package|\\
\verb|\usepackage{pgfplots}|\\
\verb|\pgfplotsset{compat=1.18}|\\
\verb|\begin{axis} \addplot {x^2}; \end{axis}|};
\begin{scope}[shift={(14.8,-18.6)}, x=0.85cm, y=0.6cm]
\draw[help lines, step=0.5] (0,-1.2) grid (6.6,1.2);
\draw[->] (0,0) -- (6.8,0);
\draw[->] (0,-1.2) -- (0,1.4);
\draw[thick, blue, domain=0:6.28, samples=60, smooth] plot (\x, {sin(\x r)});
\end{scope}
% ---------------------------------------------------------------- 16 errors
\node[ttl] at (21.85,-10.75) {Common errors};
\node[note] at (21.85,-11.35) {%
\textbf{Did you forget a semicolon?} Add the \verb|;| at the end of the path, or braces round a formula: \verb|(1,{sin(30)})|.\\[3pt]
\textbf{I do not know the key '/tikz/...'} A typo, or a missing \verb|\usetikzlibrary| (\verb|diamond| needs \verb|shapes.geometric|).\\[3pt]
\textbf{Unknown arrow tip kind 'Stealth'} Load \verb|arrows.meta|; with options write \verb|-{Stealth[length=3mm]}|.\\[3pt]
\textbf{Missing \$ inserted} Maths in a node needs \verb|$...$|: \verb|{$x_1$}|.\\[3pt]
\textbf{Dimension too large} A number above about 16384\,pt: scale the data down.\\[3pt]
\textbf{No shape named `a' is known} The node name is misspelt or defined later.\\[3pt]
\textbf{\texttt{\textbackslash\textbackslash} ignored in a node} Add \verb|align=center| or \verb|text width|.\\[3pt]
\textbf{Undefined control sequence} A command from a package that is not loaded.\\[3pt]
More: www.labcanvas.com/tikz/errors};
\end{tikzpicture}Full document
\documentclass[border=4pt]{standalone}
\usepackage{tikz}
\usetikzlibrary{shapes.geometric}
\usetikzlibrary{decorations.pathmorphing, decorations.pathreplacing}
\begin{document}
\begin{tikzpicture}[
    blk/.style={draw=black!30, rounded corners=4pt, line width=0.6pt},
    ttl/.style={anchor=north west, inner sep=0pt, font=\sffamily\bfseries, text=blue!55!black},
    code/.style={anchor=north west, inner sep=0pt, align=left, font=\scriptsize},
    note/.style={anchor=north west, inner sep=0pt, align=left, text width=6.4cm,
                 font=\sffamily\scriptsize, text=black!75},
    lbl/.style={font=\tiny\ttfamily, inner sep=1pt}]
  \node[anchor=north west, inner sep=0pt, font=\sffamily\bfseries\LARGE] at (0,0) {TikZ cheat sheet};
  \node[anchor=north east, inner sep=0pt, font=\sffamily\small, text=black!60] at (28.5,-0.12)
    {page 2 of 2 \quad www.labcanvas.com/tikz/cheat-sheet \quad PGF/TikZ 3.1};
  \foreach \x in {0, 7.2, 14.4, 21.6}
    \foreach \y in {-1.2, -10.5}
      \draw[blk] (\x,\y) rectangle +(6.9,-9);

  % ---------------------------------------------------------------- 9 shapes
  \node[ttl] at (0.25,-1.45) {Node shapes};
  \node[code] at (0.25,-2.05) {%
\verb|% built in: rectangle, circle, coordinate|\\
\verb|\usetikzlibrary{shapes.geometric}|\\
\verb|ellipse  diamond  star  trapezium|\\
\verb|cylinder  isosceles triangle  kite|\\
\verb|regular polygon, regular polygon sides=6|\\
\verb|semicircle  circular sector  dart|\\
\verb|shapes.symbols    cloud  starburst  signal|\\
\verb|shapes.arrows     single arrow|\\
\verb|shapes.multipart  rectangle split|\\
\verb|   {top \nodepart{second} bottom}|\\
\verb|shapes.callouts   ellipse callout|\\
\verb|shapes.misc       rounded rectangle|\\[3pt]
\verb|\node[draw, diamond, aspect=2] {?};|\\
\verb|\node[draw, circle, minimum size=1cm] {};|};
  \begin{scope}[every node/.style={draw, thick, fill=blue!10, minimum size=10mm, font=\tiny}]
    \node[rectangle] at (0.9,-8.9) {rectangle};
    \node[circle] at (2.5,-8.9) {circle};
    \node[ellipse] at (4.0,-8.9) {ellipse};
    \node[diamond, inner sep=1pt] at (5.75,-8.9) {diamond};
  \end{scope}

  % ---------------------------------------------------------------- 10 text
  \node[ttl] at (7.45,-1.45) {Text in nodes};
  \node[code] at (7.45,-2.05) {%
\verb|\node[align=center] {two\\lines};|\\
\verb|\node[text width=3cm] {wraps ...};|\\
\verb|align=left  align=right  align=center|\\
\verb|font=\small\bfseries   (switches only,|\\
\verb|                        not \textbf)|\\
\verb|font=\sffamily  font=\Large  text=red|\\
\verb|{$x_1^2$}       maths needs $...$|\\
\verb|inner sep=0pt  text height  text depth|\\
\verb|rotate=90       sloped (along a line)|\\
\verb|label={[red]above:text}|\\
\verb|\node[fill=white] {opaque};|};
  \node[draw, thick, align=center] at (8.6,-7.9) {two\\lines};
  \node[draw, thick, text width=2.4cm, align=left, font=\small] at (11.6,-7.9) {a longer text that wraps};
  \draw[thick] (7.6,-9.6) -- (13.8,-9.0) node[midway, sloped, above, font=\small] {sloped};

  % ---------------------------------------------------------------- 11 foreach
  \node[ttl] at (14.65,-1.45) {Loops: \texttt{\textbackslash foreach}};
  \node[code] at (14.65,-2.05) {%
\verb|\foreach \x in {1,2,5} {...}|\\
\verb|\foreach \x in {1,...,10}     step 1|\\
\verb|\foreach \x in {0,0.5,...,3}  step 0.5|\\
\verb|\foreach \x in {a,...,e}      letters|\\
\verb|\foreach \x/\c in {1/red,2/blue}|\\
\verb|\foreach \x [count=\i] in {a,b,c}|\\
\verb|\foreach \x [evaluate=\x as \y using 2*\x]|\\
\verb|\foreach \x [remember=\x as \last]|\\
\verb|\foreach \x in {1,...,4}|\\
\verb|  \foreach \y in {1,2} {...}   % nested|\\
\verb|\draw (0,0) foreach \x in {1,2} {--(\x,1)};|\\
\verb|(\x, {sin(\x r)})   braces around (...)|\\
\verb|{0,0.1,...,0.5} stops at 0.4: use 0.501|};
  \foreach \x in {1,...,8}
    \foreach \y in {1,2}
      \fill[blue!\the\numexpr 10*\x+10\relax] (14.6+0.7*\x, -9.9+0.6*\y) circle (0.22);

  % ---------------------------------------------------------------- 12 styles
  \node[ttl] at (21.85,-1.45) {Styles: \texttt{\textbackslash tikzset}};
  \node[code] at (21.85,-2.05) {%
\verb|\tikzset{box/.style={draw, fill=blue!10}}|\\
\verb|\node[box] {A};|\\
\verb|\tikzset{box/.style={draw, fill=#1!10},|\\
\verb|         box/.default=blue}|\\
\verb|\node[box=red] {B};|\\
\verb|tag/.style 2 args={fill=#1, text=#2}|\\
\verb|\node[tag={black}{white}] {C};|\\
\verb|box/.append style={thick}|\\
\verb|every node/.style={font=\small}|\\
\verb|every path/.style={thick}|\\
\verb|\begin{tikzpicture}[box/.style={...}]|\\
\verb|% local: only in this picture|};
  \begin{scope}[box/.style={draw, thick, rounded corners, fill=#1!15, minimum height=7mm}, box/.default=blue,
                tag/.style 2 args={fill=#1, text=#2, font=\small\bfseries}]
    \node[box] at (22.8,-8.6) {A};
    \node[box=red] at (24.0,-8.6) {B};
    \node[tag={black}{white}] at (25.3,-8.6) {C};
    \node[box=green, ultra thick] at (26.8,-8.6) {D};
  \end{scope}

  % ---------------------------------------------------------------- 13 scopes
  \node[ttl] at (0.25,-10.75) {Scopes and transformations};
  \node[code] at (0.25,-11.35) {%
\verb|\begin{scope}[red, thick]|\\
\verb|  \draw ...;   % options apply inside|\\
\verb|\end{scope}|\\
\verb|shift={(2,1)}   xshift=2cm   yshift=-1cm|\\
\verb|rotate=30       rotate around={30:(1,1)}|\\
\verb|scale=2         xscale=2     yscale=-1|\\
\verb|transform shape    also scale the nodes|\\
\verb|x=2cm, y=1cm       new unit vectors|\\
\verb|\usetikzlibrary{backgrounds}|\\
\verb|\begin{scope}[on background layer]|};
  \foreach \a/\c in {0/black, 20/blue, 40/red}
    \draw[thick, \c, rotate around={\a:(1.2,-18.9)}] (1.2,-18.9) rectangle +(1.4,1.2);
  \begin{scope}[shift={(4.3,-18.9)}, scale=1.6, thick, dashed]
    \draw (0,0) rectangle (1.1,0.9);
  \end{scope}
  \draw[thick] (4.3,-18.9) rectangle +(1.1,0.9);

  % ---------------------------------------------------------------- 14 curves
  \node[ttl] at (7.45,-10.75) {Curves and decorations};
  \node[code] at (7.45,-11.35) {%
\verb|(a) to[out=90, in=180] (b)|\\
\verb|(a) to[bend left=30] (b)  looseness=1.5|\\
\verb|(a) .. controls (c) and (d) .. (b)|\\
\verb|(a) .. controls +(90:1) and +(90:1) .. (b)|\\
\verb|plot[smooth] coordinates {(0,0) (1,1)}|\\
\verb|\usetikzlibrary{decorations.pathmorphing}|\\
\verb|decorate, decoration={snake, amplitude=1mm}|\\
\verb|zigzag  coil  bumps  saw  random steps|\\
\verb|\usetikzlibrary{decorations.pathreplacing}|\\
\verb|decoration={brace, mirror, raise=2pt}|\\
\verb|\usetikzlibrary{decorations.markings}|\\
\verb|postaction={decorate}, decoration={markings,|\\
\verb|  mark=at position 0.5 with {\arrow{>}}}|};
  \draw[thick] (7.6,-17.9) to[out=90, in=180] (9.4,-17.0);
  \draw[thick, decorate, decoration={snake, amplitude=1mm, segment length=4mm}] (10.0,-17.4) -- (13.8,-17.4);
  \draw[thick, decorate, decoration={zigzag, amplitude=1mm, segment length=3mm}] (7.6,-18.6) -- (10.6,-18.6);
  \draw[thick, decorate, decoration={brace, amplitude=5pt}] (11.0,-18.9) -- (13.8,-18.9);

  % ---------------------------------------------------------------- 15 plots and grids
  \node[ttl] at (14.65,-10.75) {Plots and grids};
  \node[code] at (14.65,-11.35) {%
\verb|\draw[help lines, step=0.5] (0,0) grid (4,3);|\\
\verb|\draw[->] (0,0) -- (4.2,0) node[right] {$x$};|\\
\verb|\draw[domain=0:6.28, samples=60, smooth]|\\
\verb|  plot (\x, {sin(\x r)});|\\
\verb|\draw plot coordinates {(0,0) (1,2) (2,1)};|\\
\verb|% sin, cos take degrees: \x r = radians|\\
\verb|\foreach \x in {1,...,4}|\\
\verb|  \draw (\x,0) -- (\x,-3pt) node[below] {\x};|\\[3pt]
\verb|% data plots: the pgfplots package|\\
\verb|\usepackage{pgfplots}|\\
\verb|\pgfplotsset{compat=1.18}|\\
\verb|\begin{axis} \addplot {x^2}; \end{axis}|};
  \begin{scope}[shift={(14.8,-18.6)}, x=0.85cm, y=0.6cm]
    \draw[help lines, step=0.5] (0,-1.2) grid (6.6,1.2);
    \draw[->] (0,0) -- (6.8,0);
    \draw[->] (0,-1.2) -- (0,1.4);
    \draw[thick, blue, domain=0:6.28, samples=60, smooth] plot (\x, {sin(\x r)});
  \end{scope}

  % ---------------------------------------------------------------- 16 errors
  \node[ttl] at (21.85,-10.75) {Common errors};
  \node[note] at (21.85,-11.35) {%
\textbf{Did you forget a semicolon?} Add the \verb|;| at the end of the path, or braces round a formula: \verb|(1,{sin(30)})|.\\[3pt]
\textbf{I do not know the key '/tikz/...'} A typo, or a missing \verb|\usetikzlibrary| (\verb|diamond| needs \verb|shapes.geometric|).\\[3pt]
\textbf{Unknown arrow tip kind 'Stealth'} Load \verb|arrows.meta|; with options write \verb|-{Stealth[length=3mm]}|.\\[3pt]
\textbf{Missing \$ inserted} Maths in a node needs \verb|$...$|: \verb|{$x_1$}|.\\[3pt]
\textbf{Dimension too large} A number above about 16384\,pt: scale the data down.\\[3pt]
\textbf{No shape named `a' is known} The node name is misspelt or defined later.\\[3pt]
\textbf{\texttt{\textbackslash\textbackslash} ignored in a node} Add \verb|align=center| or \verb|text width|.\\[3pt]
\textbf{Undefined control sequence} A command from a package that is not loaded.\\[3pt]
More: www.labcanvas.com/tikz/errors};
\end{tikzpicture}
\end{document}Paths
| Code | What it does |
|---|---|
\draw (0,0) -- (1,1); | strokes the path; \fill fills it, \filldraw does both, \path draws nothing, \clip clips what follows in the scope |
(a) -- (b), (a) -| (b), (a) |- (b) | a straight line; horizontal then vertical; vertical then horizontal |
(a) rectangle (b), (a) circle (1), (a) ellipse[x radius=2, y radius=1] | rectangle with corners a and b; circle and ellipse around a |
(a) arc[start angle=0, end angle=90, radius=1] | an arc starting at a |
(a) .. controls (c) and (d) .. (b), (a) to[bend left] (b) | a Bézier curve; a curve set by angles |
(a) grid (b), -- cycle | grid lines (step=…); closes the path |
More on the coordinates and paths page.

\usepackage{tikz}\begin{tikzpicture}[thick, every node/.style={below, font=\scriptsize\ttfamily}]
\draw (0,0) -- (0.5,1) -- (1,0); \node at (0.5,0) {--};
\draw (1.5,0) -| (2.5,1); \node at (2,0) {-|};
\draw (3,0) rectangle (4,1); \node at (3.5,0) {rectangle};
\draw (5,0.5) circle (0.5); \node at (5,0) {circle};
\draw (7,0) arc[start angle=0, end angle=180, radius=0.5];
\node at (6.5,0) {arc};
\draw (7.5,0) .. controls (7.6,1.2) and (8.4,1.2) .. (8.5,0);
\node at (8,0) {controls};
\draw (9,0) to[bend left=60] (10,0); \node at (9.5,0) {to};
\end{tikzpicture}Full document
\documentclass[border=4pt]{standalone}
\usepackage{tikz}
\begin{document}
\begin{tikzpicture}[thick, every node/.style={below, font=\scriptsize\ttfamily}]
  \draw (0,0) -- (0.5,1) -- (1,0);        \node at (0.5,0) {--};
  \draw (1.5,0) -| (2.5,1);               \node at (2,0) {-|};
  \draw (3,0) rectangle (4,1);            \node at (3.5,0) {rectangle};
  \draw (5,0.5) circle (0.5);             \node at (5,0) {circle};
  \draw (7,0) arc[start angle=0, end angle=180, radius=0.5];
                                          \node at (6.5,0) {arc};
  \draw (7.5,0) .. controls (7.6,1.2) and (8.4,1.2) .. (8.5,0);
                                          \node at (8,0) {controls};
  \draw (9,0) to[bend left=60] (10,0);    \node at (9.5,0) {to};
\end{tikzpicture}
\end{document}Node shapes
Built in: rectangle (the default), circle and coordinate. Everything else needs a library; \usetikzlibrary{shapes.geometric} adds ellipse, diamond, regular polygon (with regular polygon sides=6), star, trapezium, cylinder, isosceles triangle, kite, dart, semicircle and circular sector. rounded corners is an option of any path, not a shape. minimum size, minimum width, minimum height and aspect (diamond) set the size. Other shapes are on the libraries page.

\usepackage{tikz} \usetikzlibrary{shapes.geometric}\begin{tikzpicture}[every node/.style={draw, thick, fill=blue!10, minimum size=11mm, font=\scriptsize}]
\node[rectangle] at (0,0) {rectangle};
\node[circle] at (1.9,0) {circle};
\node[ellipse] at (3.8,0) {ellipse};
\node[diamond, aspect=1.4] at (5.9,0) {diamond};
\node[regular polygon, regular polygon sides=6, inner sep=0pt] at (7.9,0) {hexagon};
\node[rounded corners] at (9.7,0) {rounded};
\end{tikzpicture}Full document
\documentclass[border=4pt]{standalone}
\usepackage{tikz}
\usetikzlibrary{shapes.geometric}
\begin{document}
\begin{tikzpicture}[every node/.style={draw, thick, fill=blue!10, minimum size=11mm, font=\scriptsize}]
  \node[rectangle]                  at (0,0)   {rectangle};
  \node[circle]                     at (1.9,0) {circle};
  \node[ellipse]                    at (3.8,0) {ellipse};
  \node[diamond, aspect=1.4]        at (5.9,0) {diamond};
  \node[regular polygon, regular polygon sides=6, inner sep=0pt] at (7.9,0) {hexagon};
  \node[rounded corners]            at (9.7,0) {rounded};
\end{tikzpicture}
\end{document}Nodes and anchors
| Code | What it does |
|---|---|
\node[draw] (n) at (1,2) {text}; | a node named n with a border |
\draw (0,0) -- node[above] {x} (2,0); | a label halfway along a line; pos=0.3, near start, midway, near end |
above, below left, right=2pt, anchor=west | which side of the point the node sits on |
inner sep, outer sep, minimum size | padding (inner sep is initially 0.3333em), outer margin, minimum size |
align=center, text width=3cm, font=\small\bfseries | line breaks with \\, wrapping, font switches |
label=above:text, pin=right:text | extra text next to the node, with a line for pin |
(n.north), (n.south west), (n.30), (n) | anchors; an angle; the name alone is the centre, but lines to it stop at the border |
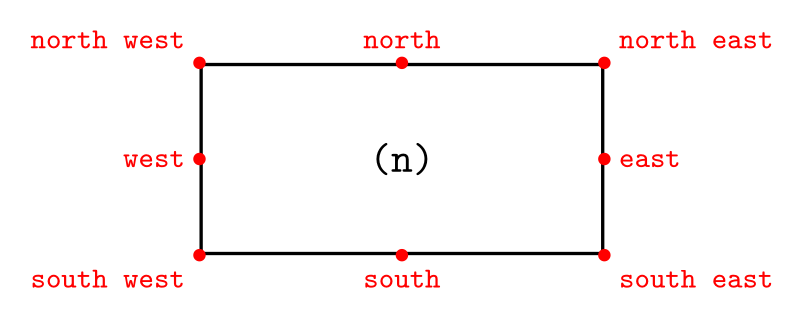
\usepackage{tikz}\begin{tikzpicture}
\node[draw, thick, minimum width=3.4cm, minimum height=1.6cm] (n) {\texttt{(n)}};
\foreach \a/\p in {north/above, south/below, east/right, west/left,
north east/above right, north west/above left,
south east/below right, south west/below left}
\fill[red] (n.\a) circle (1.5pt) node[\p, font=\scriptsize\ttfamily] {\a};
\end{tikzpicture}Full document
\documentclass[border=4pt]{standalone}
\usepackage{tikz}
\begin{document}
\begin{tikzpicture}
  \node[draw, thick, minimum width=3.4cm, minimum height=1.6cm] (n) {\texttt{(n)}};
  \foreach \a/\p in {north/above, south/below, east/right, west/left,
                     north east/above right, north west/above left,
                     south east/below right, south west/below left}
    \fill[red] (n.\a) circle (1.5pt) node[\p, font=\scriptsize\ttfamily] {\a};
\end{tikzpicture}
\end{document}Positioning
With \usetikzlibrary{positioning}: right=of a, above=of a, below left=of a place a node next to node a, with a gap of node distance (initially 1 cm and 1 cm) between the borders; right=5mm of a sets the gap; node distance=5mm and 8mm sets the vertical and horizontal gaps; on grid measures centre to centre. Without the library, use \node[anchor=west] at (a.east) {…};.
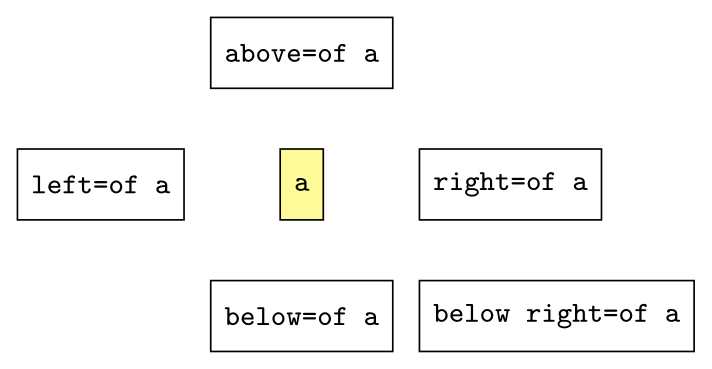
\usepackage{tikz} \usetikzlibrary{positioning}\begin{tikzpicture}[node distance=5mm and 8mm,
every node/.style={draw, font=\scriptsize\ttfamily, minimum height=6mm}]
\node[fill=yellow!40] (a) {a};
\node[above=of a] {above=of a};
\node[below=of a] {below=of a};
\node[left=of a] {left=of a};
\node[right=of a] {right=of a};
\node[below right=of a] {below right=of a};
\end{tikzpicture}Full document
\documentclass[border=4pt]{standalone}
\usepackage{tikz}
\usetikzlibrary{positioning}
\begin{document}
\begin{tikzpicture}[node distance=5mm and 8mm,
                    every node/.style={draw, font=\scriptsize\ttfamily, minimum height=6mm}]
  \node[fill=yellow!40] (a) {a};
  \node[above=of a]       {above=of a};
  \node[below=of a]       {below=of a};
  \node[left=of a]        {left=of a};
  \node[right=of a]       {right=of a};
  \node[below right=of a] {below right=of a};
\end{tikzpicture}
\end{document}Arrows
| Code | What it does |
|---|---|
->, <-, <->, ->>, |<->| | built-in tips at the end, start, both ends; double tip; bars for dimension lines |
-Stealth, -Latex, -Triangle, Circle-Bar | arrows.meta tips (\usetikzlibrary{arrows.meta}) |
-{Stealth[length=3mm, open]} | tip options in brackets, with braces around the tip |
>=Stealth | changes what -> draws in the picture or scope |
shorten >=2pt, shorten <=2pt | stops the line short of its end or start |
All tips, sizes and curved arrows: TikZ arrows.
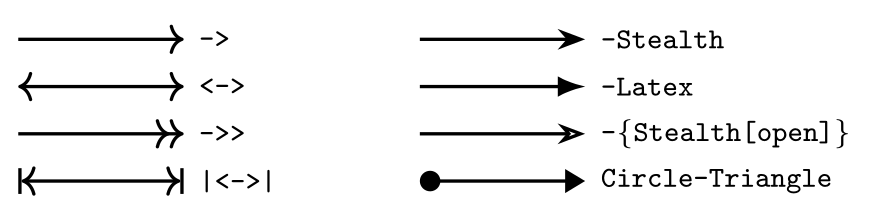
\usepackage{tikz} \usetikzlibrary{arrows.meta}\begin{tikzpicture}[thick, every node/.style={right, font=\scriptsize\ttfamily}]
\draw[->] (0,0) -- (1.4,0) node {->};
\draw[<->] (0,-0.4) -- (1.4,-0.4) node {<->};
\draw[->>] (0,-0.8) -- (1.4,-0.8) node {->>};
\draw[|<->|] (0,-1.2) -- (1.4,-1.2) node {|<->|};
\draw[-Stealth] (3.4,0) -- (4.8,0) node {-Stealth};
\draw[-Latex] (3.4,-0.4) -- (4.8,-0.4) node {-Latex};
\draw[-{Stealth[open]}] (3.4,-0.8) -- (4.8,-0.8) node {-\{Stealth[open]\}};
\draw[Circle-Triangle] (3.4,-1.2) -- (4.8,-1.2) node {Circle-Triangle};
\end{tikzpicture}Full document
\documentclass[border=4pt]{standalone}
\usepackage{tikz}
\usetikzlibrary{arrows.meta}
\begin{document}
\begin{tikzpicture}[thick, every node/.style={right, font=\scriptsize\ttfamily}]
  \draw[->]    (0,0)    -- (1.4,0)    node {->};
  \draw[<->]   (0,-0.4) -- (1.4,-0.4) node {<->};
  \draw[->>]   (0,-0.8) -- (1.4,-0.8) node {->>};
  \draw[|<->|] (0,-1.2) -- (1.4,-1.2) node {|<->|};
  \draw[-Stealth]         (3.4,0)    -- (4.8,0)    node {-Stealth};
  \draw[-Latex]           (3.4,-0.4) -- (4.8,-0.4) node {-Latex};
  \draw[-{Stealth[open]}] (3.4,-0.8) -- (4.8,-0.8) node {-\{Stealth[open]\}};
  \draw[Circle-Triangle]  (3.4,-1.2) -- (4.8,-1.2) node {Circle-Triangle};
\end{tikzpicture}
\end{document}Line styles
Widths: ultra thin 0.1pt, very thin 0.2pt, thin 0.4pt (the default), semithick 0.6pt, thick 0.8pt, very thick 1.2pt, ultra thick 1.6pt, or line width=2pt. Dashes: dashed, dotted, dash dot, dash dot dot, each also densely or loosely, or dash pattern=on 4pt off 2pt. Also line cap=round, line join=round, rounded corners=3pt, double and help lines (thin gray, for grids). Details: TikZ lines.
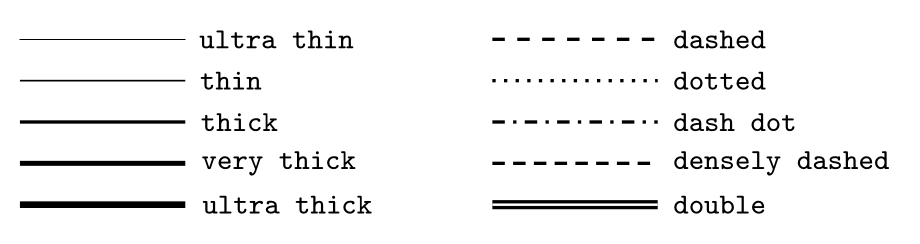
\usepackage{tikz}\begin{tikzpicture}[every node/.style={right, font=\scriptsize\ttfamily}]
\foreach \s [count=\i] in {ultra thin, thin, thick, very thick, ultra thick}
\draw[\s] (0,-0.35*\i) -- (1.4,-0.35*\i) node {\s};
\foreach \s [count=\i] in {dashed, dotted, dash dot, densely dashed, double}
\draw[thick, \s] (4,-0.35*\i) -- (5.4,-0.35*\i) node {\s};
\end{tikzpicture}Full document
\documentclass[border=4pt]{standalone}
\usepackage{tikz}
\begin{document}
\begin{tikzpicture}[every node/.style={right, font=\scriptsize\ttfamily}]
  \foreach \s [count=\i] in {ultra thin, thin, thick, very thick, ultra thick}
    \draw[\s] (0,-0.35*\i) -- (1.4,-0.35*\i) node {\s};
  \foreach \s [count=\i] in {dashed, dotted, dash dot, densely dashed, double}
    \draw[thick, \s] (4,-0.35*\i) -- (5.4,-0.35*\i) node {\s};
\end{tikzpicture}
\end{document}Colours, opacity and shading
Colour names without extra packages: red, green, blue, cyan, magenta, yellow, black, white, gray, darkgray, lightgray, brown, lime, olive, orange, pink, purple, teal, violet. Mix with !: blue!30 is 30% blue and 70% white, red!50!black half red and half black. draw=…, fill=… and text=… colour one part; a colour name alone colours all. \definecolor{mine}{RGB}{30,120,200} defines a colour; opacity, fill opacity and draw opacity make things see-through; \shade[left color=yellow, right color=red] draws a gradient. More: TikZ colours.
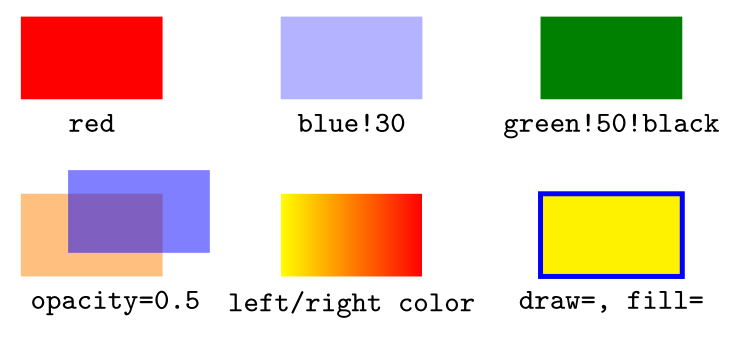
\usepackage{tikz}\begin{tikzpicture}[every node/.style={below, font=\scriptsize\ttfamily}]
\fill[red] (0,0) rectangle +(1.2,0.7); \node at (0.6,0) {red};
\fill[blue!30] (2.2,0) rectangle +(1.2,0.7); \node at (2.8,0) {blue!30};
\fill[green!50!black] (4.4,0) rectangle +(1.2,0.7); \node at (5,0) {green!50!black};
\fill[orange, opacity=0.5] (0,-1.5) rectangle +(1.2,0.7);
\fill[blue, opacity=0.5] (0.4,-1.3) rectangle +(1.2,0.7);
\node at (0.8,-1.5) {opacity=0.5};
\shade[left color=yellow, right color=red] (2.2,-1.5) rectangle +(1.2,0.7);
\node at (2.8,-1.5) {left/right color};
\draw[draw=blue, fill=yellow, very thick] (4.4,-1.5) rectangle +(1.2,0.7);
\node at (5,-1.5) {draw=, fill=};
\end{tikzpicture}Full document
\documentclass[border=4pt]{standalone}
\usepackage{tikz}
\begin{document}
\begin{tikzpicture}[every node/.style={below, font=\scriptsize\ttfamily}]
  \fill[red]            (0,0)   rectangle +(1.2,0.7); \node at (0.6,0)   {red};
  \fill[blue!30]        (2.2,0) rectangle +(1.2,0.7); \node at (2.8,0)   {blue!30};
  \fill[green!50!black] (4.4,0) rectangle +(1.2,0.7); \node at (5,0)     {green!50!black};
  \fill[orange, opacity=0.5] (0,-1.5) rectangle +(1.2,0.7);
  \fill[blue, opacity=0.5]   (0.4,-1.3) rectangle +(1.2,0.7);
                                                      \node at (0.8,-1.5) {opacity=0.5};
  \shade[left color=yellow, right color=red] (2.2,-1.5) rectangle +(1.2,0.7);
                                                      \node at (2.8,-1.5) {left/right color};
  \draw[draw=blue, fill=yellow, very thick] (4.4,-1.5) rectangle +(1.2,0.7);
                                                      \node at (5,-1.5)   {draw=, fill=};
\end{tikzpicture}
\end{document}Coordinates
| Code | Meaning |
|---|---|
(2,1), (2cm,10pt) | 2 units right, 1 up (a unit is 1 cm unless x=, y= change it); with units |
(30:2) | polar: 2 cm in the direction 30° |
++(1,0), +(1,0) | relative to the previous point, moving on; relative without moving |
\coordinate (A) at (1,2); | a named point, used as (A) |
(A |- B), (A -| B) | x of A and y of B; x of B and y of A |
($(A)!0.5!(B)$) | the midpoint (calc library) |
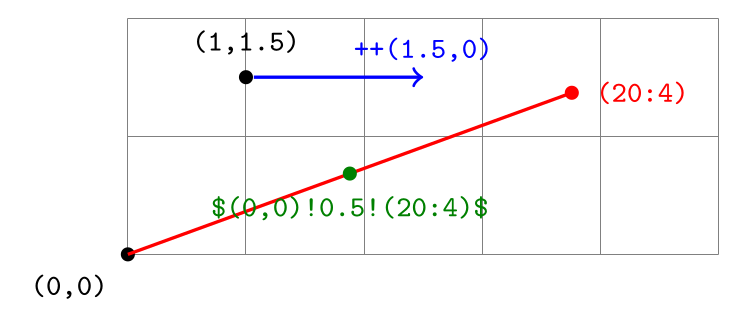
\usepackage{tikz} \usetikzlibrary{calc}\begin{tikzpicture}[font=\scriptsize\ttfamily, dot/.style={circle, fill, inner sep=1.2pt}]
\draw[help lines] (0,0) grid (5,2);
\node[dot, label=below left:{(0,0)}] (O) at (0,0) {};
\node[dot, label=above:{(1,1.5)}] (P) at (1,1.5) {};
\draw[thick, red] (0,0) -- (20:4) node[dot, label=right:{(20:4)}] {};
\draw[thick, blue, ->] (P) -- ++(1.5,0) node[above] {++(1.5,0)};
\node[dot, green!50!black, label={[green!50!black]below:{\$(0,0)!0.5!(20:4)\$}}]
at ($(0,0)!0.5!(20:4)$) {};
\end{tikzpicture}Full document
\documentclass[border=4pt]{standalone}
\usepackage{tikz}
\usetikzlibrary{calc}
\begin{document}
\begin{tikzpicture}[font=\scriptsize\ttfamily, dot/.style={circle, fill, inner sep=1.2pt}]
  \draw[help lines] (0,0) grid (5,2);
  \node[dot, label=below left:{(0,0)}] (O) at (0,0) {};
  \node[dot, label=above:{(1,1.5)}] (P) at (1,1.5) {};
  \draw[thick, red] (0,0) -- (20:4) node[dot, label=right:{(20:4)}] {};
  \draw[thick, blue, ->] (P) -- ++(1.5,0) node[above] {++(1.5,0)};
  \node[dot, green!50!black, label={[green!50!black]below:{\$(0,0)!0.5!(20:4)\$}}]
    at ($(0,0)!0.5!(20:4)$) {};
\end{tikzpicture}
\end{document}\foreach loops
\foreach \x in {1,2,5} {…} repeats the body for each value; {1,...,10} counts in steps of 1, {0,0.5,...,3} in steps of 0.5, {a,...,e} through letters. \foreach \x/\c in {1/red, 2/blue} takes pairs; [count=\i] numbers the items, [evaluate=\x as \y using 2*\x] computes a value, [remember=\x as \last] keeps the previous one. A \foreach directly after another nests the loops. Watch the rounding of fractional steps: {0,0.1,...,0.5} ends at 0.4.
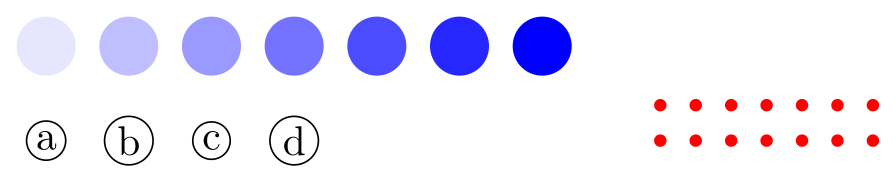
\usepackage{tikz}\begin{tikzpicture}
\foreach \x [evaluate=\x as \c using 15*\x+10] in {0,...,6}
\fill[blue!\c] (0.7*\x,0) circle (0.25);
\foreach \x/\l in {0/a, 1/b, 2/c, 3/d}
\node[draw, circle, inner sep=1pt] at (0.7*\x,-0.8) {\l};
\foreach \x in {0,...,6}
\foreach \y in {0,1}
\fill[red] (5.2+0.3*\x, -0.8+0.3*\y) circle (1.5pt);
\end{tikzpicture}Full document
\documentclass[border=4pt]{standalone}
\usepackage{tikz}
\begin{document}
\begin{tikzpicture}
  \foreach \x [evaluate=\x as \c using 15*\x+10] in {0,...,6}
    \fill[blue!\c] (0.7*\x,0) circle (0.25);
  \foreach \x/\l in {0/a, 1/b, 2/c, 3/d}
    \node[draw, circle, inner sep=1pt] at (0.7*\x,-0.8) {\l};
  \foreach \x in {0,...,6}
    \foreach \y in {0,1}
      \fill[red] (5.2+0.3*\x, -0.8+0.3*\y) circle (1.5pt);
\end{tikzpicture}
\end{document}Styles
\tikzset{box/.style={draw, rounded corners}} defines a style, used as \node[box] {…};. #1 takes a value (box/.style={fill=#1!20} with box=cyan) and box/.default=yellow sets the value when none is given; /.style 2 args takes two. box/.append style={thick} adds to a style, and every node/.style, every path/.style apply to everything. A style defined in the options of a picture or scope stays local to it.

\usepackage{tikz}\tikzset{box/.style={draw, thick, rounded corners, fill=#1!20}, box/.default=yellow}
\begin{tikzpicture}[font=\small]
\node[box] at (0,0) {box};
\node[box=cyan] at (1.8,0) {box=cyan};
\node[box=red, dashed] at (4.2,0) {box=red, dashed};
\end{tikzpicture}Full document
\documentclass[border=4pt]{standalone}
\usepackage{tikz}
\begin{document}
\tikzset{box/.style={draw, thick, rounded corners, fill=#1!20}, box/.default=yellow}
\begin{tikzpicture}[font=\small]
  \node[box]             at (0,0)   {box};
  \node[box=cyan]        at (1.8,0) {box=cyan};
  \node[box=red, dashed] at (4.2,0) {box=red, dashed};
\end{tikzpicture}
\end{document}Frequently asked questions
Is there a printable TikZ cheat sheet?
Yes: the two A4 landscape pages above, as 300 dpi PNG files or as a two-page PDF of the same pictures. Each page is a single tikzpicture whose code is shown on this page, so you can change it and compile your own version.
What is the difference between \draw, \fill and \path?
\draw strokes the outline of the path, \fill fills its inside, \filldraw does both, and \path builds the path without drawing it, which is useful for placing nodes or naming coordinates. All of them take the same options.
What are the default units and line width in TikZ?
Coordinates without units are in centimetres (the x and y vectors are 1 cm), and the default line width is 0.4pt, the same as the thin style. thick is 0.8pt and ultra thick 1.6pt.
How do I put two lines of text in a TikZ node?
Give the node an alignment and break the line with \\: \node[draw, align=center] {first line\\second line};. Without align or text width, the \\ is ignored.
How do I make an arrow head bigger in TikZ?
Load \usetikzlibrary{arrows.meta} and set the size in the tip options: \draw[-{Stealth[length=4mm]}] (0,0) -- (2,0);. A thicker line also gives a larger tip, because the default tip size grows with the line width.
References
- PGF/TikZ manual, §14 Syntax for Path Specificationstikz.dev
- PGF/TikZ manual, §15.3 Drawing a Path (line width, dash patterns)tikz.dev
- PGF/TikZ manual, §16 Arrowstikz.dev
- PGF/TikZ manual, §17 Nodes and Edgestikz.dev
- PGF/TikZ manual, §17.5.3 Advanced Placement Options (positioning)tikz.dev
- PGF/TikZ manual, §13 Specifying Coordinatestikz.dev
- PGF/TikZ manual, §71 Shape Librarytikz.dev
- PGF/TikZ manual, §88 Repeating Things: The Foreach Statementtikz.dev
- PGF/TikZ manual, §12.4.2 Using Styles to Manage How Pictures Looktikz.dev
- xcolor package documentation (CTAN)ctan.org
- pgf package (TikZ) on CTAN, with the full manual as PDFctan.org
The facts on this page were checked against these sources, and every picture is the code with it typeset with TeX Live 2026. Code on this page: CC0 1.0, copy it freely.
Try the code in your browserEvery snippet on this page opens in the free TikZ editor: it is typeset with TeX Live as you type, with errors pointed at their line.
Open the TikZ editor