TikZ timeline: horizontal, vertical, periods and Gantt charts
Quick answer
\foreach do the rest: one loop draws the ticks and year labels (\draw (\i,3pt) -- (\i,-3pt) node[below] {\year};), another places the events at their positions with a short line and a label above. Choose the scale with x=1.6cm (one year per 1.6 cm), and give positions relative to the first year, (\year-2019,0), rather than the year itself, which would be metres away and stop with “Dimension too large”. Vertical timelines, periods and Gantt charts use the same pieces; pgfgantt draws Gantt charts from a few commands.
\usepackage{tikz} \usetikzlibrary{arrows.meta}\begin{tikzpicture}[x=1.6cm]
\draw[thick, -Stealth] (-0.3,0) -- (6.6,0);
% ticks and year labels: position 0 is 2019
\foreach \i [evaluate=\i as \year using int(2019+\i)] in {0,...,6}
\draw (\i,3pt) -- (\i,-3pt) node[below, font=\small] {\year};
% events above the line; 3.5 is the middle of 2022
\foreach \x/\event in {0/Project start, 1.8/First data, 3.5/Paper, 6/Final report}
\draw[blue!70!black, thick] (\x,0) -- (\x,0.7)
node[above, font=\small, text=black] {\event};
\foreach \x in {0, 1.8, 3.5, 6}
\fill[blue!70!black] (\x,0) circle[radius=2.5pt];
\end{tikzpicture}Full document
\documentclass[border=4pt]{standalone}
\usepackage{tikz}
\usetikzlibrary{arrows.meta}
\begin{document}
\begin{tikzpicture}[x=1.6cm]
  \draw[thick, -Stealth] (-0.3,0) -- (6.6,0);
  % ticks and year labels: position 0 is 2019
  \foreach \i [evaluate=\i as \year using int(2019+\i)] in {0,...,6}
    \draw (\i,3pt) -- (\i,-3pt) node[below, font=\small] {\year};
  % events above the line; 3.5 is the middle of 2022
  \foreach \x/\event in {0/Project start, 1.8/First data, 3.5/Paper, 6/Final report}
    \draw[blue!70!black, thick] (\x,0) -- (\x,0.7)
      node[above, font=\small, text=black] {\event};
  \foreach \x in {0, 1.8, 3.5, 6}
    \fill[blue!70!black] (\x,0) circle[radius=2.5pt];
\end{tikzpicture}
\end{document}Contents
A horizontal timeline from two loops
The timeline at the top is three parts. The axis is a single arrow, \draw[thick, -Stealth] (-0.3,0) -- (6.6,0);, slightly longer than the data on both sides. The first loop draws a tick at every year: with x=1.6cm in the picture options, position \i is \i steps of 1.6 cm, and [evaluate=\i as \year using int(2019+\i)] turns the position into the year printed below the tick. The second loop walks position/event pairs; positions need not be whole numbers, so 3.5 is the middle of 2022.
Each event is a line from the axis up to a label, \draw (\x,0) -- (\x,0.7) node[above] {\event};, and the dots are drawn last so they sit on top of both the axis and the lines. Change the scale by changing x alone; all positions follow.
Events above and below the line
When events are close together, alternate them above and below the axis. [count=\i] numbers the items, and \ifodd\i chooses the side: odd items get a line up (\def\dy{9mm}) and a label above, even ones a line down and a label below. The node[event, \side] then uses whichever direction was chosen.
This timeline is to scale: x=2mm makes one year 2 mm, and every position is written \year-1950, so 1953 is 6 mm from the start. The labels have a fixed text width so they wrap instead of running into each other, with align=flush center: plain center balances the lines and hyphenated “dou-ble helix” in a narrow box, while flush center, which the manual recommends for narrow boxes, only breaks between words. Labels on the same side must be at least one text width apart, which here means 12 years; for denser data, use more rows or a vertical timeline.
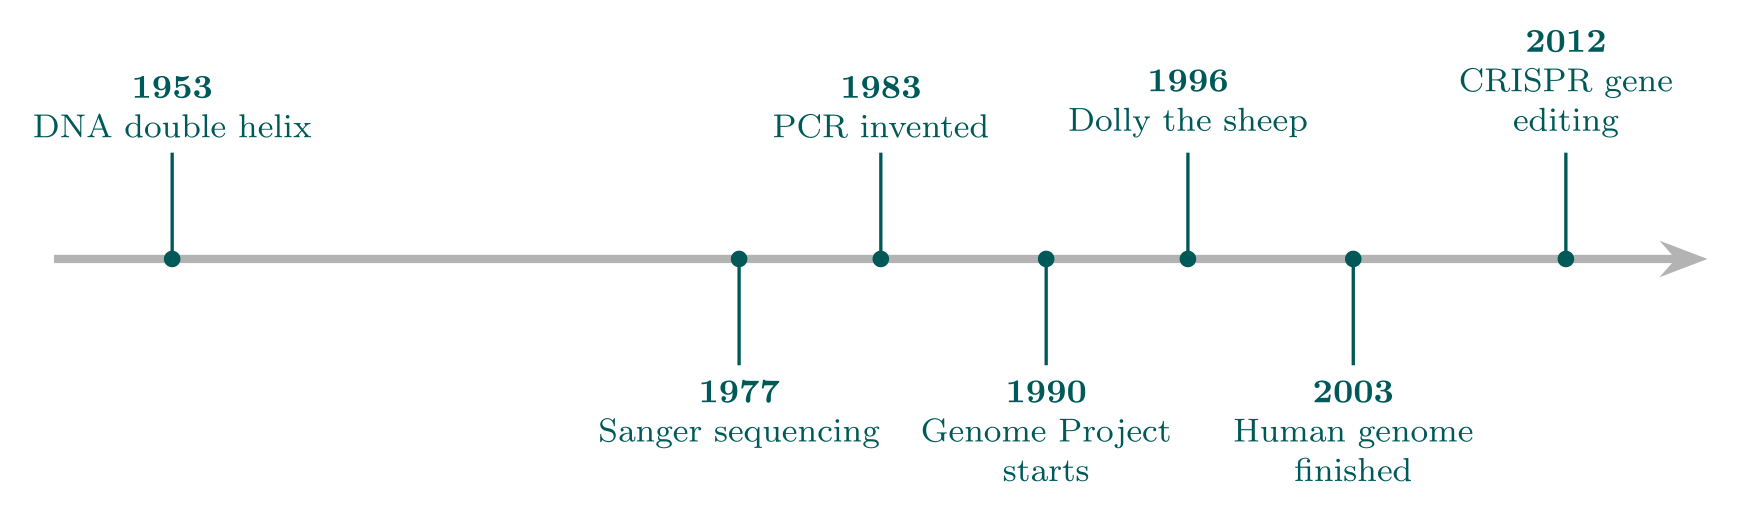
\usepackage{tikz} \usetikzlibrary{arrows.meta}\begin{tikzpicture}[x=2mm, event/.style={text width=24mm, align=flush center, font=\footnotesize}]
\draw[line width=2pt, gray!60, -{Stealth[length=4mm]}] (1948-1950,0) -- (2018-1950,0);
\foreach \year/\what [count=\i] in {1953/DNA double helix, 1977/Sanger sequencing,
1983/PCR invented, 1990/Genome Project starts, 1996/Dolly the sheep,
2003/Human genome finished, 2012/CRISPR gene editing} {
\ifodd\i \def\dy{9mm}\def\side{above}\else \def\dy{-9mm}\def\side{below}\fi
\draw[teal!70!black, thick] (\year-1950,0) -- (\year-1950,\dy)
node[event, \side] {\textbf{\year}\\\what};
\fill[teal!70!black] (\year-1950,0) circle[radius=2pt];
}
\end{tikzpicture}Full document
\documentclass[border=4pt]{standalone}
\usepackage{tikz}
\usetikzlibrary{arrows.meta}
\begin{document}
\begin{tikzpicture}[x=2mm, event/.style={text width=24mm, align=flush center, font=\footnotesize}]
  \draw[line width=2pt, gray!60, -{Stealth[length=4mm]}] (1948-1950,0) -- (2018-1950,0);
  \foreach \year/\what [count=\i] in {1953/DNA double helix, 1977/Sanger sequencing,
      1983/PCR invented, 1990/Genome Project starts, 1996/Dolly the sheep,
      2003/Human genome finished, 2012/CRISPR gene editing} {
    \ifodd\i \def\dy{9mm}\def\side{above}\else \def\dy{-9mm}\def\side{below}\fi
    \draw[teal!70!black, thick] (\year-1950,0) -- (\year-1950,\dy)
      node[event, \side] {\textbf{\year}\\\what};
    \fill[teal!70!black] (\year-1950,0) circle[radius=2pt];
  }
\end{tikzpicture}
\end{document}Real dates, periods and date spans
A period is a bar from its start to its end. Here each row is a lifetime: \foreach \b/\d/\name/\col [count=\r] in {1643/1727/Newton/blue, …} draws a rounded rectangle from (\b-1600,\r-0.35) to (\d-1600,\r+0.35), the name in the middle at ({(\b+\d)/2-1600},\r) (braces around a coordinate that contains parentheses) and the dates to its left. y=-7mm makes the rows run downwards, and alternate century bands drawn first, with \ifodd, make the scale easy to read.
Why -1600 everywhere? TeX cannot handle lengths above about 16 384 pt (5.76 m). With the default unit of 1 cm, the point (2020,0) is 20 m to the right, and TeX stops with “Dimension too large.” Subtracting the first year keeps every number small; with x=0.36mm, 360 years fit in 13 cm.
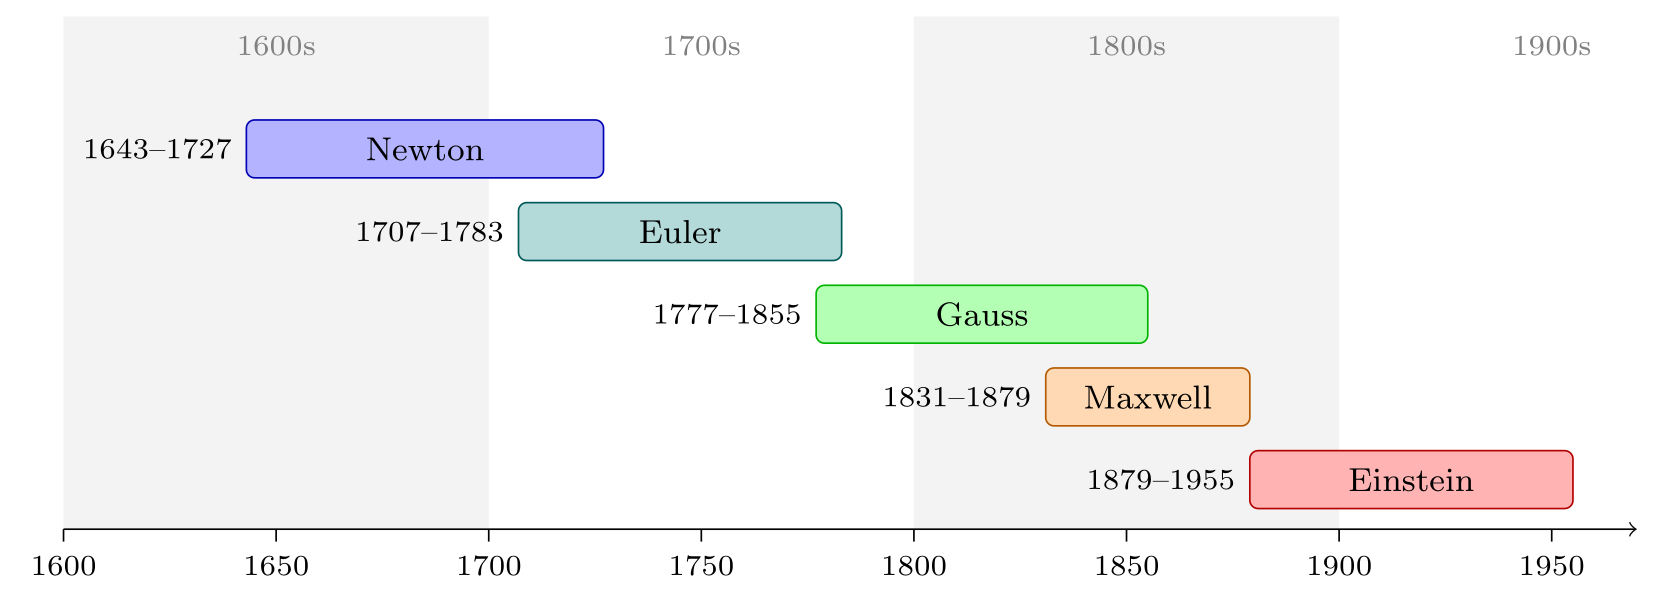
\usepackage{tikz}\begin{tikzpicture}[x=0.36mm, y=-7mm]
% alternating century bands and the axis (positions are years after 1600)
\foreach \c [count=\i] in {1600,1700,1800,1900} {
\ifodd\i \fill[gray!10] (\c-1600,-0.6) rectangle (\c-1500,5.6); \fi
\node[font=\scriptsize, gray] at (\c-1550,-0.25) {\c s};
}
\draw[->] (0,5.6) -- (370,5.6);
\foreach \y in {1600,1650,...,1950}
\draw (\y-1600,5.6) -- ++(0,0.15) node[below, font=\scriptsize] {\y};
% one lifetime per row: born/died/name/colour
\foreach \b/\d/\name/\col [count=\r] in {1643/1727/Newton/blue, 1707/1783/Euler/teal,
1777/1855/Gauss/green, 1831/1879/Maxwell/orange, 1879/1955/Einstein/red} {
\draw[fill=\col!30, draw=\col!70!black, rounded corners=2pt]
(\b-1600,\r-0.35) rectangle (\d-1600,\r+0.35);
\node[font=\footnotesize] at ({(\b+\d)/2-1600},\r) {\name};
\node[left, font=\scriptsize] at (\b-1600,\r) {\b--\d};
}
\end{tikzpicture}Full document
\documentclass[border=4pt]{standalone}
\usepackage{tikz}
\begin{document}
\begin{tikzpicture}[x=0.36mm, y=-7mm]
  % alternating century bands and the axis (positions are years after 1600)
  \foreach \c [count=\i] in {1600,1700,1800,1900} {
    \ifodd\i \fill[gray!10] (\c-1600,-0.6) rectangle (\c-1500,5.6); \fi
    \node[font=\scriptsize, gray] at (\c-1550,-0.25) {\c s};
  }
  \draw[->] (0,5.6) -- (370,5.6);
  \foreach \y in {1600,1650,...,1950}
    \draw (\y-1600,5.6) -- ++(0,0.15) node[below, font=\scriptsize] {\y};
  % one lifetime per row: born/died/name/colour
  \foreach \b/\d/\name/\col [count=\r] in {1643/1727/Newton/blue, 1707/1783/Euler/teal,
      1777/1855/Gauss/green, 1831/1879/Maxwell/orange, 1879/1955/Einstein/red} {
    \draw[fill=\col!30, draw=\col!70!black, rounded corners=2pt]
      (\b-1600,\r-0.35) rectangle (\d-1600,\r+0.35);
    \node[font=\footnotesize] at ({(\b+\d)/2-1600},\r) {\name};
    \node[left, font=\scriptsize] at (\b-1600,\r) {\b--\d};
  }
\end{tikzpicture}
\end{document}Vertical timelines
A vertical timeline suits CVs, histories and protocols, where each event needs a sentence. y=-14mm turns item numbers into rows going down, so [count=\i from 0] places the items at (0,0), (0,1), … The date is a node left=5mm of the dot and the description a node right=5mm with a text width, so long descriptions wrap. The dots are white-filled circles drawn over the line.
Each list item has three fields, when/role/description, separated by slashes, and the items are separated by commas, so a comma inside a description must be hidden in braces: Battery lab{,} Uppsala. Without them, “Uppsala” becomes an extra item and fills every field of a fourth entry.
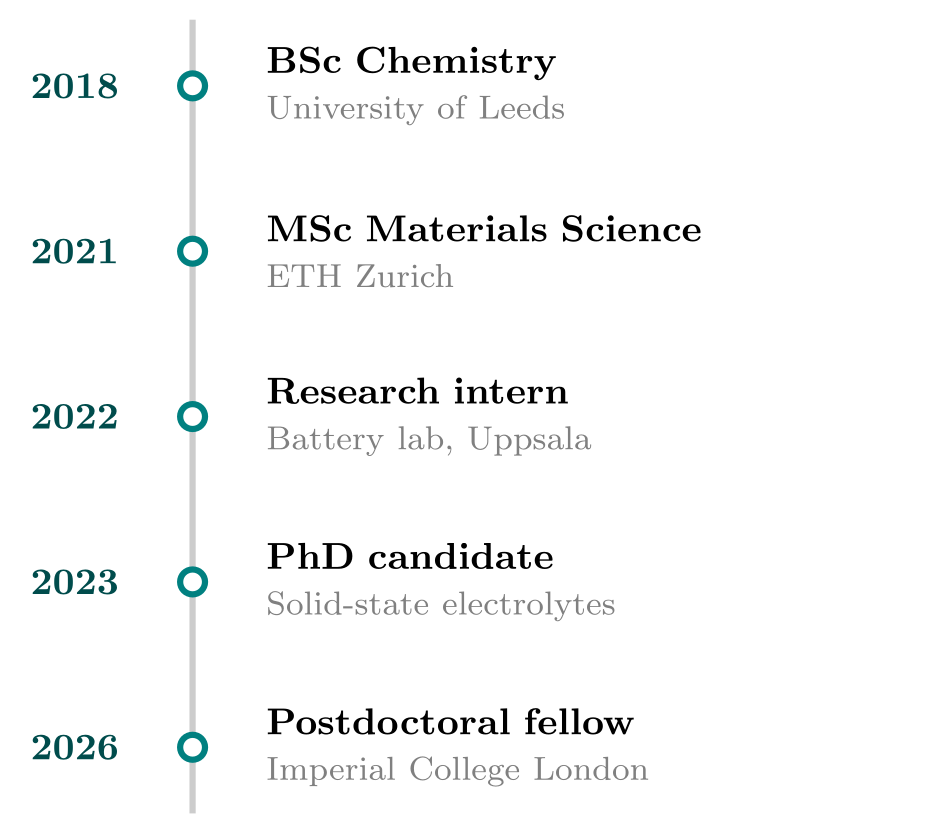
\usepackage{tikz}\begin{tikzpicture}[y=-14mm]
\draw[line width=1.5pt, gray!40] (0,-0.4) -- (0,4.4);
\foreach \when/\role/\desc [count=\i from 0] in {
2018/BSc Chemistry/University of Leeds,
2021/MSc Materials Science/ETH Zurich,
2022/Research intern/Battery lab{,} Uppsala,
2023/PhD candidate/Solid-state electrolytes,
2026/Postdoctoral fellow/Imperial College London} {
\filldraw[fill=white, draw=teal, line width=1.5pt] (0,\i) circle[radius=3pt];
\node[left=5mm, font=\small\bfseries, text=teal!60!black] at (0,\i) {\when};
\node[right=5mm, text width=55mm, align=left, font=\small] at (0,\i)
{\textbf{\role}\\\footnotesize\textcolor{gray}{\desc}};
}
\end{tikzpicture}Full document
\documentclass[border=4pt]{standalone}
\usepackage{tikz}
\begin{document}
\begin{tikzpicture}[y=-14mm]
  \draw[line width=1.5pt, gray!40] (0,-0.4) -- (0,4.4);
  \foreach \when/\role/\desc [count=\i from 0] in {
      2018/BSc Chemistry/University of Leeds,
      2021/MSc Materials Science/ETH Zurich,
      2022/Research intern/Battery lab{,} Uppsala,
      2023/PhD candidate/Solid-state electrolytes,
      2026/Postdoctoral fellow/Imperial College London} {
    \filldraw[fill=white, draw=teal, line width=1.5pt] (0,\i) circle[radius=3pt];
    \node[left=5mm, font=\small\bfseries, text=teal!60!black] at (0,\i) {\when};
    \node[right=5mm, text width=55mm, align=left, font=\small] at (0,\i)
      {\textbf{\role}\\\footnotesize\textcolor{gray}{\desc}};
  }
\end{tikzpicture}
\end{document}Milestones, phases and a today marker
A project timeline usually has months on the axis, phases as coloured bands and milestones as diamonds. The months come from \foreach \m [count=\i from 0] in {Jan,Feb,…}, with each name centred between two ticks at \i+0.5. Each phase is a node with anchor=south west at its start and a minimum width computed from its length, {(\e-\s)*11mm}, so the name sits inside the band. The milestones are small diamond nodes (shapes.geometric) on the top edge with a label above, and a dashed red line marks today.

\usepackage{tikz} \usetikzlibrary{shapes.geometric}\begin{tikzpicture}[x=11mm,
milestone/.style={diamond, draw=black, fill=yellow!70, inner sep=2.2pt}]
% month ticks and names: position 0 is the start of January
\foreach \m [count=\i from 0] in {Jan,Feb,Mar,Apr,May,Jun,Jul,Aug,Sep,Oct,Nov,Dec} {
\draw (\i,0) -- (\i,-1mm);
\node[below, font=\scriptsize] at (\i+0.5,0) {\m};
}
\draw (12,0) -- (12,-1mm);
% phases: start/end in months, name, colour
\foreach \s/\e/\name/\col in {0/2.5/Planning/blue, 2.5/8.5/Development/teal,
8.5/10.5/Testing/orange, 10.5/12/Launch/red}
\node[fill=\col!30, minimum height=5mm, inner sep=0pt, anchor=south west,
minimum width={(\e-\s)*11mm}, font=\scriptsize\bfseries, text=\col!50!black]
at (\s,0) {\name};
\draw (0,0) -- (12,0);
% milestones on the top edge of the phases, labels above
\foreach \x/\what in {2.5/Kick-off review, 5.9/Prototype, 8.5/Feature freeze, 11.6/Release}
\node[milestone, label={[font=\footnotesize]above:\what}] at (\x,5mm) {};
% today
\draw[red, dashed, thick] (6.8,-6mm) -- (6.8,13mm) node[above, font=\scriptsize] {today};
\end{tikzpicture}Full document
\documentclass[border=4pt]{standalone}
\usepackage{tikz}
\usetikzlibrary{shapes.geometric}
\begin{document}
\begin{tikzpicture}[x=11mm,
    milestone/.style={diamond, draw=black, fill=yellow!70, inner sep=2.2pt}]
  % month ticks and names: position 0 is the start of January
  \foreach \m [count=\i from 0] in {Jan,Feb,Mar,Apr,May,Jun,Jul,Aug,Sep,Oct,Nov,Dec} {
    \draw (\i,0) -- (\i,-1mm);
    \node[below, font=\scriptsize] at (\i+0.5,0) {\m};
  }
  \draw (12,0) -- (12,-1mm);
  % phases: start/end in months, name, colour
  \foreach \s/\e/\name/\col in {0/2.5/Planning/blue, 2.5/8.5/Development/teal,
                                8.5/10.5/Testing/orange, 10.5/12/Launch/red}
    \node[fill=\col!30, minimum height=5mm, inner sep=0pt, anchor=south west,
          minimum width={(\e-\s)*11mm}, font=\scriptsize\bfseries, text=\col!50!black]
      at (\s,0) {\name};
  \draw (0,0) -- (12,0);
  % milestones on the top edge of the phases, labels above
  \foreach \x/\what in {2.5/Kick-off review, 5.9/Prototype, 8.5/Feature freeze, 11.6/Release}
    \node[milestone, label={[font=\footnotesize]above:\what}] at (\x,5mm) {};
  % today
  \draw[red, dashed, thick] (6.8,-6mm) -- (6.8,13mm) node[above, font=\scriptsize] {today};
\end{tikzpicture}
\end{document}A Gantt chart in plain TikZ
A Gantt chart is a timeline with one row per task. With x=6mm (one week) and y=-7mm (one row), a task from week \s to week \e is the rectangle from (\s-1,\r-0.3) to (\e,\r+0.3), and the task names are nodes to the left of x=0. The grid is one vertical line per week; the dependency links go from the end of one bar, right and down onto the next with -|. Writing it by hand takes a few more lines than a package, but every element is ordinary TikZ you can restyle, annotate or combine with other drawings.
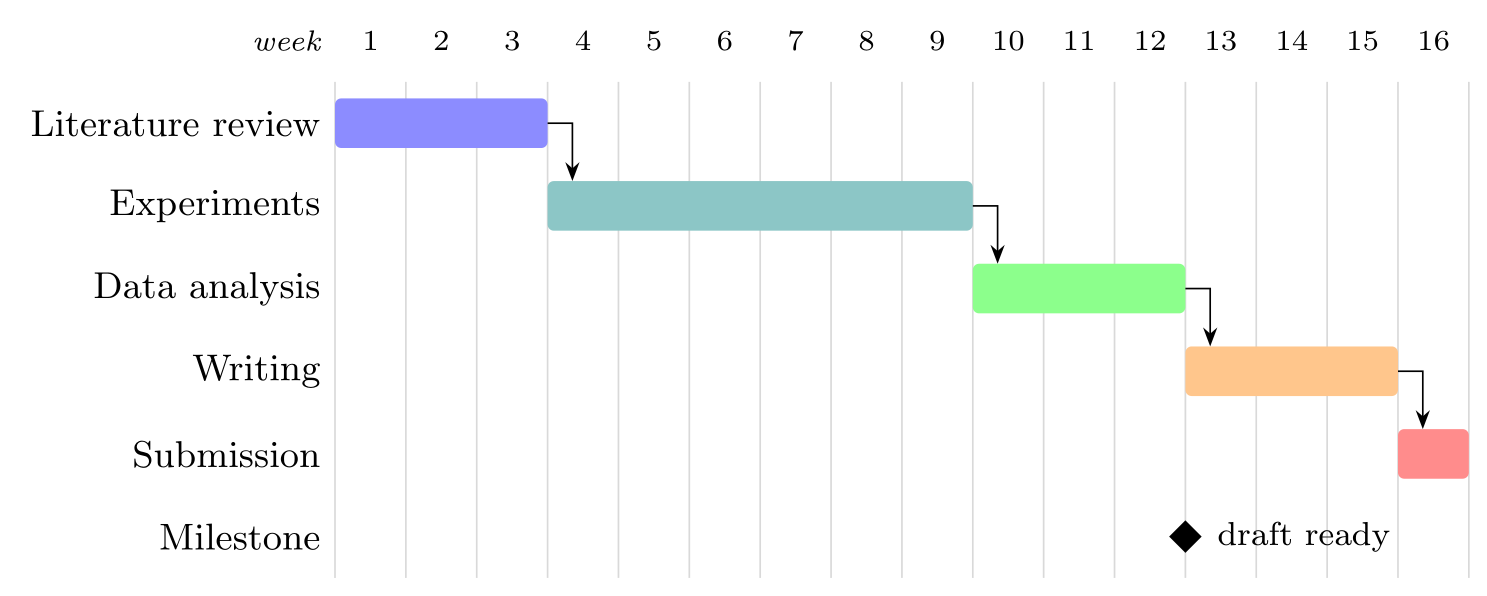
\usepackage{tikz} \usetikzlibrary{arrows.meta, shapes.geometric}\begin{tikzpicture}[x=6mm, y=-7mm, font=\small]
% week grid and header (weeks 1..16)
\foreach \w in {1,...,16} {
\node[font=\scriptsize] at (\w-0.5,0) {\w};
\draw[gray!30] (\w,0.5) -- (\w,6.5);
}
\draw[gray!30] (0,0.5) -- (0,6.5);
\node[left, font=\scriptsize\itshape] at (0,0) {week};
% tasks: row/first week/last week/name/colour
\foreach \r/\s/\e/\name/\col in {1/1/3/Literature review/blue, 2/4/9/Experiments/teal,
3/10/12/Data analysis/green, 4/13/15/Writing/orange, 5/16/16/Submission/red} {
\node[left] at (0,\r) {\name};
\fill[\col!45, rounded corners=1.5pt] (\s-1,\r-0.3) rectangle (\e,\r+0.3);
}
% finish-to-start links: from the end of one bar down onto the next
\foreach \r/\e in {1/3, 2/9, 3/12, 4/15}
\draw[-{Stealth[length=1.6mm]}] (\e,\r) -| (\e+0.35,\r+0.7);
% a milestone
\node[left] at (0,6) {Milestone};
\node[diamond, fill=black, inner sep=2pt, label=right:{\footnotesize draft ready}] at (12,6) {};
\end{tikzpicture}Full document
\documentclass[border=4pt]{standalone}
\usepackage{tikz}
\usetikzlibrary{arrows.meta, shapes.geometric}
\begin{document}
\begin{tikzpicture}[x=6mm, y=-7mm, font=\small]
  % week grid and header (weeks 1..16)
  \foreach \w in {1,...,16} {
    \node[font=\scriptsize] at (\w-0.5,0) {\w};
    \draw[gray!30] (\w,0.5) -- (\w,6.5);
  }
  \draw[gray!30] (0,0.5) -- (0,6.5);
  \node[left, font=\scriptsize\itshape] at (0,0) {week};
  % tasks: row/first week/last week/name/colour
  \foreach \r/\s/\e/\name/\col in {1/1/3/Literature review/blue, 2/4/9/Experiments/teal,
      3/10/12/Data analysis/green, 4/13/15/Writing/orange, 5/16/16/Submission/red} {
    \node[left] at (0,\r) {\name};
    \fill[\col!45, rounded corners=1.5pt] (\s-1,\r-0.3) rectangle (\e,\r+0.3);
  }
  % finish-to-start links: from the end of one bar down onto the next
  \foreach \r/\e in {1/3, 2/9, 3/12, 4/15}
    \draw[-{Stealth[length=1.6mm]}] (\e,\r) -| (\e+0.35,\r+0.7);
  % a milestone
  \node[left] at (0,6) {Milestone};
  \node[diamond, fill=black, inner sep=2pt, label=right:{\footnotesize draft ready}] at (12,6) {};
\end{tikzpicture}
\end{document}Gantt charts with pgfgantt
The pgfgantt package (version 5.0a on CTAN, 2024) builds Gantt charts from commands. \begin{ganttchart}[options]{1}{16} sets up 16 time slots (it adds the tikzpicture itself if needed); \gantttitle{2026 (weeks)}{16} and \gantttitlelist{1,...,16}{1} make header rows; \ganttbar{label}{start}{end}, \ganttgroup and \ganttmilestone add elements; and \\ starts the next row. The \ganttlinked… versions also draw a link from the previous element, and \ganttlink{elem2}{elem3} links any two elements, which are named elem0, elem1, … in order unless you set name=.
Useful keys: hgrid and vgrid (both off by default) draw the grid; x unit (initially 0.5 cm), y unit title and y unit chart (1 cm) set the cell size; title height (0.6) and bar height (0.4) are fractions of a row; bar/.append style, group/.append style and milestone/.append style change the colours; time slot format=isodate lets you write dates such as 2026-03-14 instead of slot numbers; and today=… draws a today line. pgfgantt does not complain about a bar outside the chart’s range: it simply draws past the edge, so check the start and end slots.
For a plain horizontal timeline there is also the chronology package (version 2.0, built on TikZ), but the loops above give more control over labels and layout.
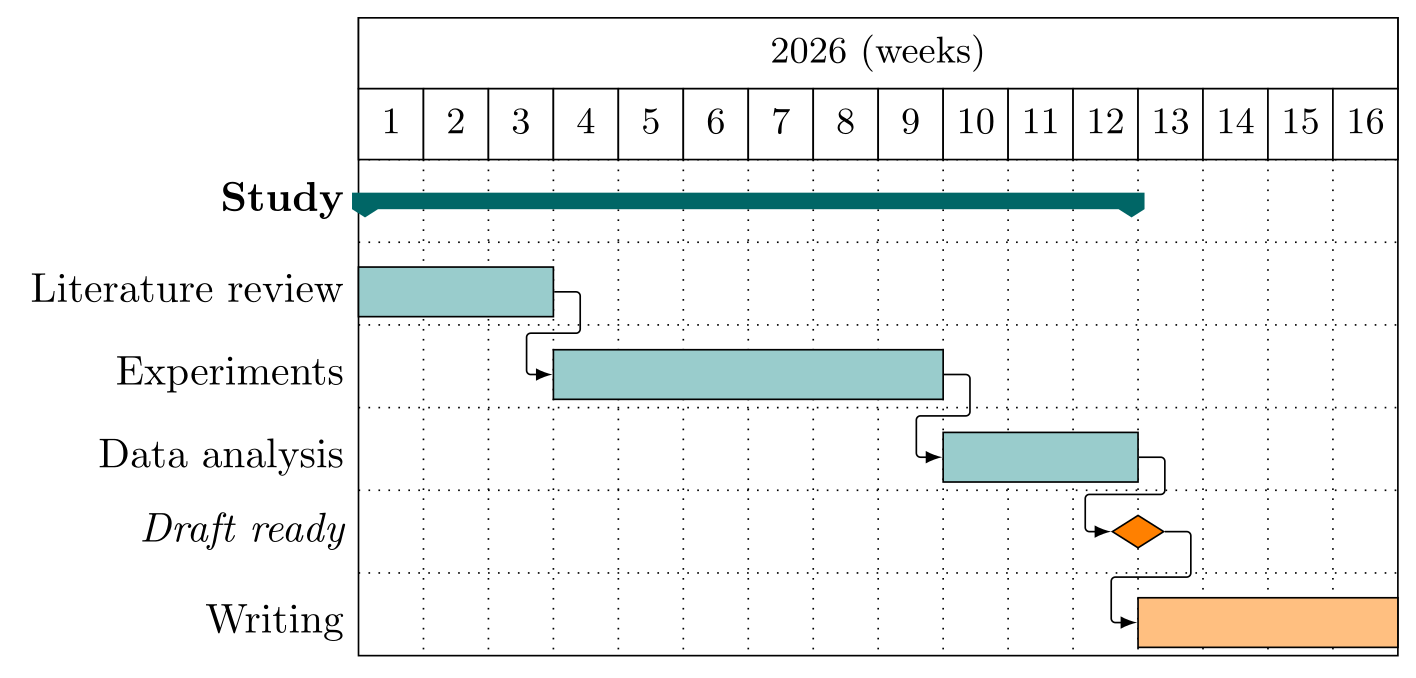
\usepackage{tikz} \usepackage{pgfgantt}\begin{ganttchart}[hgrid, vgrid, x unit=5.5mm, y unit title=6mm, title height=1,
y unit chart=7mm, bar height=0.6, bar/.append style={fill=teal!40},
group/.append style={fill=teal!80!black}, milestone/.append style={fill=orange}]{1}{16}
\gantttitle{2026 (weeks)}{16} \\
\gantttitlelist{1,...,16}{1} \\
\ganttgroup{Study}{1}{12} \\
\ganttbar{Literature review}{1}{3} \\
\ganttlinkedbar{Experiments}{4}{9} \\
\ganttlinkedbar{Data analysis}{10}{12} \\
\ganttlinkedmilestone{Draft ready}{12} \\
\ganttlinkedbar[bar/.append style={fill=orange!50}]{Writing}{13}{16}
\end{ganttchart}Full document
\documentclass[border=4pt]{standalone}
\usepackage{tikz}
\usepackage{pgfgantt}
\begin{document}
\begin{ganttchart}[hgrid, vgrid, x unit=5.5mm, y unit title=6mm, title height=1,
    y unit chart=7mm, bar height=0.6, bar/.append style={fill=teal!40},
    group/.append style={fill=teal!80!black}, milestone/.append style={fill=orange}]{1}{16}
  \gantttitle{2026 (weeks)}{16} \\
  \gantttitlelist{1,...,16}{1} \\
  \ganttgroup{Study}{1}{12} \\
  \ganttbar{Literature review}{1}{3} \\
  \ganttlinkedbar{Experiments}{4}{9} \\
  \ganttlinkedbar{Data analysis}{10}{12} \\
  \ganttlinkedmilestone{Draft ready}{12} \\
  \ganttlinkedbar[bar/.append style={fill=orange!50}]{Writing}{13}{16}
\end{ganttchart}
\end{document}Common errors and how to fix them
| LaTeX says (or you see) | Cause and fix |
|---|---|
| Dimension too large. | A coordinate is beyond TeX’s limit of about 16384 pt (5.76 m), typically a year used directly, as in (2020,0) with 1 cm units. Subtract the first year, (\year-1950,0), and choose the scale with x=…. |
| Package tikz Error: You need to load a decoration library. | A brace (decorate, decoration={brace}) for marking a period needs \usetikzlibrary{decorations.pathreplacing}. |
| An extra event appears with the same text in every field (no error) | A comma inside a \foreach item ends the item. Hide it in braces: 2022/Intern/Battery lab{,} Uppsala. |
| Labels overlap or long words are hyphenated (no error) | Give labels a text width with align=flush center, alternate them above and below, or switch to a vertical timeline where each event has its own row. |
| A pgfgantt bar sticks out of the chart (no error) | Its start or end slot lies outside the range given to \begin{ganttchart}{first}{last}. Widen the range or correct the slot numbers. |
Frequently asked questions
How do I make a timeline in LaTeX with TikZ?
Draw the axis as an arrow, add ticks and years with a \foreach loop, and place each event with a short line and a node: \draw (\x,0) -- (\x,0.7) node[above] {Event};. Set the scale with x=1.6cm and write positions relative to the first year.
How do I make a vertical timeline in TikZ?
Use y=-14mm so that item numbers become rows going down, draw a vertical line, and in a \foreach loop put a dot at (0,\i), the date in a node left of it and the description in a node right of it with a text width so it wraps.
How do I put timeline events alternately above and below the line?
Number the items with [count=\i] and use \ifodd\i to set the direction: \ifodd\i \def\side{above}\def\dy{9mm}\else \def\side{below}\def\dy{-9mm}\fi, then draw (\x,0) -- (\x,\dy) node[\side] {…}.
Why does my timeline stop with "Dimension too large"?
Because a year was used as a coordinate: (2020,0) is 20 m away at the default 1 cm per unit, beyond TeX’s limit of about 5.76 m. Write (\year-2000,0) instead, or use a small unit such as x=1mm together with subtracting the start year.
How do I draw a Gantt chart in LaTeX?
Use pgfgantt: \begin{ganttchart}[hgrid, vgrid]{1}{12}, a \gantttitlelist row, then \ganttbar{Task}{start}{end} \\ for each task, \ganttmilestone for milestones and \ganttlinkedbar or \ganttlink for dependencies. In plain TikZ, draw one rectangle per task on a week grid.
Is there a LaTeX package for timelines?
chronology (version 2.0) draws simple horizontal timelines and pgfgantt (5.0a) draws Gantt charts, both on top of TikZ. For anything else, such as events above and below, periods or vertical timelines, a few TikZ \foreach loops as on this page give full control.
References
- PGF/TikZ manual, §88 Repeating Things: The Foreach Statement (count, evaluate)tikz.dev
- PGF/TikZ manual, §17.4.3 Text Parameters: Alignment and Width for Multi-Line Texttikz.dev
- PGF/TikZ manual, §14.4 The Rectangle Operationtikz.dev
- PGF/TikZ manual, §17.10 The Label and Pin Optionstikz.dev
- PGF/TikZ manual, §71.3 Geometric Shapes (diamond)tikz.dev
- pgfgantt 5.0a on CTAN (2024-06-19; manual: pgfgantt-doc.pdf)ctan.org
- pgfgantt manual on tikz.dev, §2.7 Predefined Chart Elementstikz.dev
- chronology 2.0 on CTANctan.org
- pgf package (TikZ) 3.1.12 on CTAN, with the full manual as PDFctan.org
The facts on this page were checked against these sources, and every picture is the code with it typeset with TeX Live 2026. Code on this page: CC0 1.0, copy it freely.
Try the code in your browserEvery snippet on this page opens in the free TikZ editor: it is typeset with TeX Live as you type, with errors pointed at their line.
Open the TikZ editor