Raman spectroscopy: how it works, how to read a Raman spectrum and what it tells you about materials
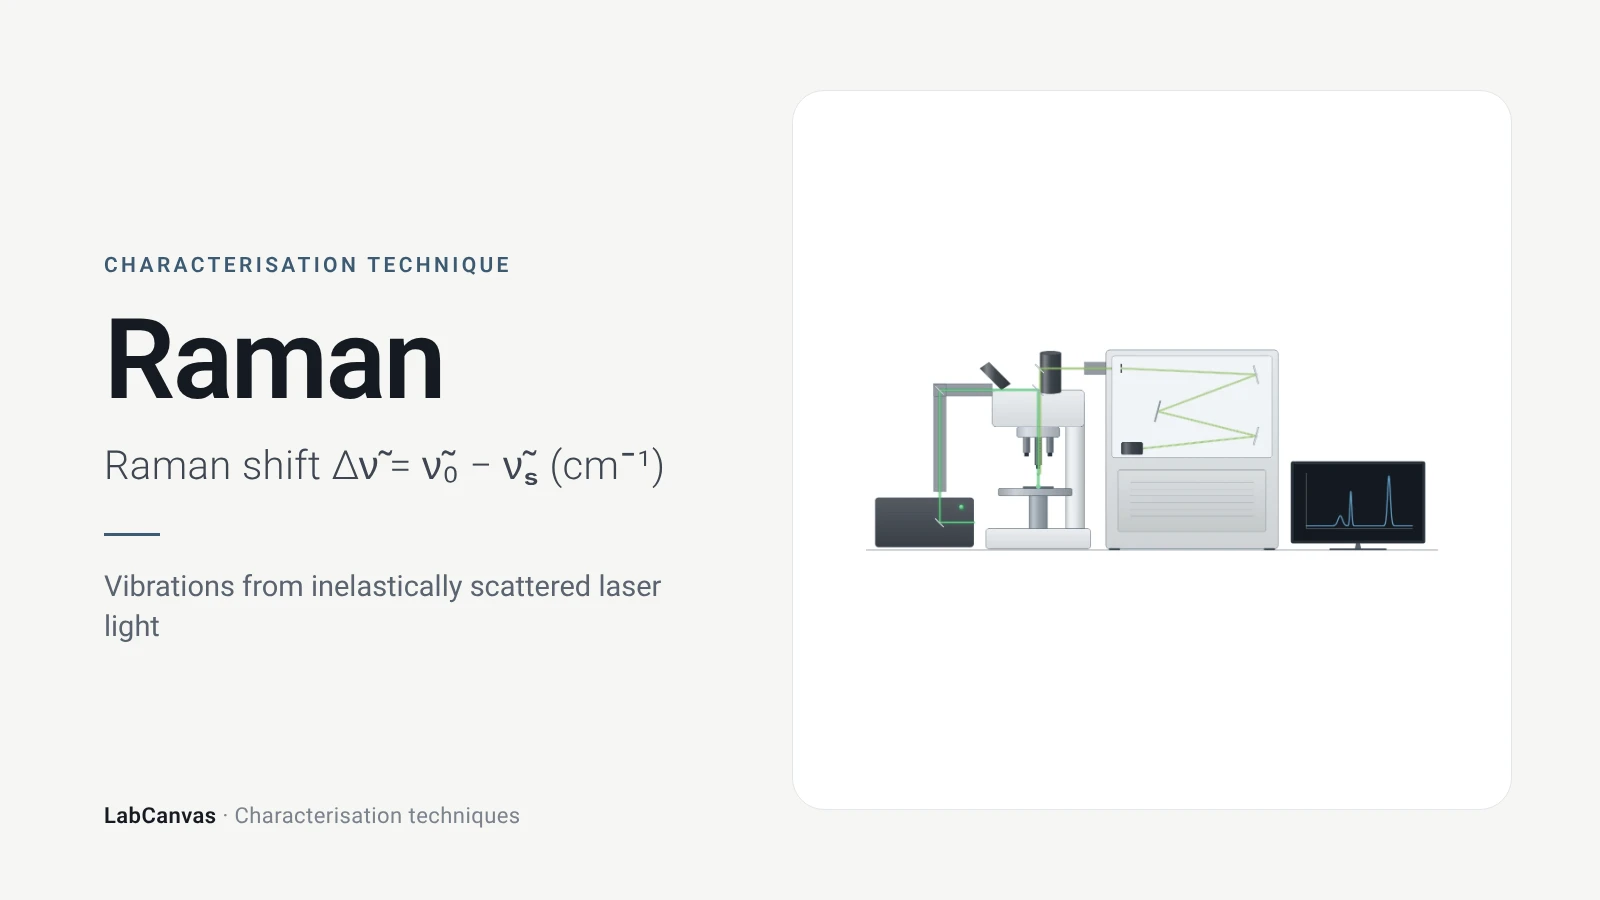
Raman spectroscopy shines a monochromatic laser on a sample and measures the small fraction of light that is scattered inelastically, with its energy shifted up or down by molecular vibrations or lattice phonons (Jones et al. 2019; Silver et al. 2019). The spectrum is plotted as the Raman shift in cm⁻¹, the difference between the laser and scattered wavenumbers, and each band corresponds to a vibration (Jones et al. 2019). It identifies compounds and phases non-destructively, works in water (Butler et al. 2016), and for graphene its D, G and 2D bands give the number of layers and the defect density (Ferrari et al. 2006; Cançado et al. 2011).
Contents
Raman spectroscopy at a glance
| Probe | Monochromatic laser light, most often at 785 nm; 532 nm and 1064 nm are also common (Jones et al. 2019) |
|---|---|
| Signal measured | Inelastically scattered light, shifted in energy by vibrations or phonons; most light is scattered elastically (Rayleigh) (Jones et al. 2019) |
| Units | Raman shift from the laser line, in cm⁻¹; for Stokes scattering it equals the vibration wavenumber (Jones et al. 2019) |
| Selection rule | Raman-active vibrations modulate the polarisability; in centrosymmetric systems Raman- and IR-active modes are mutually exclusive (Jones et al. 2019) |
| Stokes vs anti-Stokes | Stokes (red-shifted) lines are stronger than anti-Stokes (blue-shifted) lines because of thermal populations (Jones et al. 2019) |
| Main information | Chemical composition and structure; in 2D materials, layer number, doping, disorder, strain and phonons (Jones et al. 2019; Ferrari & Basko 2013) |
| Graphene bands | G ~1580 cm⁻¹, 2D (G′) ~2700 cm⁻¹, defect-activated D ~1350 cm⁻¹ (Silver et al. 2019) |
| Spatial resolution | Laser focus limited to at least half the wavelength, ~250 nm for visible light; tip-enhanced Raman reaches 10–30 nm (Jones et al. 2019) |
| Sensitivity | Spontaneous Raman scattering is very weak; SERS can enhance it by several orders of magnitude (Jones et al. 2019) |
| Typical sample | Materials, polymers, minerals, semiconductors, tissues and biofluids; usually little preparation and no labels (Butler et al. 2016) |
| First observation | Predicted by Smekal in 1923 and observed by Raman and Krishnan in 1928 (Jones et al. 2019) |
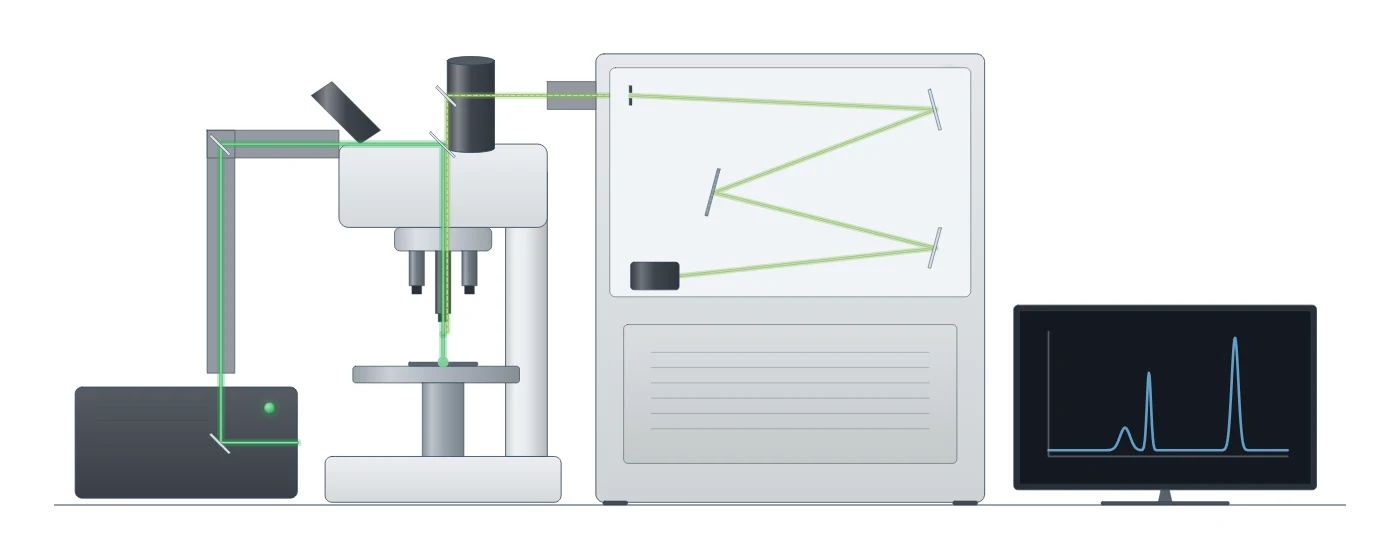
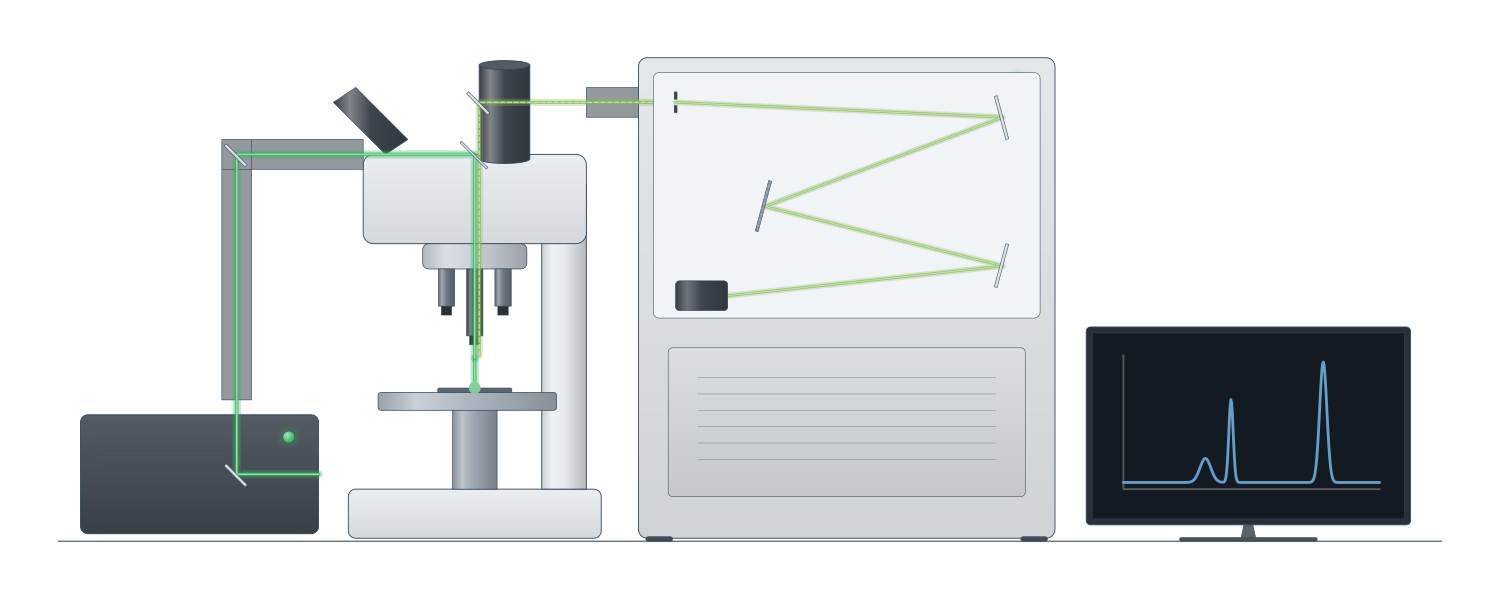
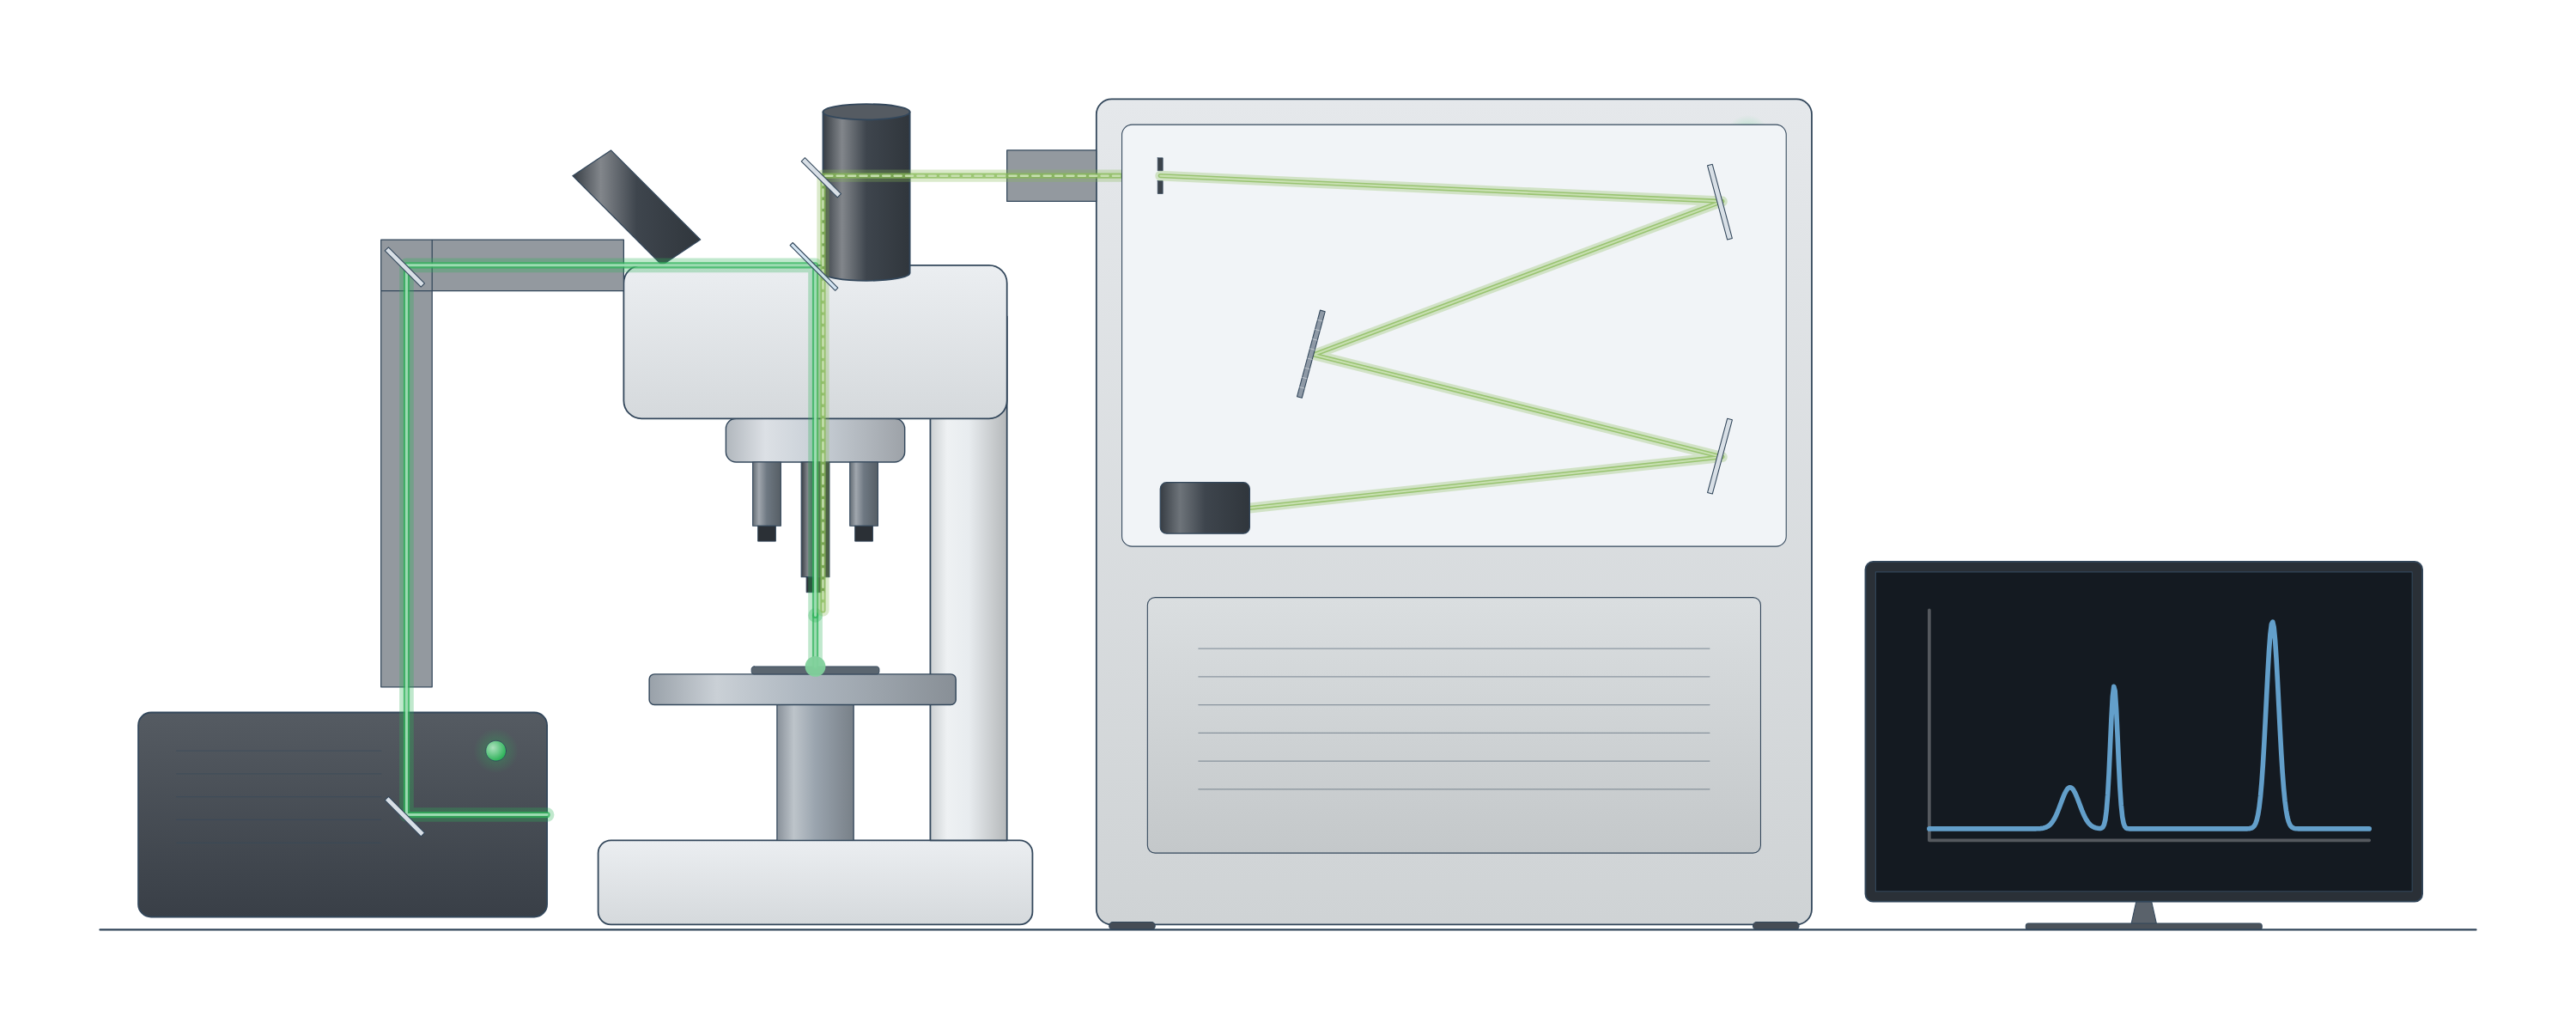
Raman spectroscopy instrument drawing (high-resolution SVG)
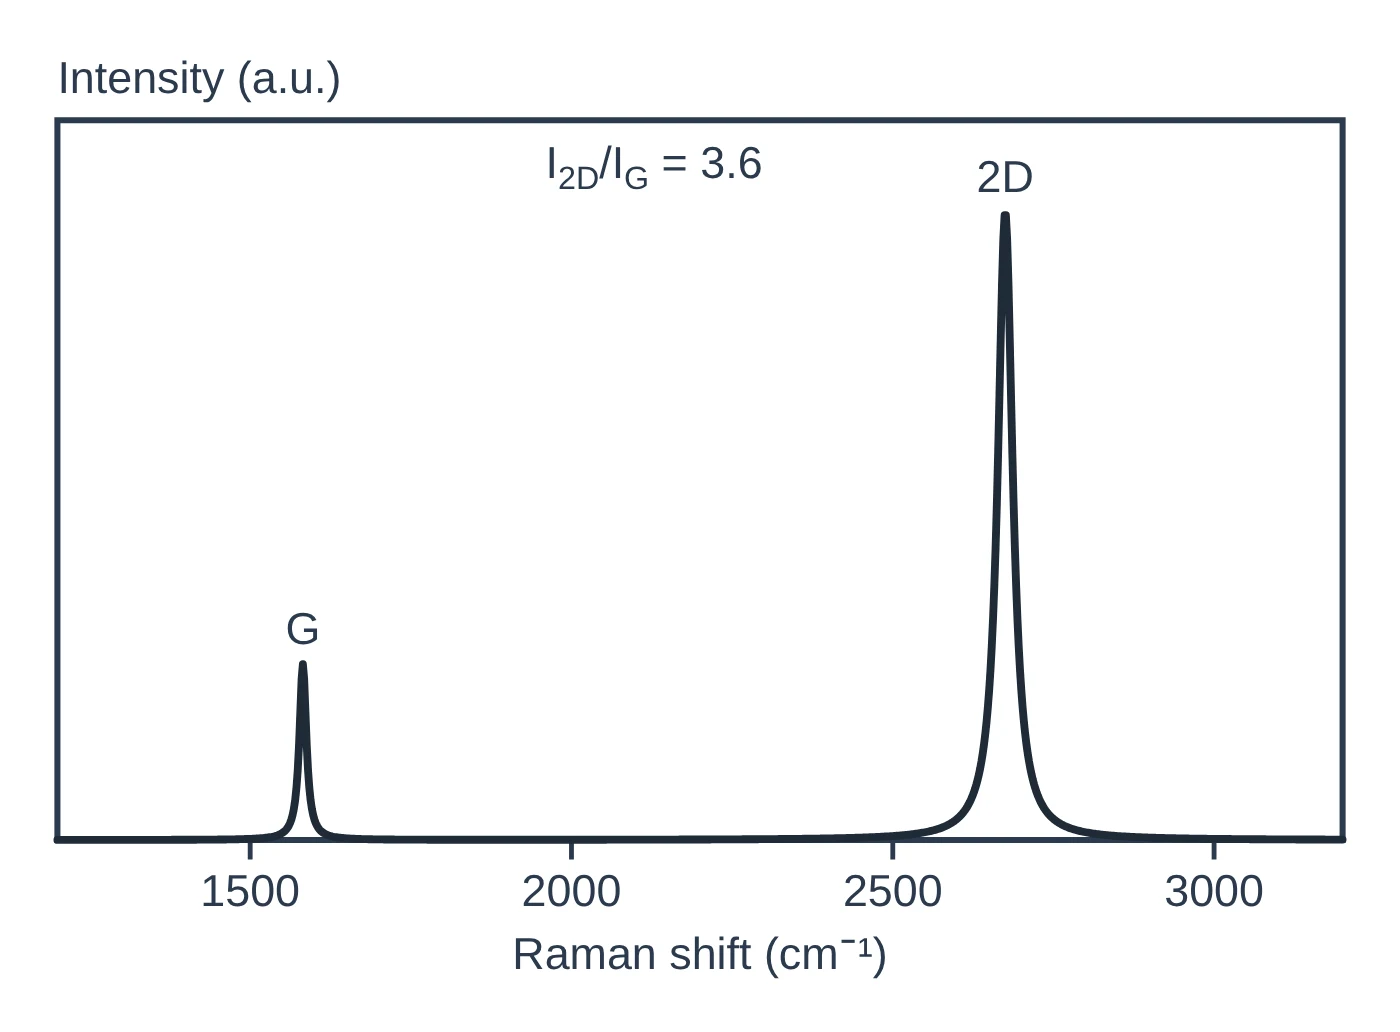
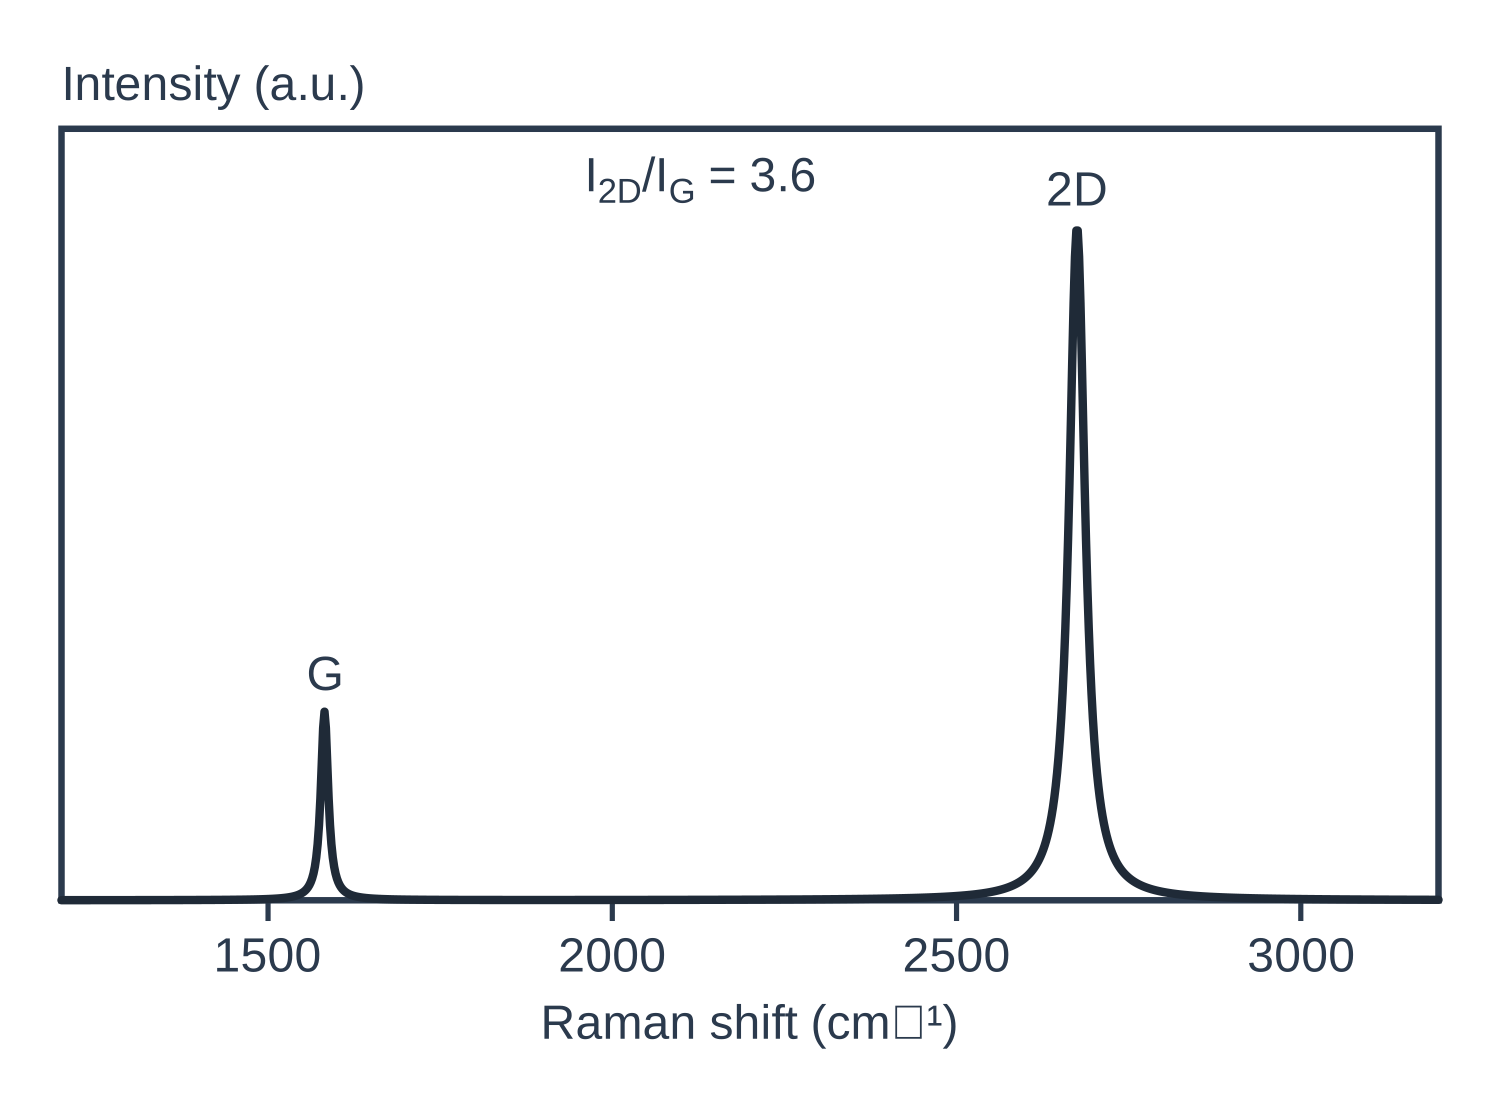
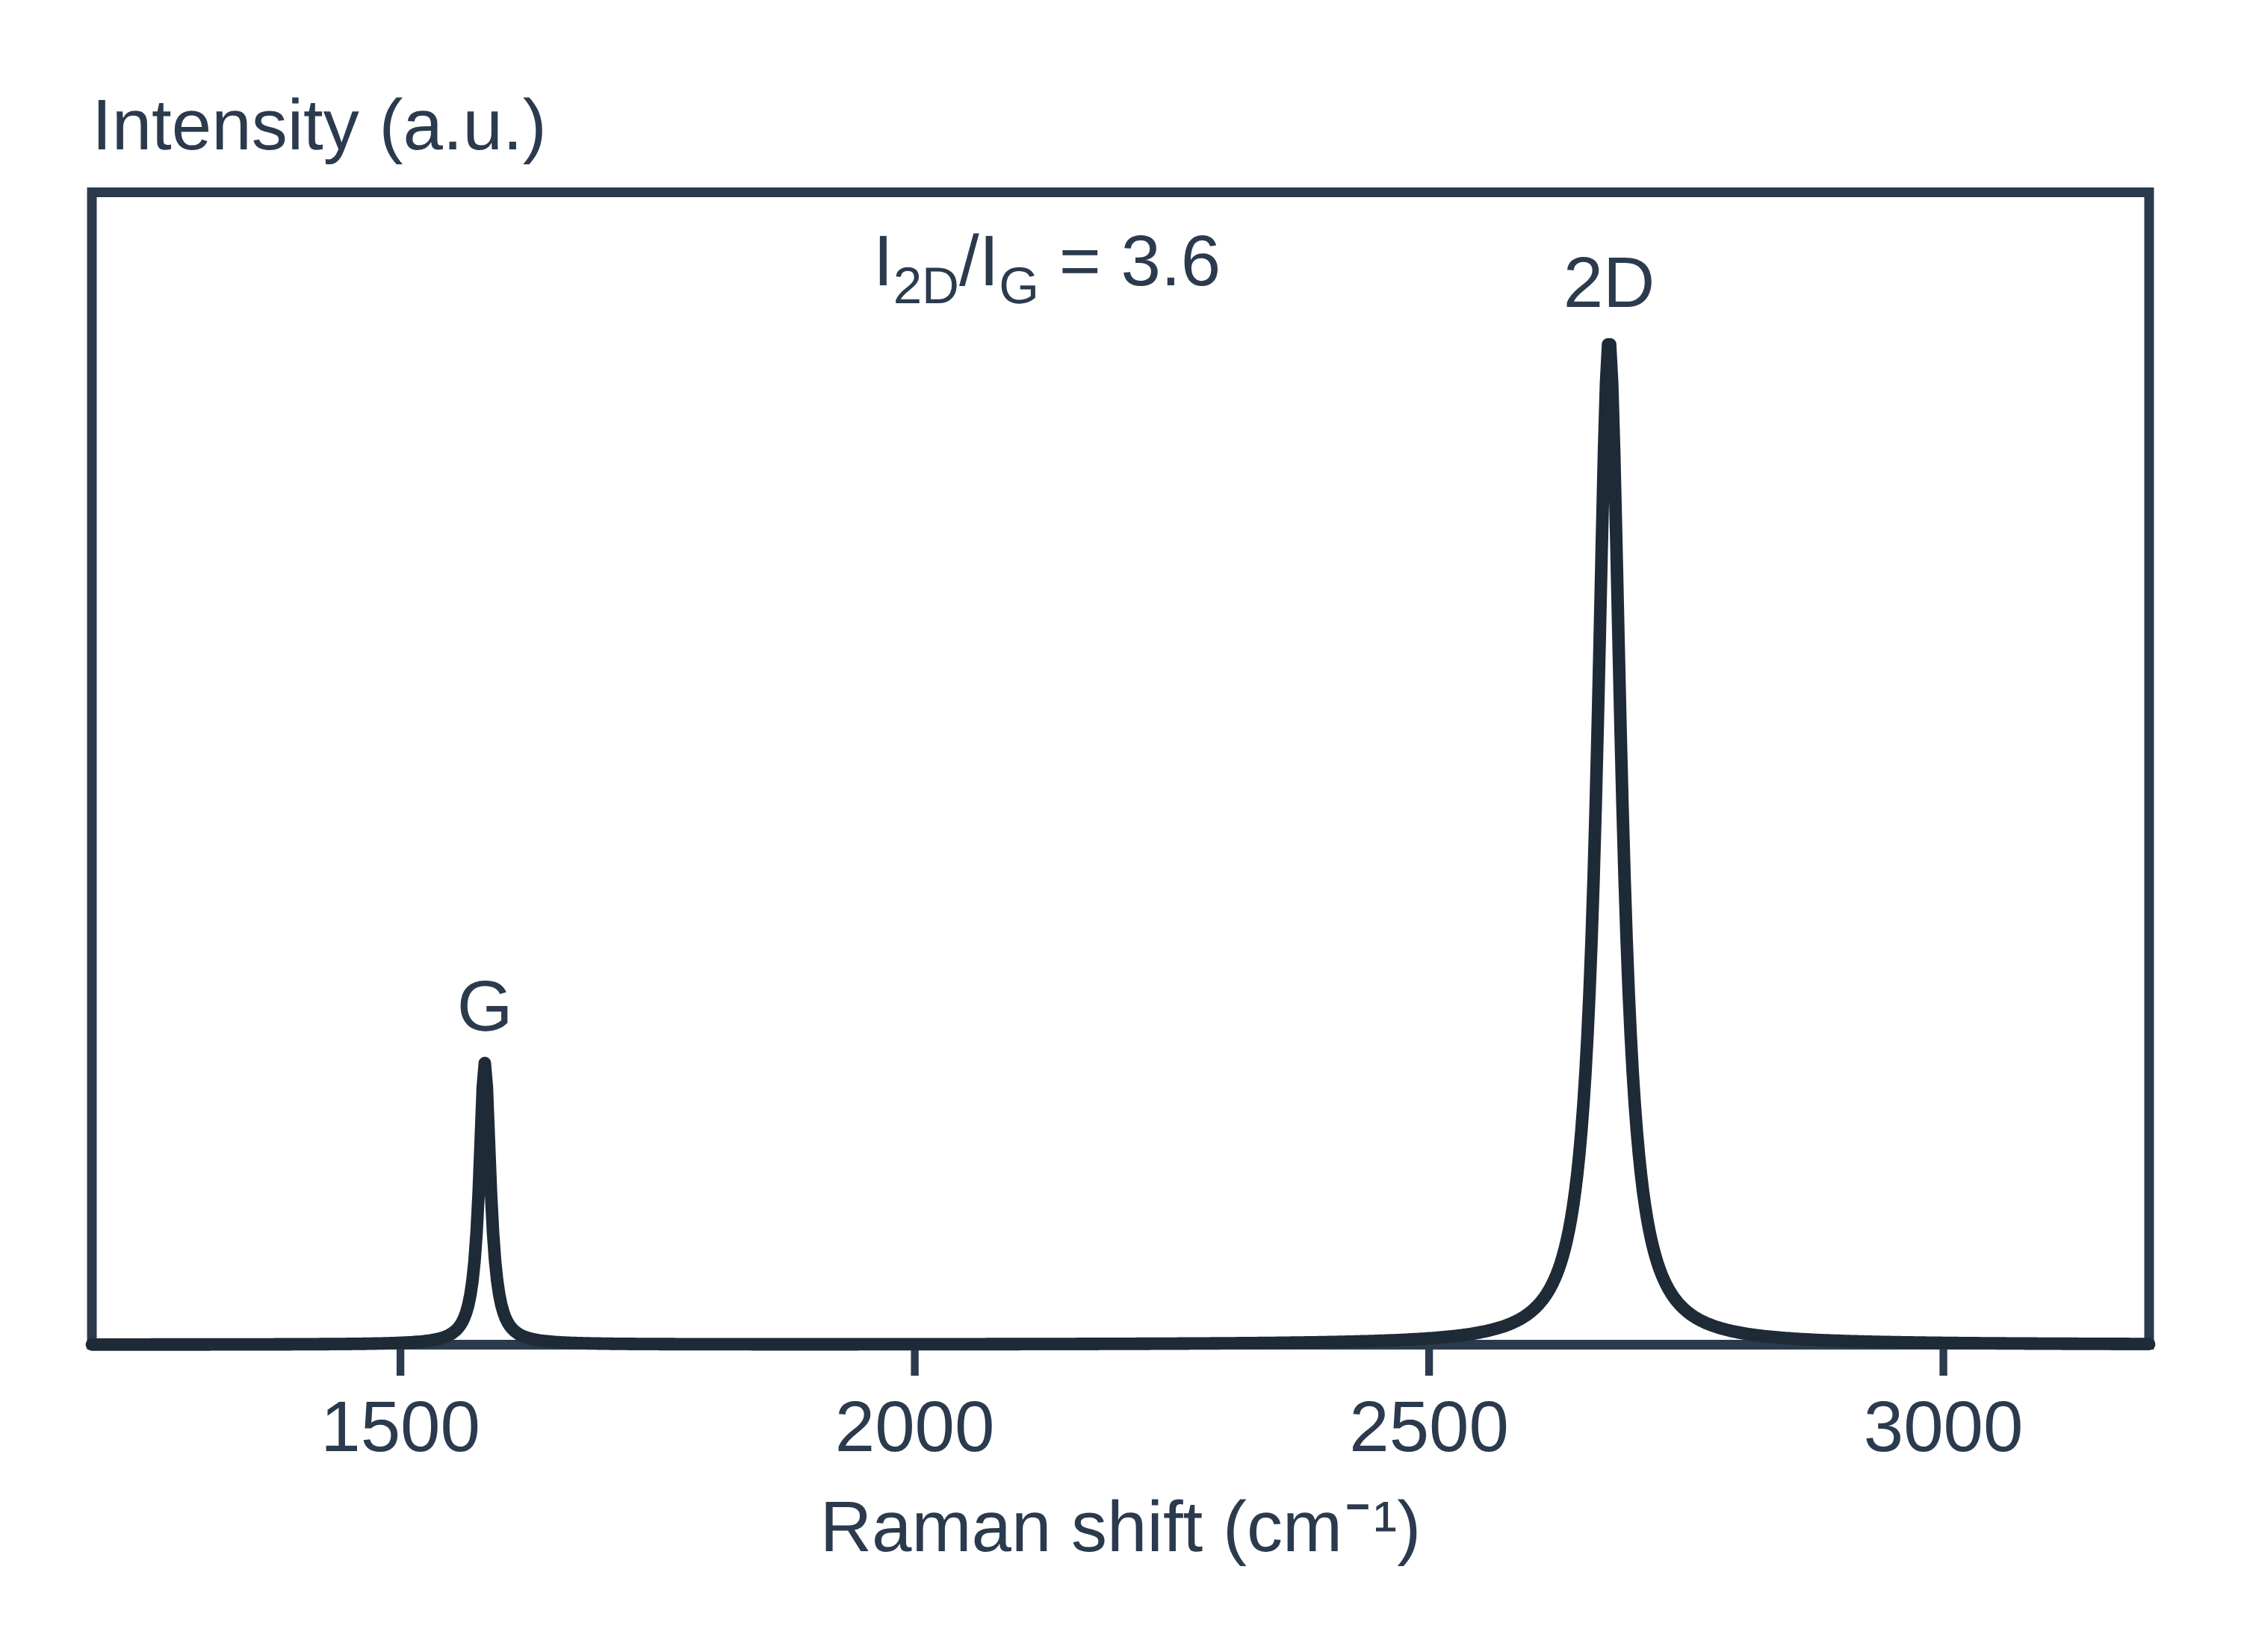
Raman spectroscopy data: an example plot to edit
How Raman works
When laser light hits a sample, almost all of it is scattered elastically, at the same energy (Rayleigh scattering). A tiny fraction is scattered inelastically: the photon gives energy to, or takes energy from, a molecular vibration or a lattice phonon and leaves with a different energy (Jones et al. 2019). That energy difference is the Raman shift, and it tells you the vibrational modes of the sample (Silver et al. 2019).
When the scattered photon has less energy than the laser photon (red-shifted), the process is Stokes scattering; when it has more (blue-shifted), it is anti-Stokes. Stokes lines are the stronger ones, because fewer molecules start in an excited vibrational state (Jones et al. 2019). A vibration is Raman active when it modulates the polarisability of the molecule or crystal (Jones et al. 2019), whereas infrared absorption needs a change in dipole moment (Baker et al. 2014). In materials with a centre of inversion, a mode is either Raman active or IR active, not both (Jones et al. 2019), which is why Raman and FTIR are used together.
A Raman microscope focuses the laser through an objective, filters out the Rayleigh line and disperses the scattered light onto a CCD detector; a confocal pinhole passes only light from the focal plane (Jones et al. 2019). See the characterisation techniques hub for how Raman compares with other methods.
What the data looks like and how to read it
A Raman spectrum plots intensity against Raman shift in cm⁻¹, the wavenumber of the laser minus that of the scattered light; for Stokes lines the shift equals the vibration wavenumber (Jones et al. 2019). The IUPAC convention runs the shift axis from right to left, but many papers plot it left to right (Jones et al. 2019). As an example, liquid CCl₄ gives Raman bands at 218, 314, 459, 762 and 790 cm⁻¹ beside the Rayleigh line (Jones et al. 2019).
Graphene is the classic materials example (Silver et al. 2019):
- G band, ~1580 cm⁻¹: first-order scattering from two degenerate phonon modes at the Γ point.
- 2D (or G′) band, ~2700 cm⁻¹: a second-order, two-phonon process. In monolayer graphene it is a single peak; in bilayer graphene it splits into four components.
- D band, ~1350 cm⁻¹: appears only when defects are present, at about half the 2D frequency.
The 2D band changes shape, width and position as layers are added while the G band shifts slightly down, which allows unambiguous, non-destructive counting of graphene layers (Ferrari et al. 2006). The D-to-G intensity ratio, I(D)/I(G), measures point-defect density, but it depends strongly on the laser excitation energy and peaks at an inter-defect distance of about 3 nm, so one ratio can match two defect densities; the G band width resolves the ambiguity (Cançado et al. 2011).
For MoS₂, the in-plane E′ mode (~382 cm⁻¹) and out-of-plane A′₁ mode (~403 cm⁻¹) move apart as layers are added, and their separation gives the layer number (Silver et al. 2019).
Sample preparation
- Little preparation. Raman usually needs no extensive preparation and no labels, and water does not normally interfere (Butler et al. 2016). Water and polar solvents absorb strongly in the infrared, which is one reason Raman is preferred for wet samples (Jones et al. 2019).
- Choose the laser. UV and short visible wavelengths cause strong photoluminescence in organic materials that can mask the Raman peaks, so longer visible or near-IR lasers (500–830 nm) are often used; 1064 nm is common for strongly fluorescent materials (Jones et al. 2019). The Raman signal falls at longer wavelengths, so acquisitions take longer, and silicon CCD detectors lose efficiency above about 800 nm (Jones et al. 2019). 785 nm is the most common compromise, and visible 500–830 nm lasers suit inorganic materials such as graphene and carbon nanotubes (Jones et al. 2019).
- Laser power. Raising the power and focusing tightly increases the signal but can photobleach or damage the sample; continuous-wave lasers are preferred for spontaneous Raman for this reason (Jones et al. 2019).
What Raman tells you about materials
2D materials. Raman is a routine first check for graphene: it gives the number and orientation of layers, edge type, and the effects of strain, doping, disorder, electric and magnetic fields and functional groups (Ferrari & Basko 2013). The D band, absent in pristine graphene, is the quick test for defects introduced by chemical modification, as in graphene oxide, and I(D)/I(G) at a stated laser energy quantifies point defects (Silver et al. 2019; Cançado et al. 2011). For MoS₂, the E′–A′₁ separation gives the layer count (Silver et al. 2019), and in general Raman can determine 2D layer thickness with atomic-level precision from inter- or intra-layer modes (Jones et al. 2019).
Crystals and phonons. Raman probes phonon modes in crystals, and in 2D materials it also reports inter-layer breathing and shear modes, in-plane anisotropy, doping, disorder, thermal conductivity and strain (Jones et al. 2019).
Mapping and enhancement. Confocal Raman maps composition across a sample at about the diffraction limit; surface-enhanced Raman (SERS) on rough gold or silver raises the signal by orders of magnitude, and tip-enhanced Raman (TERS) reaches 10–30 nm resolution (Jones et al. 2019).
Pair Raman with FTIR for IR-active modes, XRD for crystal phase, AFM for thickness of 2D flakes, and XPS for surface chemistry.
Common mistakes and limits
- Fluorescence background. Photoluminescence from organic materials can mask the Raman peaks; move to a longer-wavelength laser such as 785 or 1064 nm (Jones et al. 2019).
- Laser damage. Too much power or too tight a focus can photobleach or damage the sample (Jones et al. 2019).
- Quoting I(D)/I(G) without the laser energy. The ratio depends strongly on excitation energy, and a single value can correspond to two defect densities (Cançado et al. 2011).
- Weak signal. Spontaneous Raman is a very weak process, so dilute species may need SERS or longer acquisitions (Jones et al. 2019).
- Missing modes. Some modes are absent because of selection rules for the scattering geometry or because the Rayleigh filter cuts off low shifts (Jones et al. 2019).
- Spatial resolution. Conventional Raman cannot resolve features much smaller than about half the laser wavelength (Jones et al. 2019).
How to draw the Raman setup and data in LabCanvas
The LabCanvas figure editor Library has the Raman microscope as an editable object, including a cutaway of the beam path from the laser through the objective to the sample and back through the Rayleigh filter, pinhole and grating to the detector, and an editable data plot for the spectrum. Plot your spectrum against Raman shift, label the peaks (for graphene: D, G and 2D, with I(D)/I(G) and the laser wavelength), overlay spectra for different layer numbers, and export a high-resolution image for a methods figure or graphical abstract.
Raman compared with FTIR and NMR
| Technique | What it measures | Typical sample | Resolution / depth |
|---|---|---|---|
| Raman | Inelastic scattering of laser light by vibrations that modulate the polarisability (Jones et al. 2019) | Solids and liquids, including aqueous samples; little preparation (Butler et al. 2016) | Spot ≥ half the laser wavelength (~250 nm, visible); TERS 10–30 nm (Jones et al. 2019) |
| FTIR | Infrared absorption by vibrations that change the dipole moment (Baker et al. 2014) | Films, sections and liquids; ATR needs contact with the crystal (Baker et al. 2014) | ATR penetration ~1–2 μm; diffraction-limited imaging (Baker et al. 2014) |
| NMR | Nuclear spin resonances: chemical shift, coupling, integrals (Pauli et al. 2014) | Solutions, or powders under magic-angle spinning (Brunner & Rauche 2020) | Bulk average; atom-level local structure (Brunner & Rauche 2020) |
Related techniques
Fourier-transform infrared (FTIR) spectroscopy
FTIR spectroscopy explained: infrared absorption by bond vibrations, the interferometer and Fourier transform, wavenumber regions, ATR and reading bands.
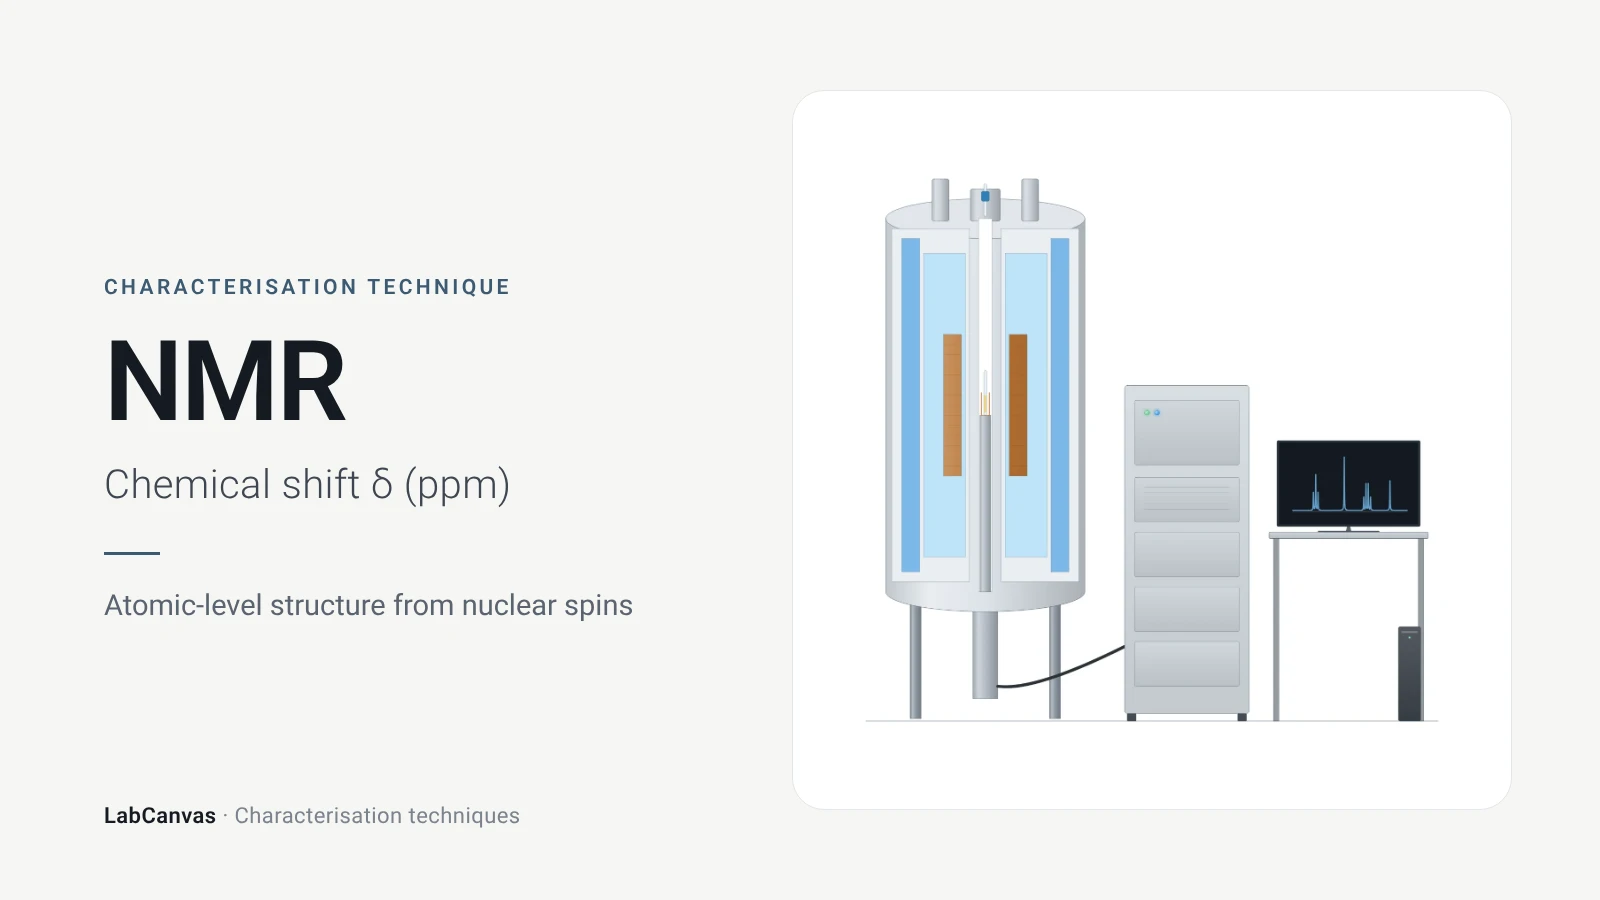
Nuclear magnetic resonance (NMR) spectroscopy
NMR spectroscopy explained: nuclear spins in a magnetic field, chemical shift in ppm, ¹H and ¹³C, coupling, integration, solid-state MAS and MOF digestion NMR.
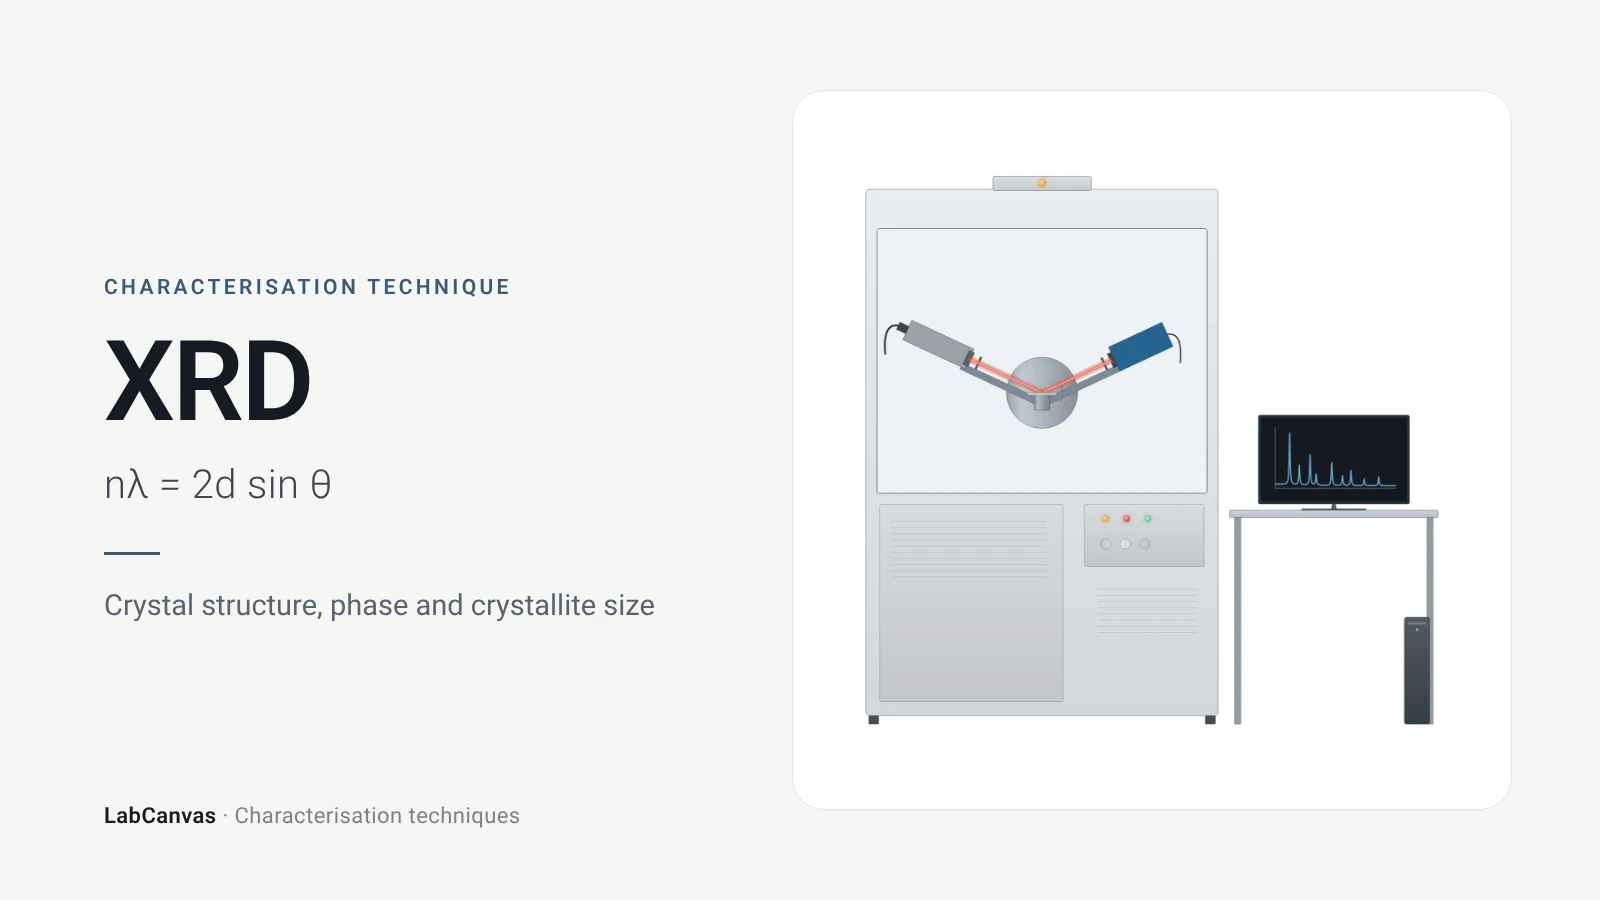
X-ray diffraction (XRD)
X-ray diffraction explained: Bragg’s law, how to read an XRD pattern, phase identification, Scherrer crystallite size, Rietveld refinement and common mistakes.
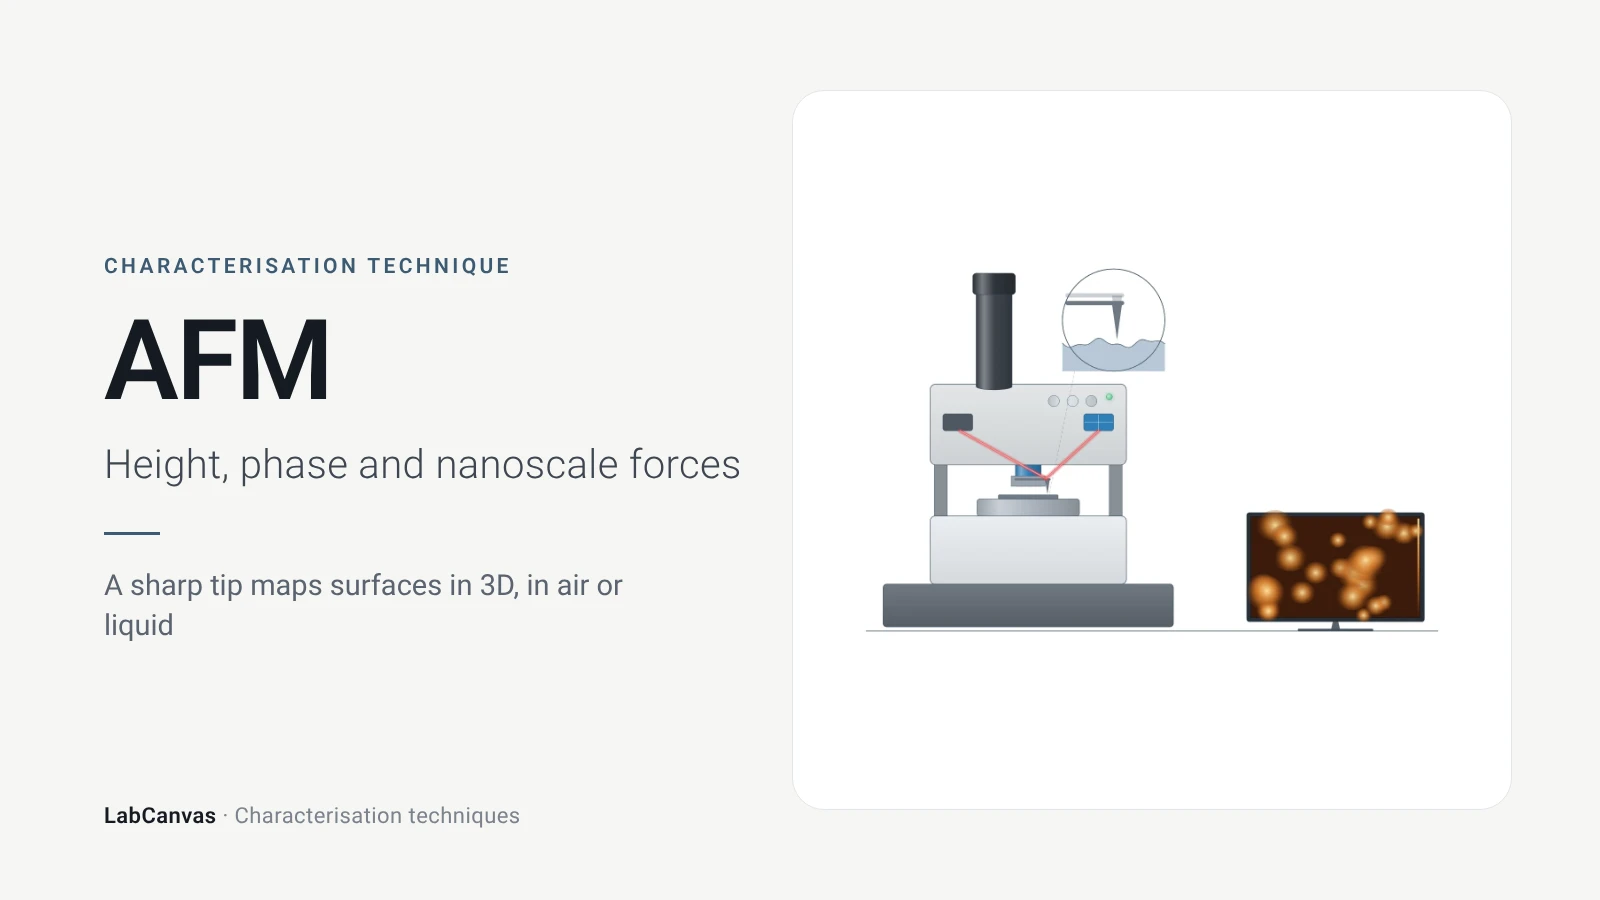
Atomic force microscopy (AFM)
How AFM works: tip, cantilever and laser deflection, contact vs tapping mode, measuring 2D flake thickness from height profiles, and common AFM artefacts.
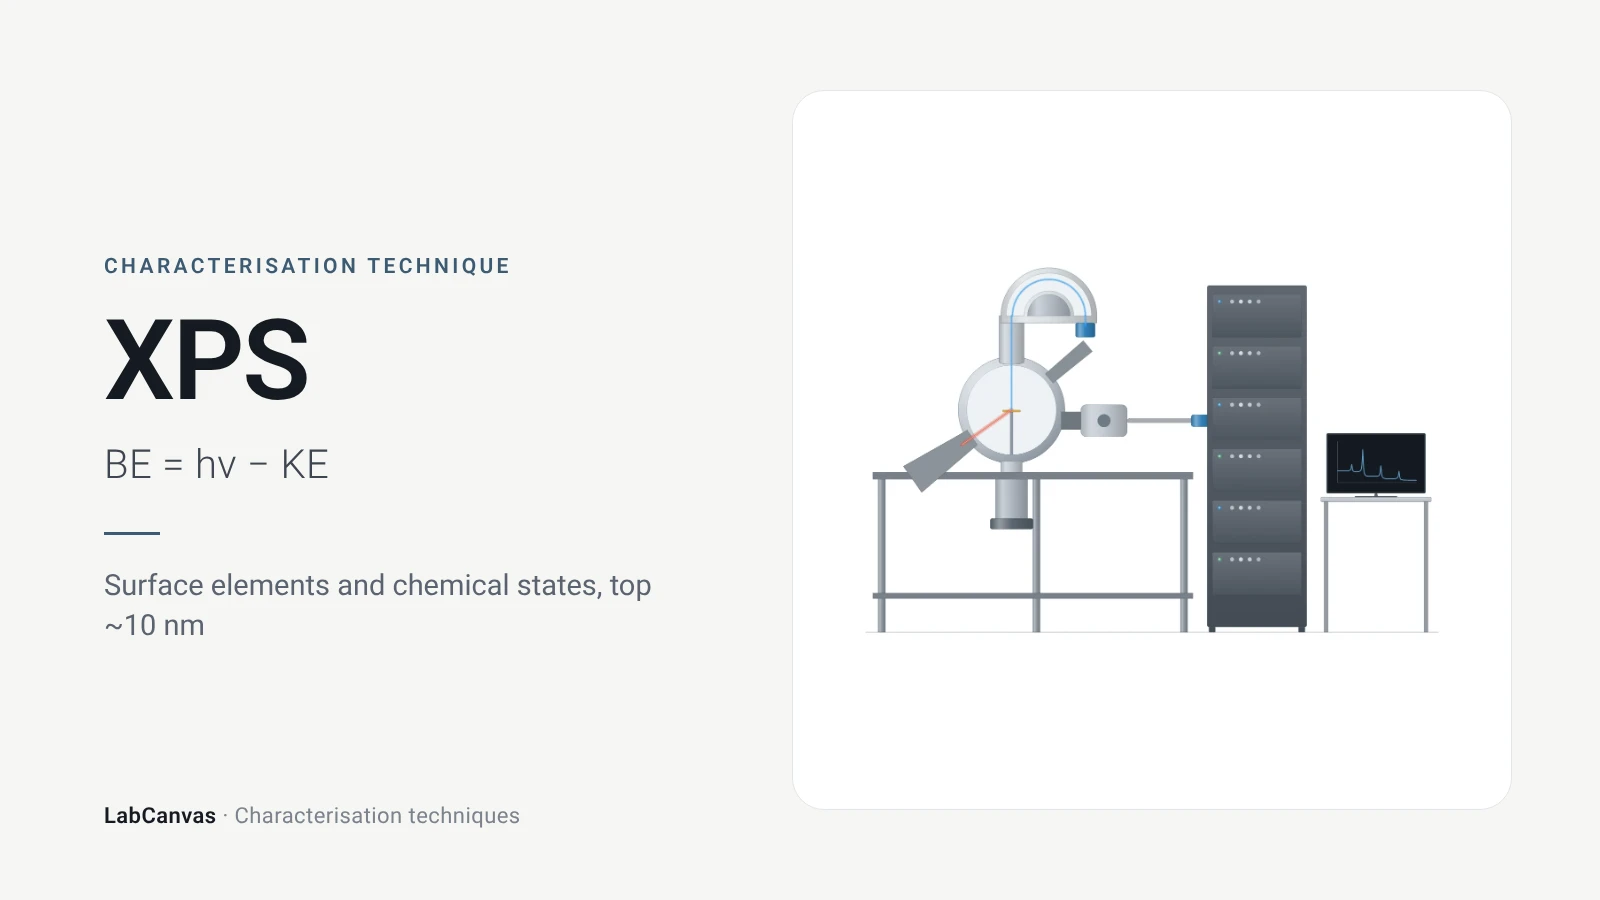
X-ray photoelectron spectroscopy (XPS)
XPS explained: binding energy, 2–10 nm surface sensitivity, survey vs high-resolution spectra, chemical shifts, C 1s charge referencing and depth profiling.
More on LabCanvas
- All characterisation techniques: XRD, XPS, BET, SEM, TEM, NMR, FTIR, Raman and more, explained with cited sources
- Graphical abstract sizes and templates: ACS, Wiley, Angewandte, RSC, Elsevier and Cell Press, with templates at the right size
- Materials explained: MOFs, COFs, 2D materials, perovskites, batteries and zeolites, with cited facts
- Journal figure size guide: Column widths and resolutions for 38 journals
Frequently asked questions
What is Raman spectroscopy used for?
Raman spectroscopy identifies compounds and phases from their vibrational fingerprints and, in 2D materials such as graphene and MoS₂, measures layer number, defects, doping and strain. It is non-destructive and usually needs little sample preparation (Butler et al. 2016; Ferrari & Basko 2013).
What is the Raman shift?
The Raman shift is the difference, in cm⁻¹, between the wavenumber of the laser and that of the scattered light. For Stokes scattering it equals the wavenumber of the vibration that scattered the light (Jones et al. 2019).
What is the difference between Stokes and anti-Stokes Raman scattering?
In Stokes scattering the photon loses energy to a vibration and is red-shifted; in anti-Stokes scattering it gains energy and is blue-shifted. Stokes lines are stronger because more molecules start in the vibrational ground state (Jones et al. 2019).
Raman vs FTIR: what is the difference?
FTIR measures absorption by vibrations that change the dipole moment; Raman measures scattering by vibrations that change the polarisability. In centrosymmetric materials the two see different modes, and Raman copes better with water, which absorbs strongly in the infrared (Jones et al. 2019; Baker et al. 2014).
What are the D, G and 2D bands in graphene?
The G band (~1580 cm⁻¹) is a first-order mode from two degenerate phonons at the Γ point, the 2D band (~2700 cm⁻¹) is a second-order two-phonon mode, and the D band (~1350 cm⁻¹) appears only when defects are present (Silver et al. 2019).
How do you tell monolayer graphene from Raman?
The 2D band changes shape, width and position with the number of layers: in monolayer graphene it is a single peak, in bilayer graphene it splits into four components (Ferrari et al. 2006; Silver et al. 2019).
What does the I(D)/I(G) ratio mean?
It measures the density of point defects in graphene, but it depends strongly on the laser energy and reaches a maximum at an inter-defect distance of about 3 nm, so the G band width is needed to decide which side of the maximum a sample is on (Cançado et al. 2011).
Which laser wavelength should I use for Raman?
785 nm is the most common choice because it balances signal, fluorescence, detector sensitivity and cost; 532 nm is increasingly used and suits inorganic materials such as graphene, and 1064 nm is used for strongly fluorescent samples (Jones et al. 2019).
References
- R. R. Jones, D. C. Hooper, L. Zhang, D. Wolverson, V. K. Valev. Raman techniques: fundamentals and frontiers. Nanoscale Res. Lett. 2019, 14, 231. doi:10.1186/s11671-019-3039-2
- A. Silver, H. Kitadai, H. Liu, T. Granzier-Nakajima, M. Terrones, X. Ling, S. Huang. Chemical and bio sensing using graphene-enhanced Raman spectroscopy. Nanomaterials 2019, 9, 516. doi:10.3390/nano9040516
- A. C. Ferrari et al.. Raman spectrum of graphene and graphene layers. Phys. Rev. Lett. 2006, 97, 187401. doi:10.1103/PhysRevLett.97.187401
- A. C. Ferrari, D. M. Basko. Raman spectroscopy as a versatile tool for studying the properties of graphene. Nat. Nanotechnol. 2013, 8, 235–246. doi:10.1038/nnano.2013.46
- L. G. Cançado et al.. Quantifying defects in graphene via Raman spectroscopy at different excitation energies. Nano Lett. 2011, 11, 3190–3196. doi:10.1021/nl201432g
- H. J. Butler et al.. Using Raman spectroscopy to characterize biological materials. Nat. Protoc. 2016, 11, 664–687. doi:10.1038/nprot.2016.036
- M. J. Baker et al.. Using Fourier transform IR spectroscopy to analyze biological materials. Nat. Protoc. 2014, 9, 1771–1791. doi:10.1038/nprot.2014.110
- G. F. Pauli et al.. Importance of purity evaluation and the potential of quantitative ¹H NMR as a purity assay. J. Med. Chem. 2014, 57, 9220–9231. doi:10.1021/jm500734a
- E. Brunner, M. Rauche. Solid-state NMR spectroscopy: an advancing tool to analyse the structure and properties of metal–organic frameworks. Chem. Sci. 2020, 11, 4297–4304. doi:10.1039/d0sc00735h
Draw Raman spectroscopy figures for your paper
LabCanvas is a browser workspace for scientific figures: instruments with their beam and light paths, editable data plots, crystal structures, graphs and graphical abstracts at journal sizes.
Draw Raman spectroscopy in LabCanvas