Characterisation techniques
How XRD, XPS, BET, electron microscopy, NMR, FTIR, Raman, thermal analysis, UV–vis, DLS, electrochemistry and ICP-MS work, what their data looks like and how to read it, with every fact cited to the literature. Each page has the instrument and an example data plot you can edit in LabCanvas for your methods figure or graphical abstract.
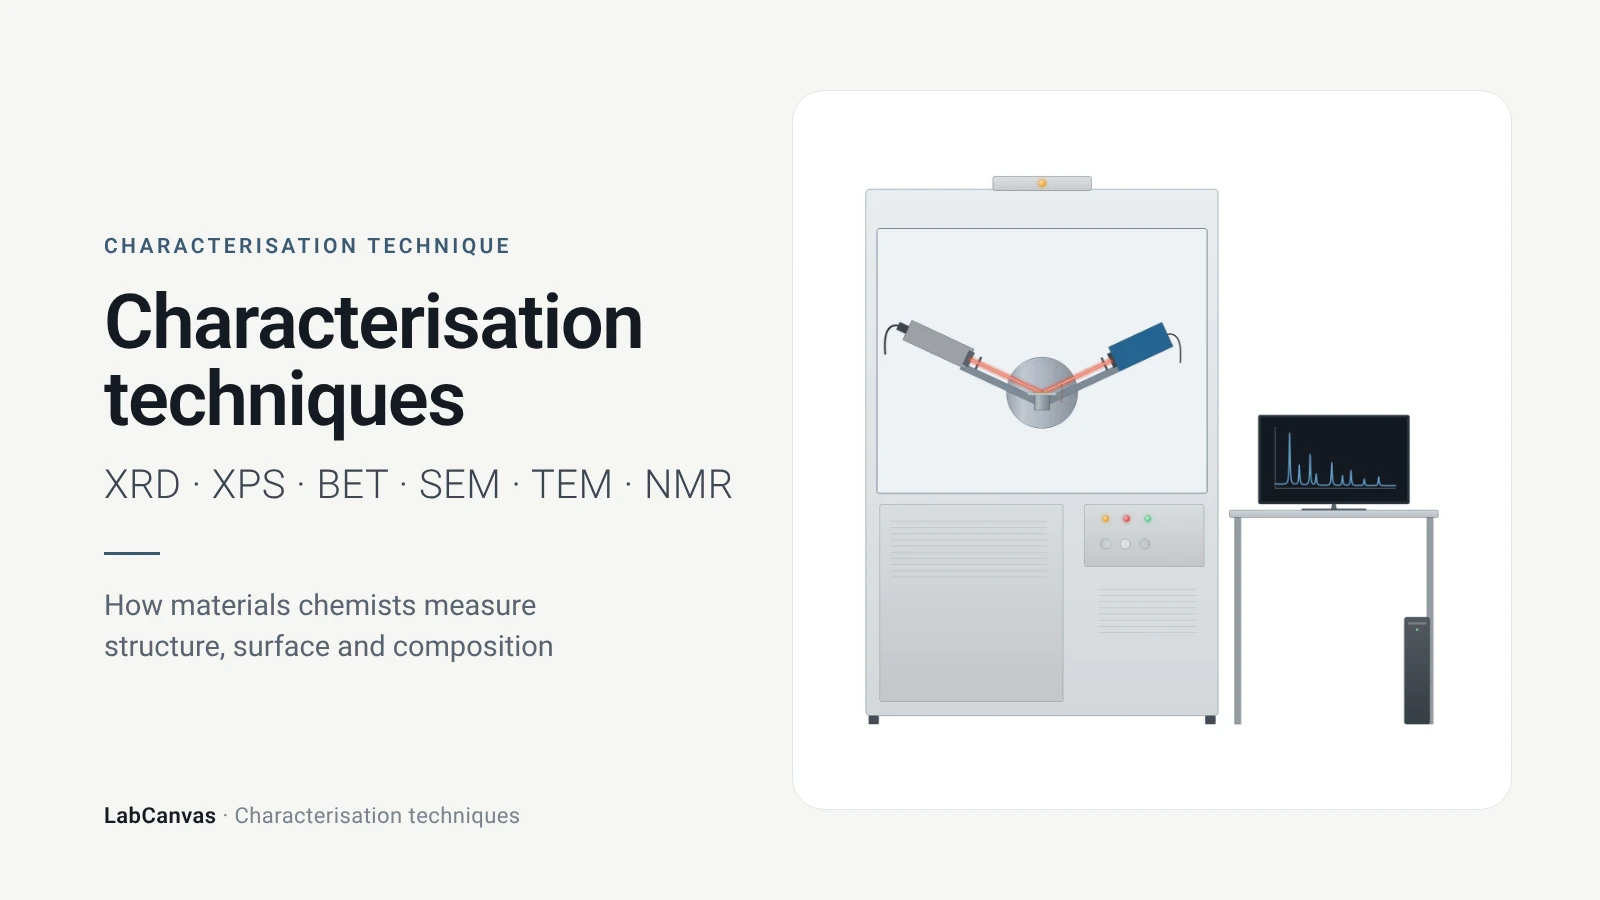
Characterisation techniques
Fifteen materials characterisation techniques explained with sources: XRD, XPS, BET, SEM, TEM, AFM, NMR, FTIR, Raman, TGA, UV–vis, DLS, CV, EIS and ICP-MS.
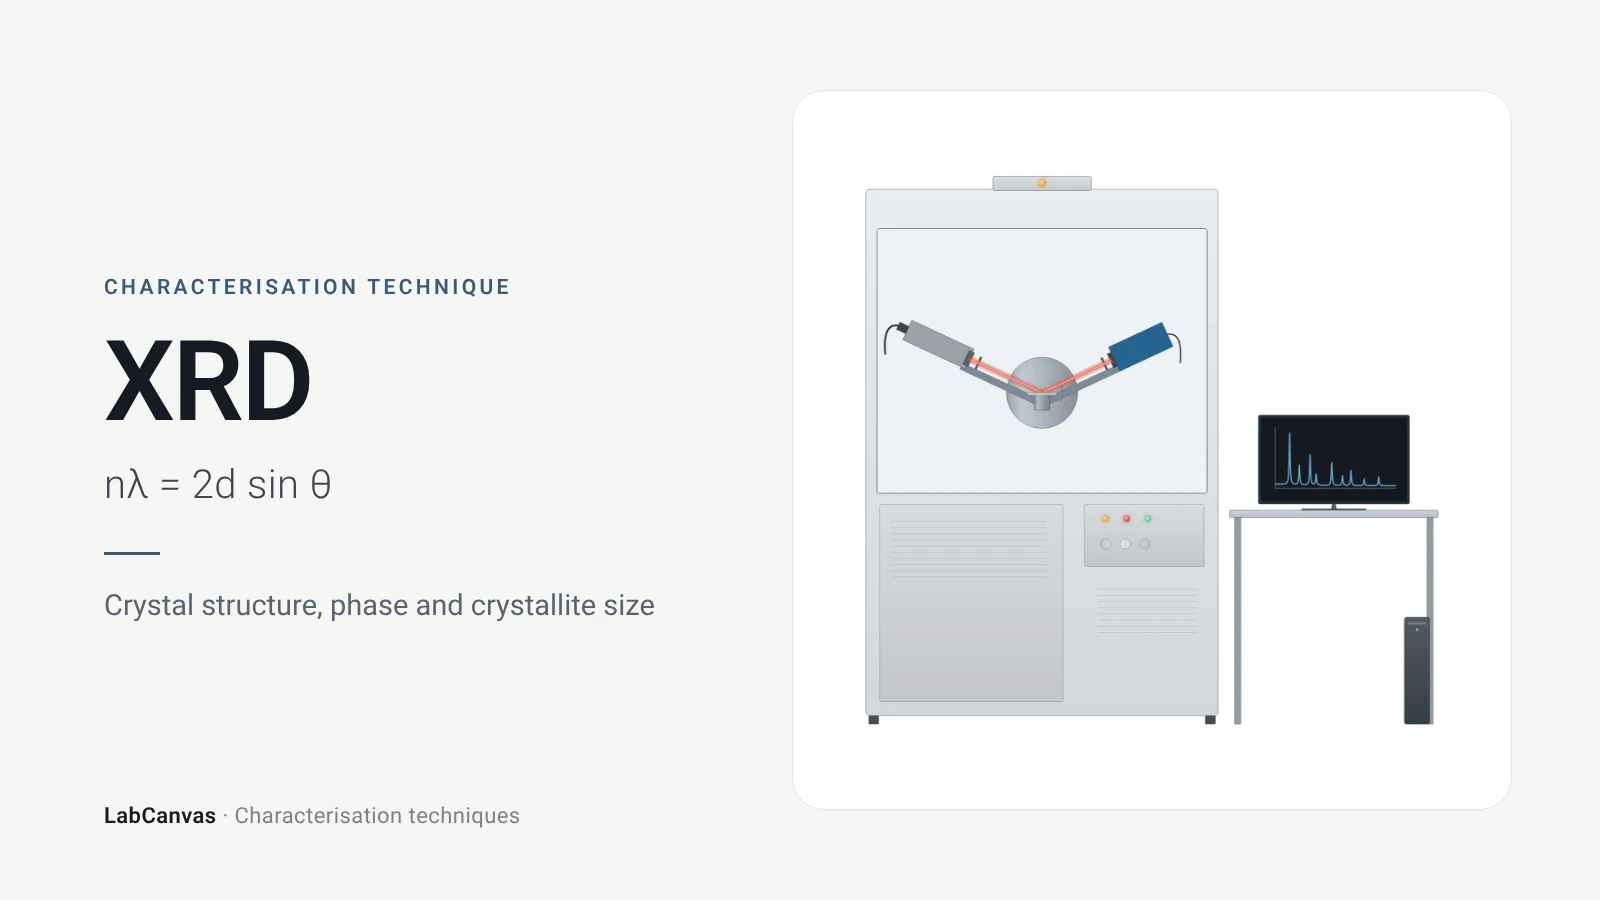
X-ray diffraction (XRD)
X-ray diffraction explained: Bragg’s law, how to read an XRD pattern, phase identification, Scherrer crystallite size, Rietveld refinement and common mistakes.
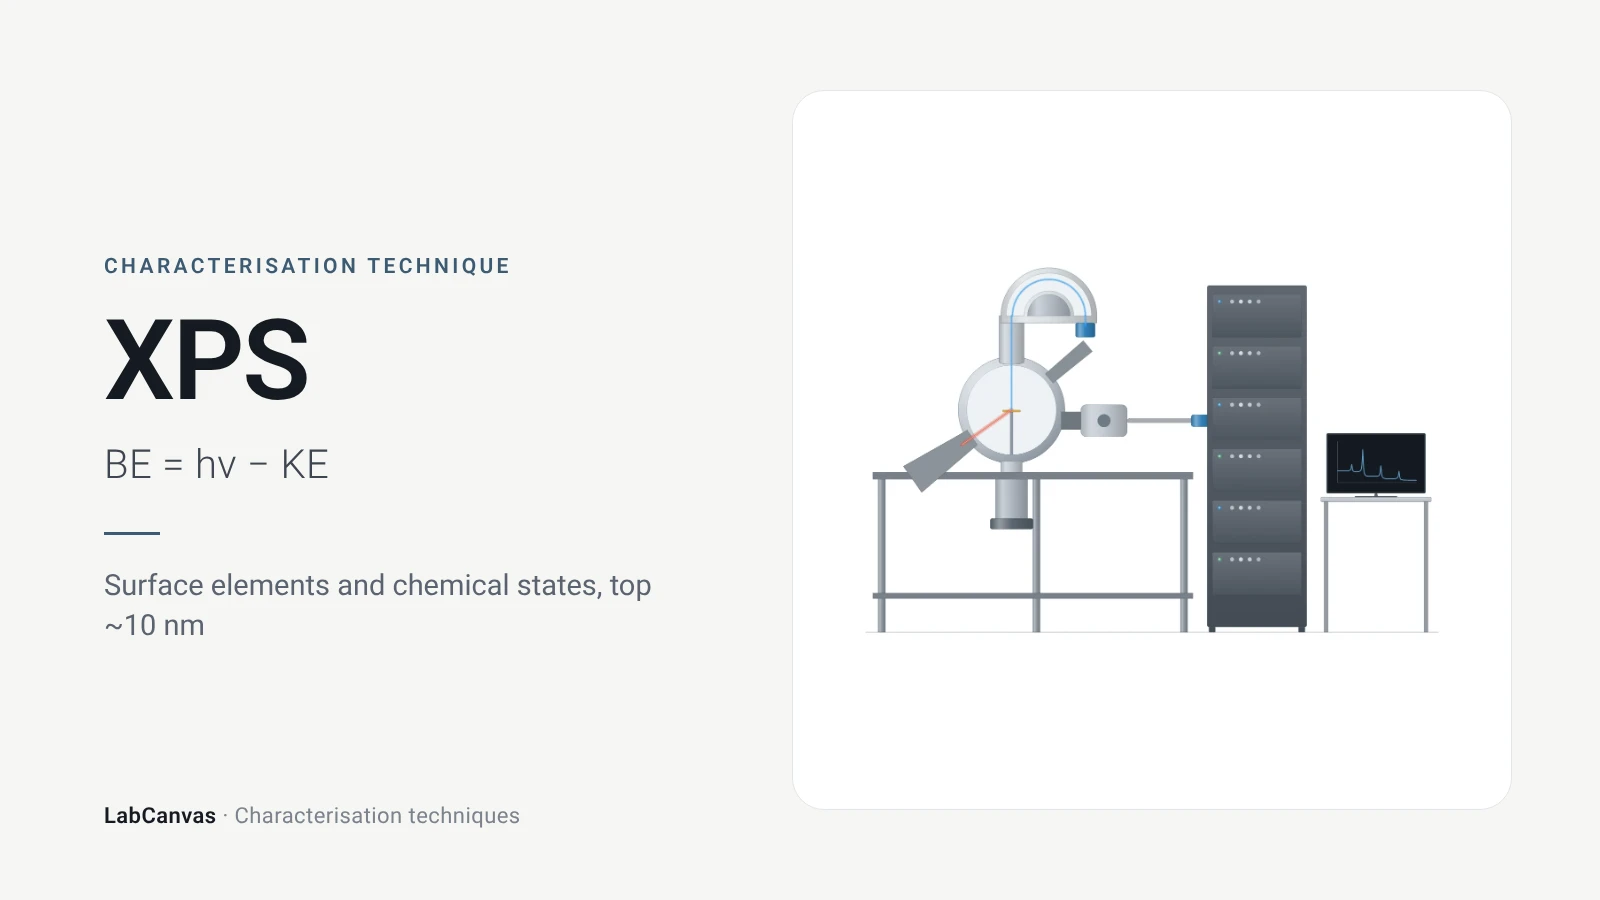
X-ray photoelectron spectroscopy (XPS)
XPS explained: binding energy, 2–10 nm surface sensitivity, survey vs high-resolution spectra, chemical shifts, C 1s charge referencing and depth profiling.
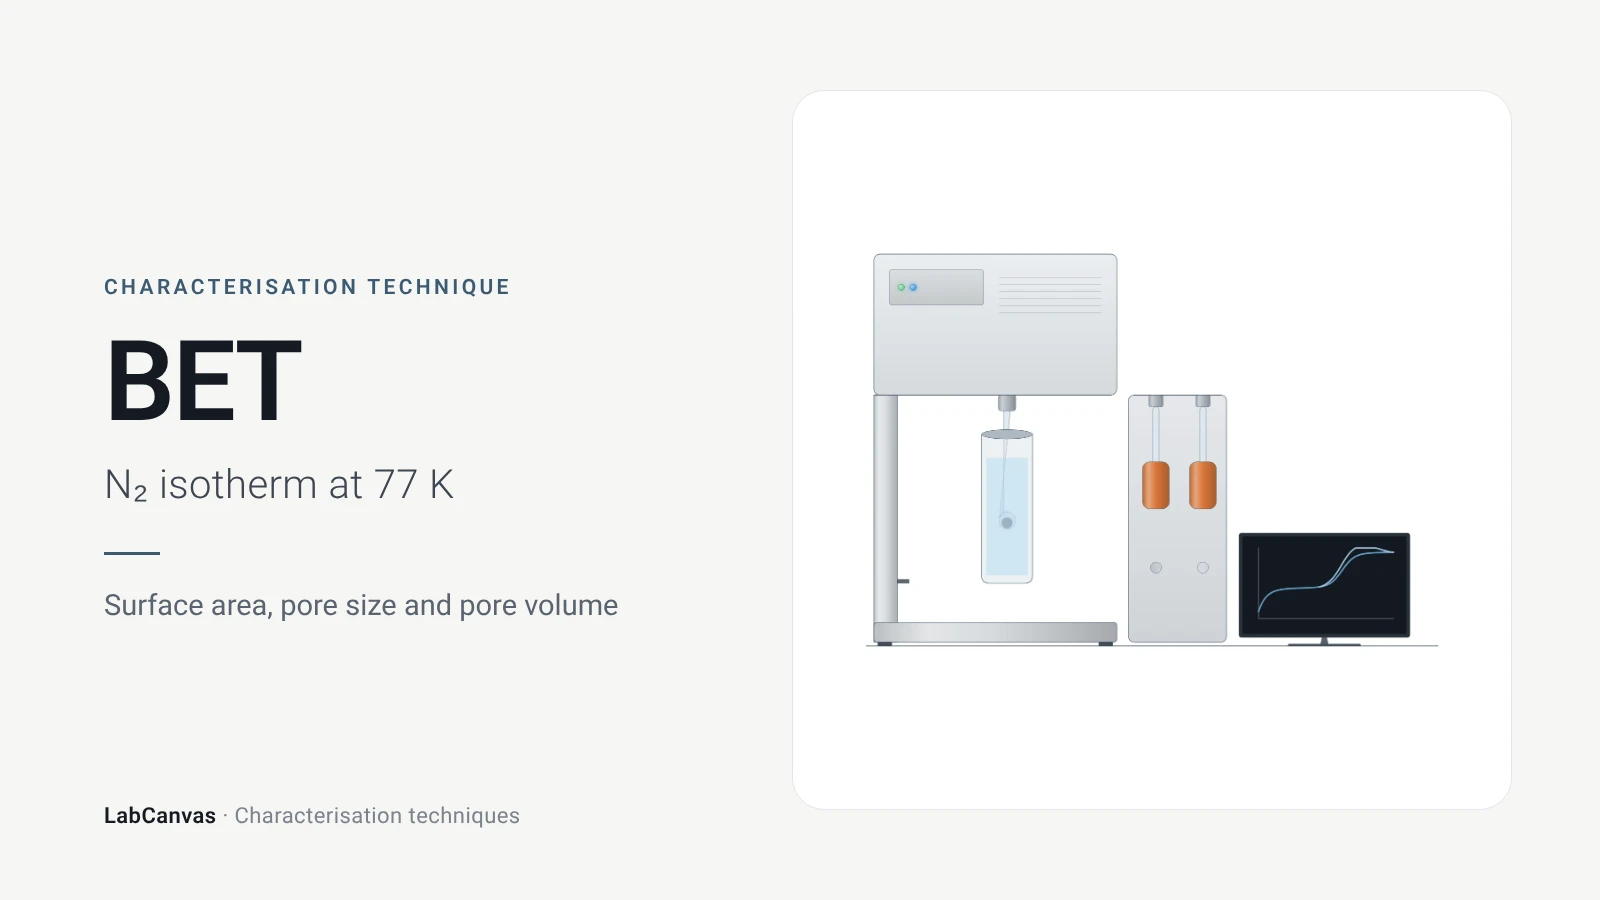
Gas sorption and BET surface area
BET surface area explained: N₂ sorption at 77 K, IUPAC isotherm types, the BET range and Rouquerol criteria, pore size, degassing and limits for MOFs.
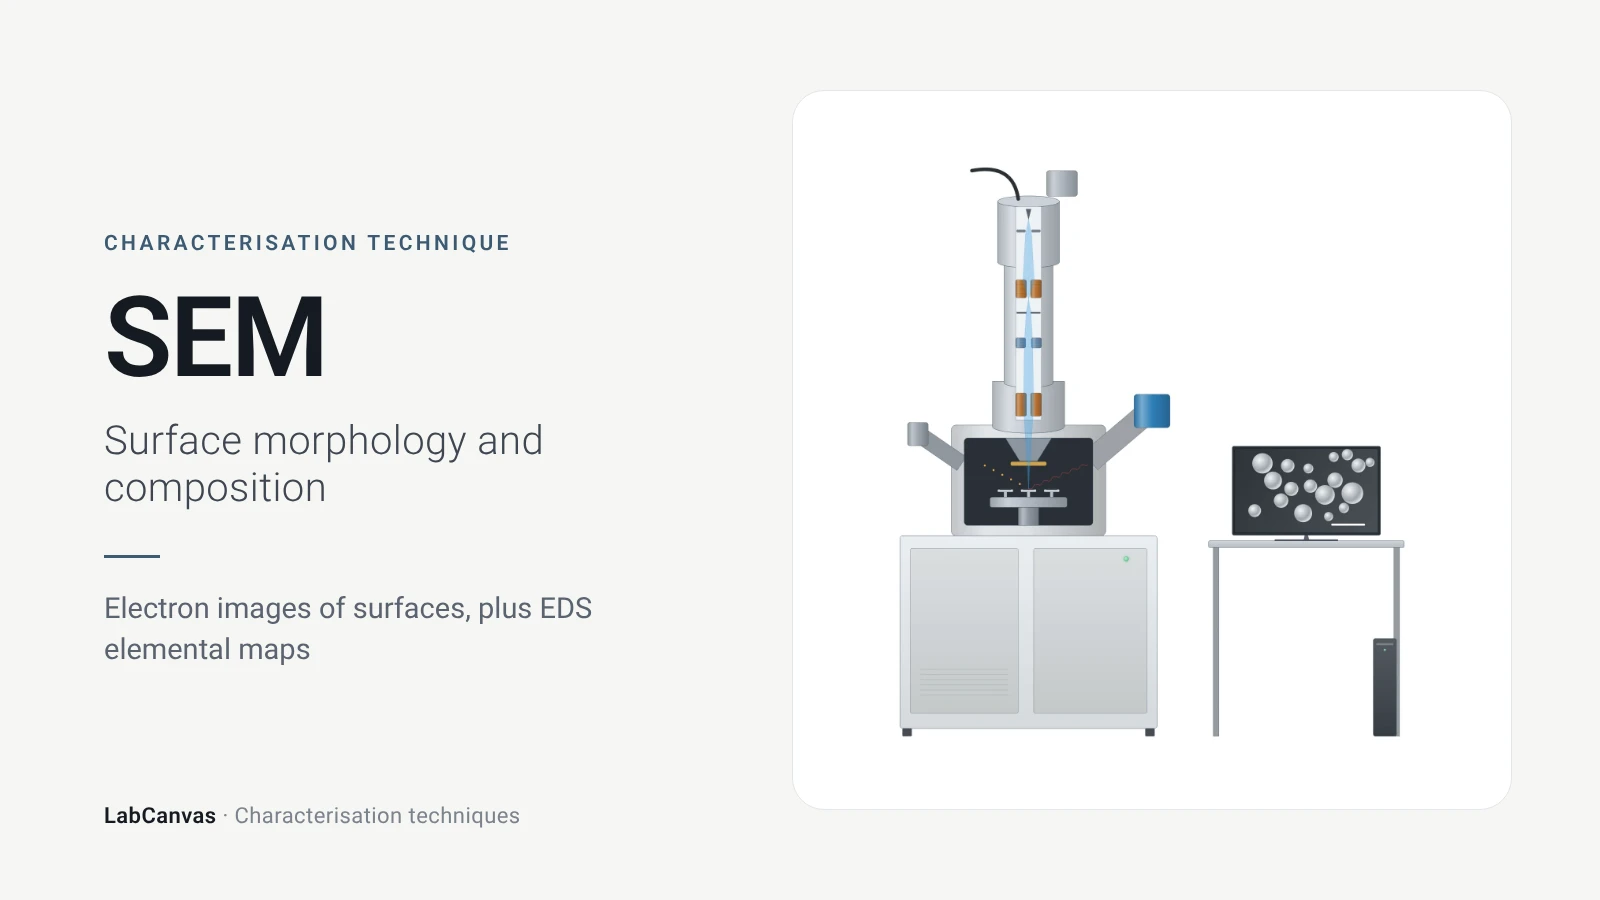
Scanning electron microscopy (SEM)
How SEM works: secondary vs backscattered electron images, EDS/EDX elemental analysis, resolution, sample coating, low-vacuum mode and common mistakes.
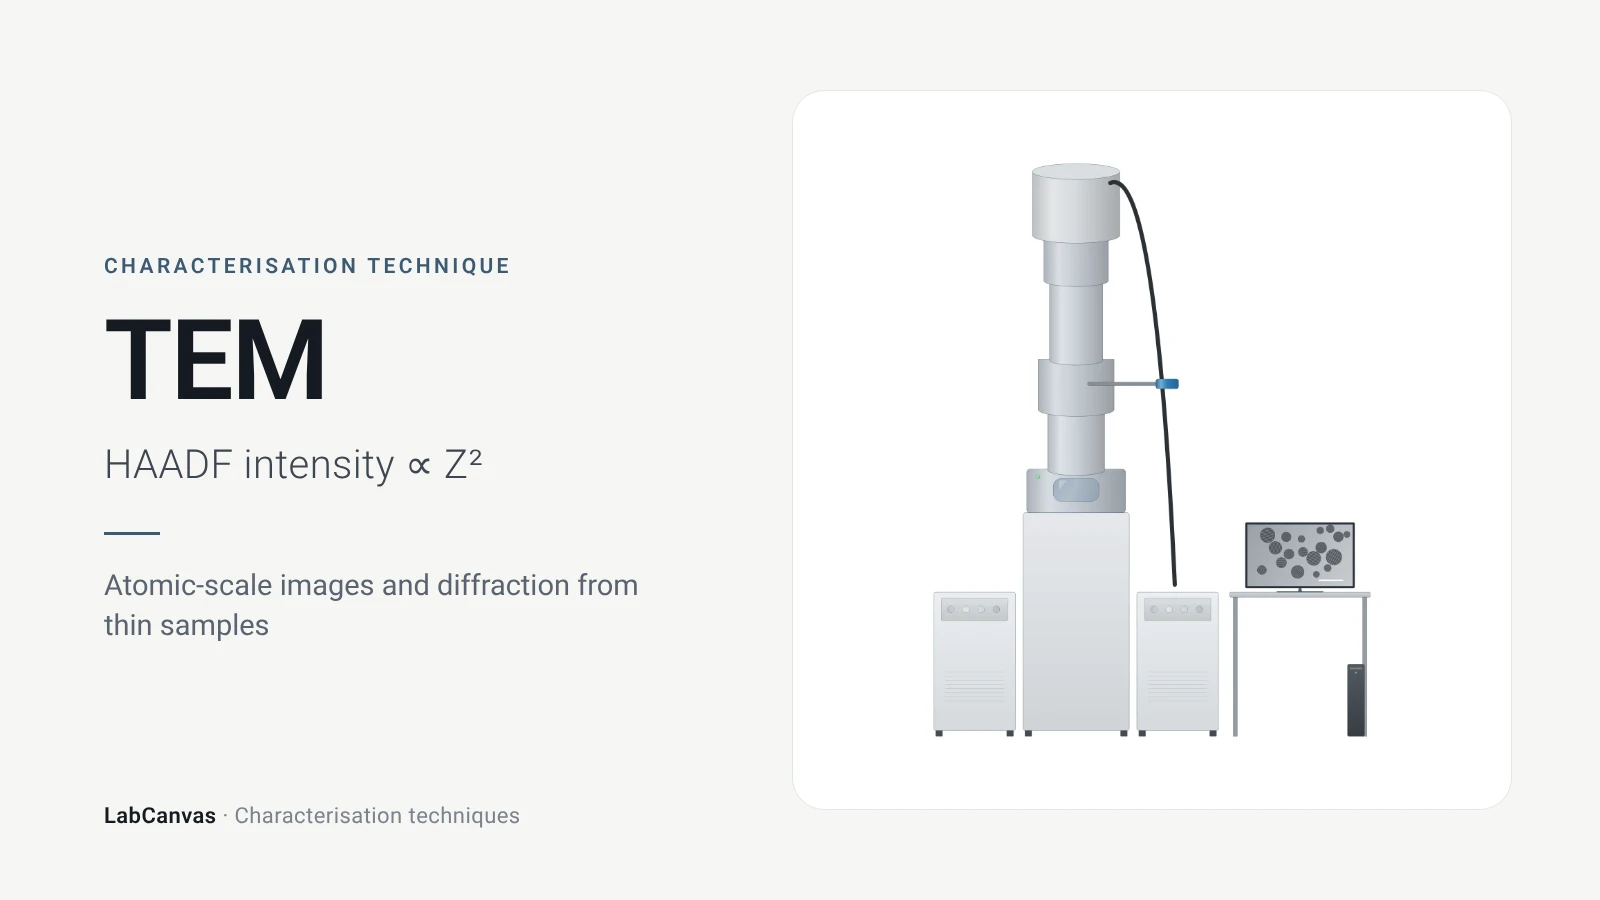
Transmission electron microscopy (TEM)
How TEM works: bright field, HRTEM lattice images, SAED diffraction, STEM-HAADF Z-contrast, EDS/EELS, sample thickness and beam damage of MOFs.
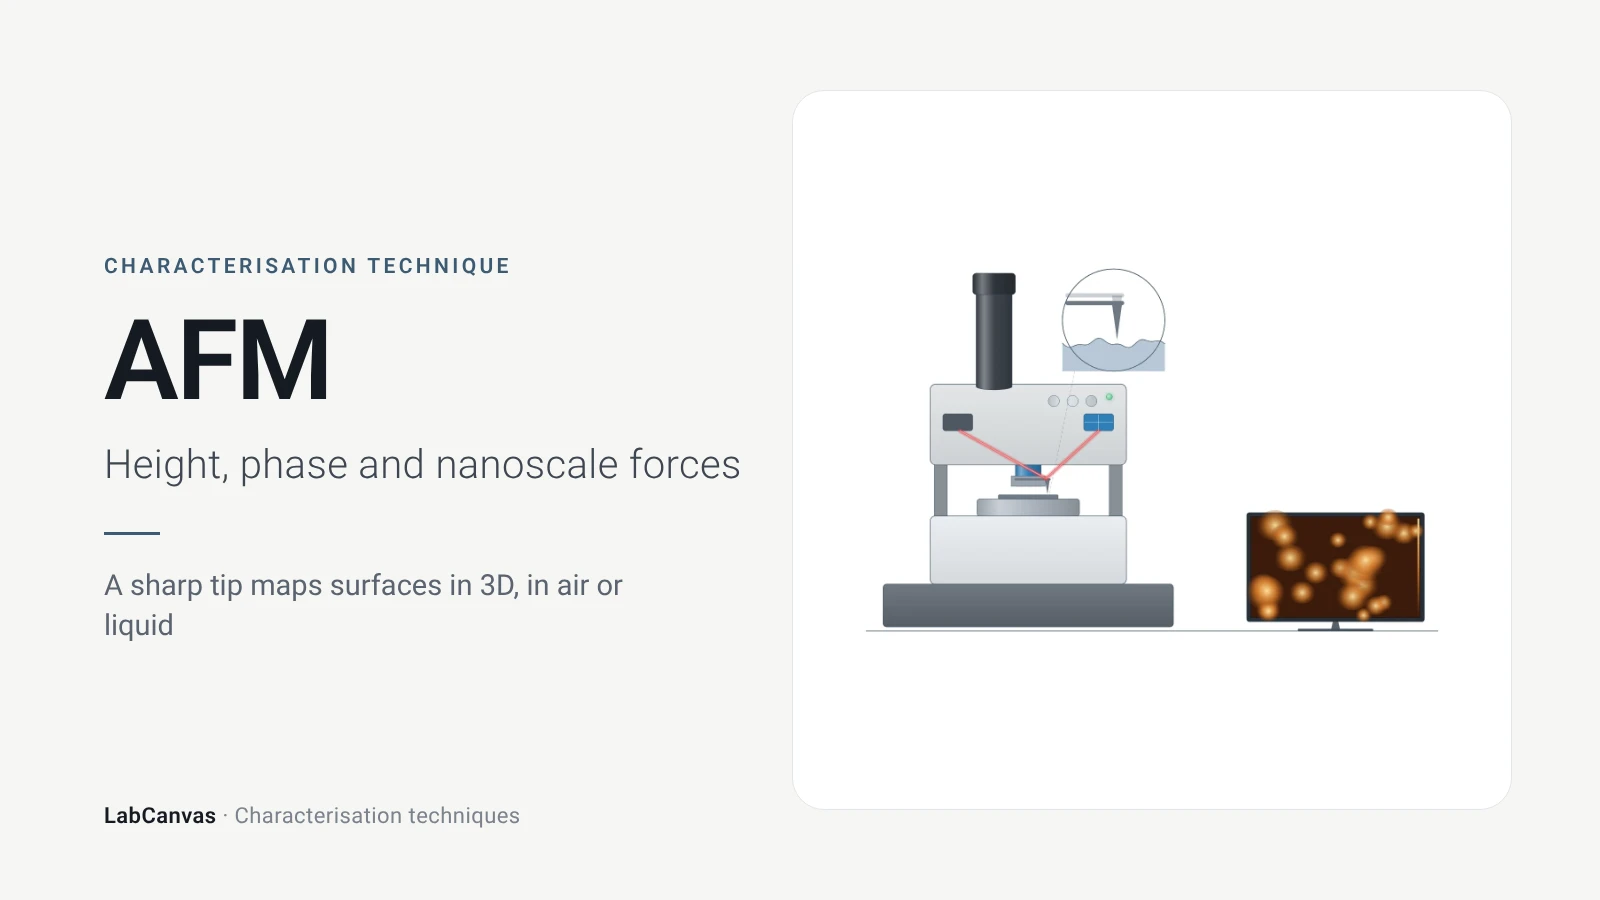
Atomic force microscopy (AFM)
How AFM works: tip, cantilever and laser deflection, contact vs tapping mode, measuring 2D flake thickness from height profiles, and common AFM artefacts.
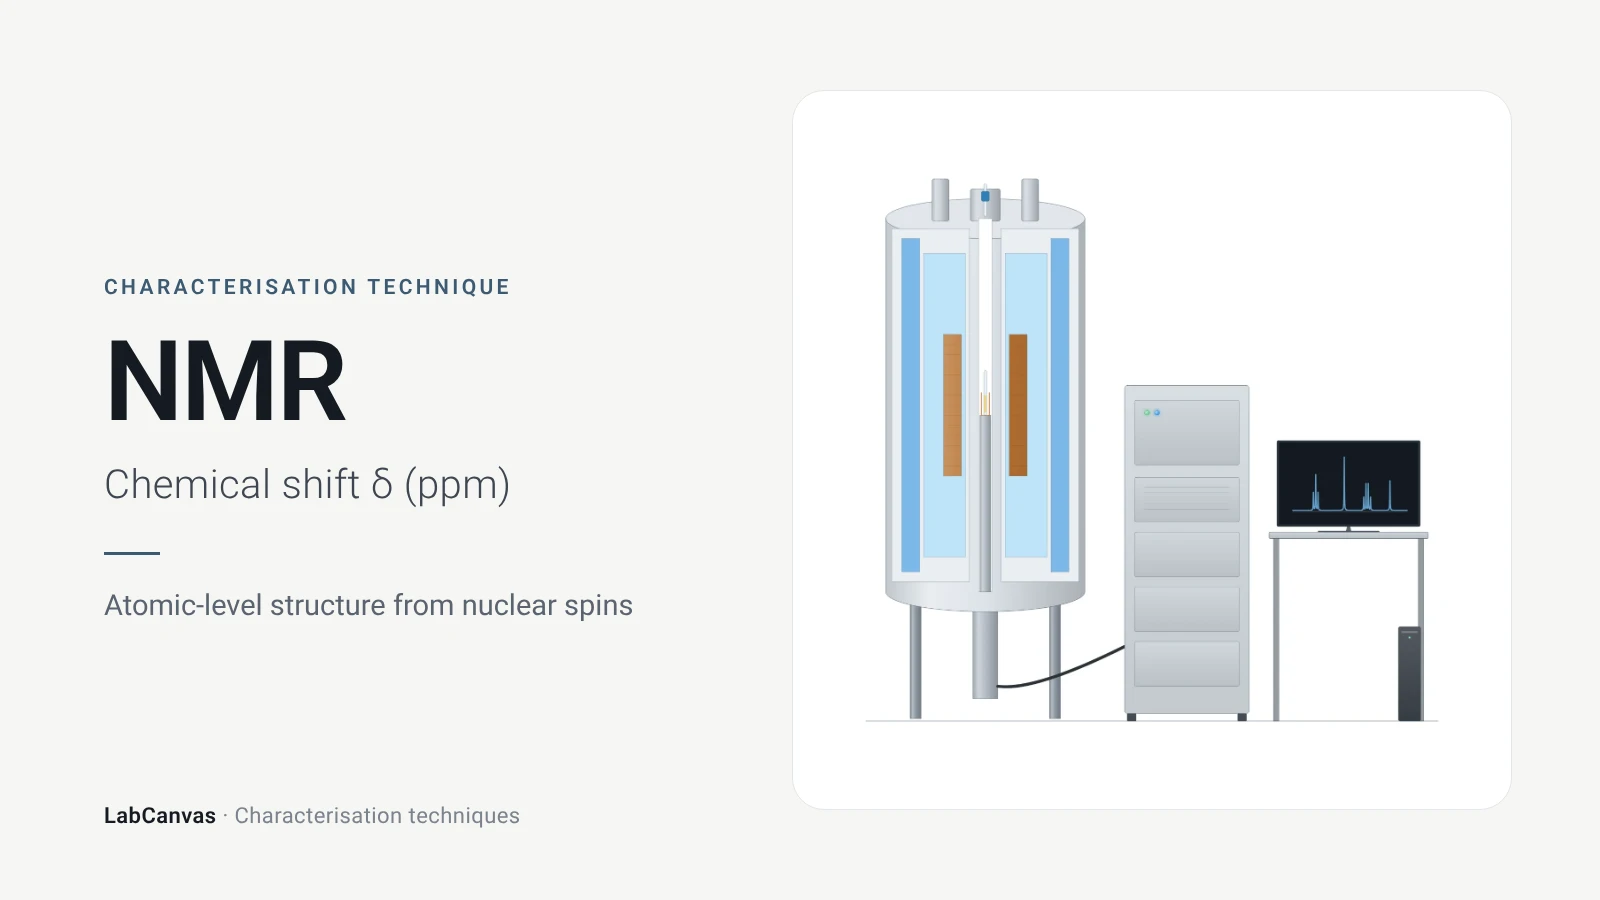
Nuclear magnetic resonance (NMR) spectroscopy
NMR spectroscopy explained: nuclear spins in a magnetic field, chemical shift in ppm, ¹H and ¹³C, coupling, integration, solid-state MAS and MOF digestion NMR.
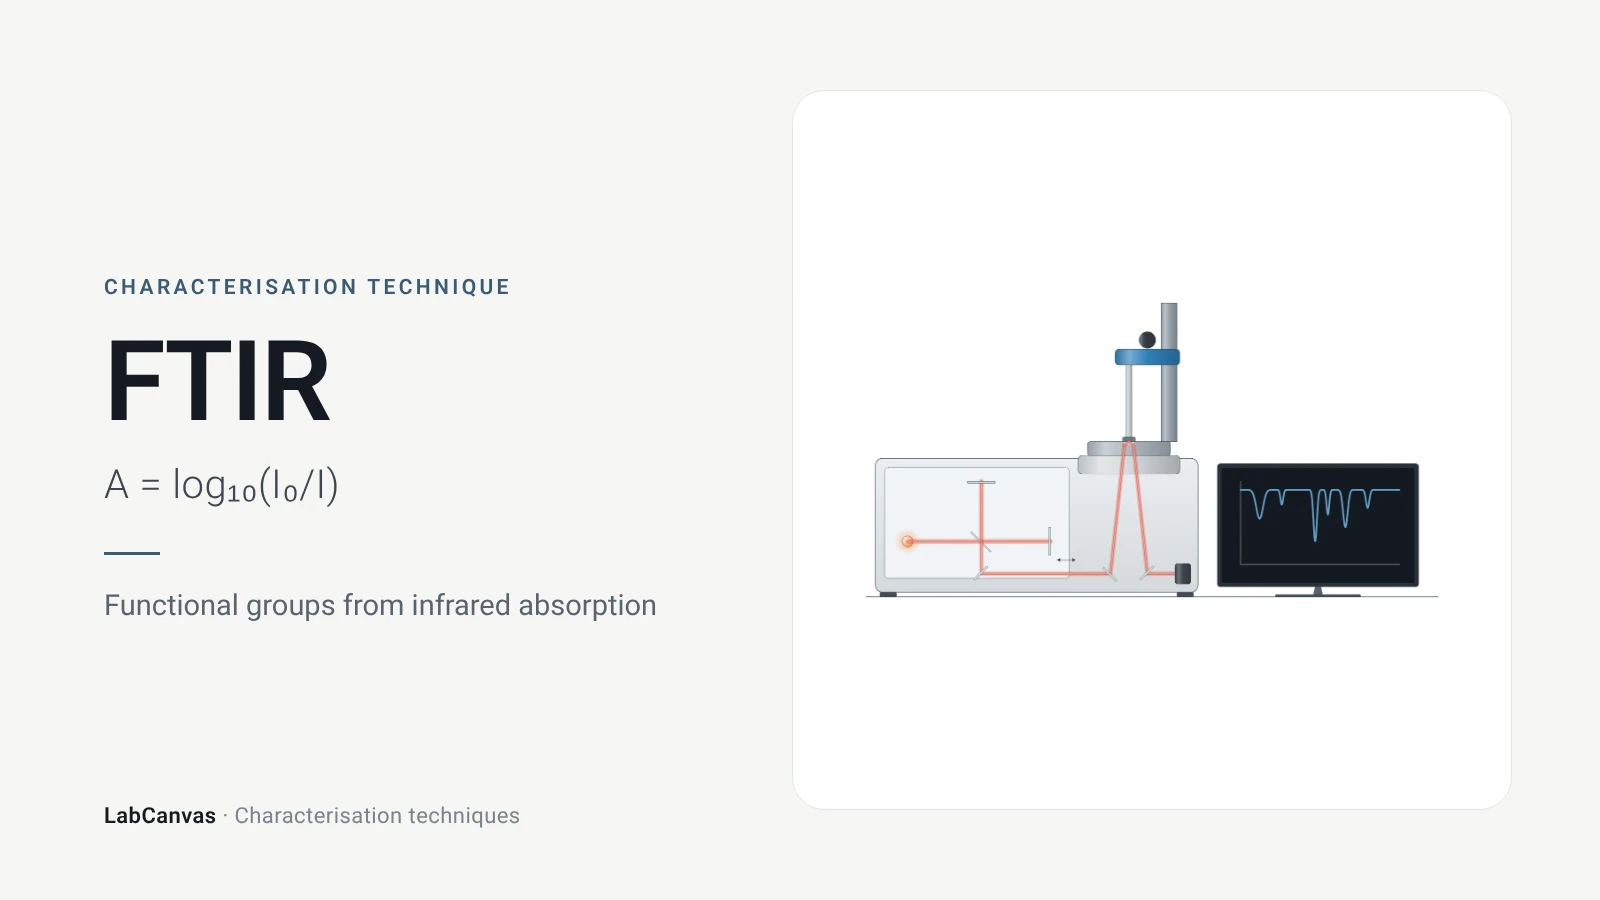
Fourier-transform infrared (FTIR) spectroscopy
FTIR spectroscopy explained: infrared absorption by bond vibrations, the interferometer and Fourier transform, wavenumber regions, ATR and reading bands.
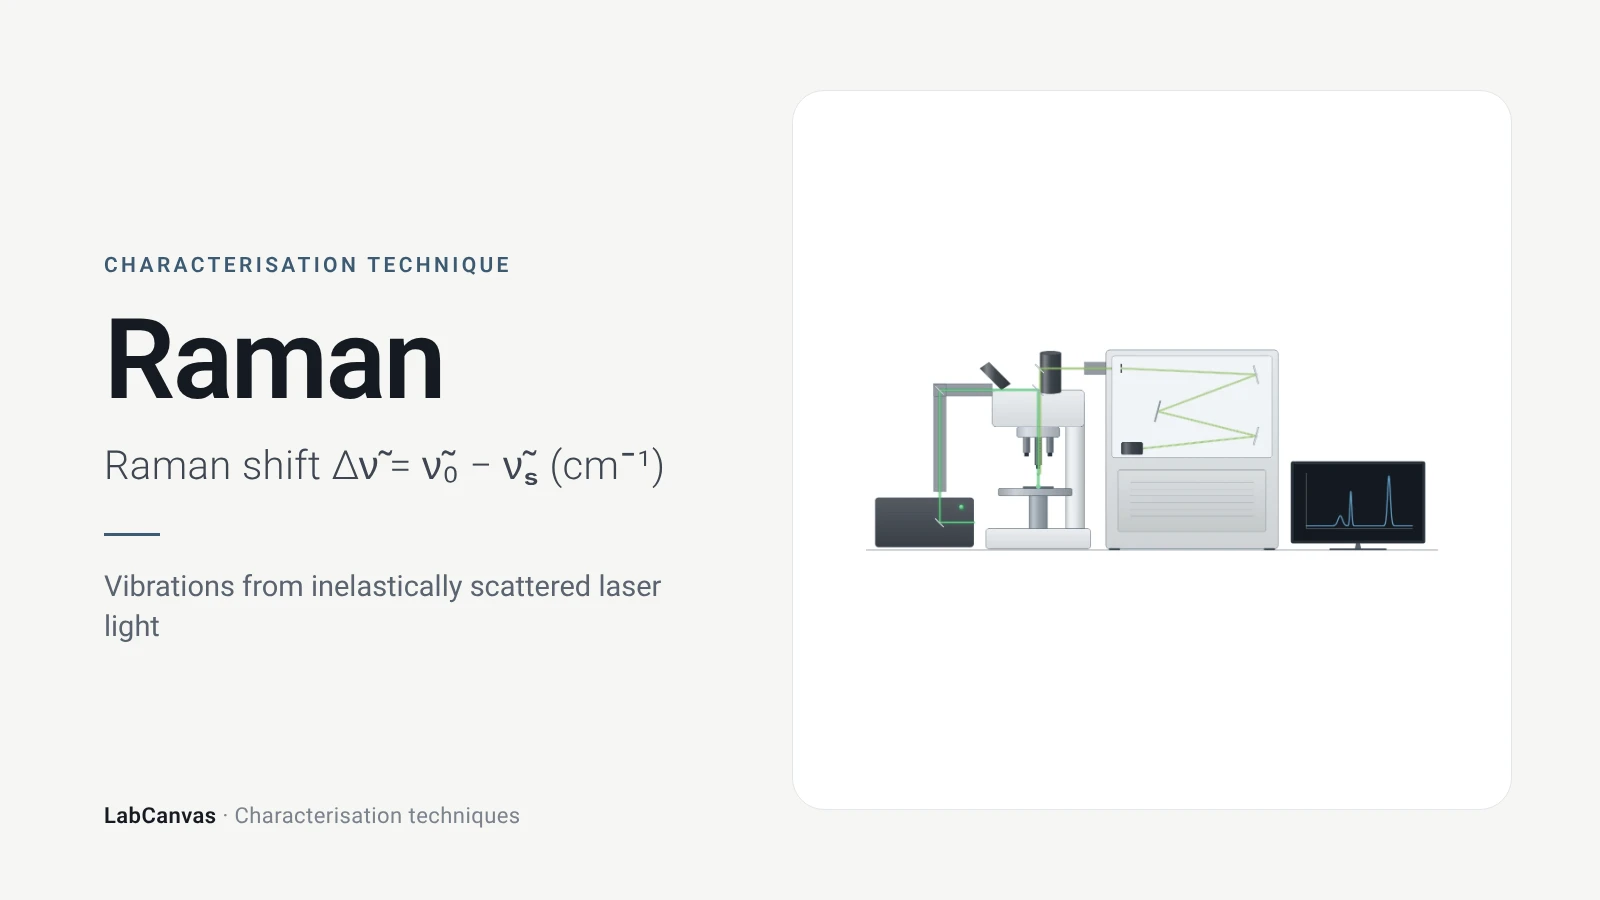
Raman spectroscopy
Raman spectroscopy explained: inelastic laser scattering, Raman shift, Stokes lines, IR complementarity, graphene D, G and 2D bands, lasers, fluorescence.
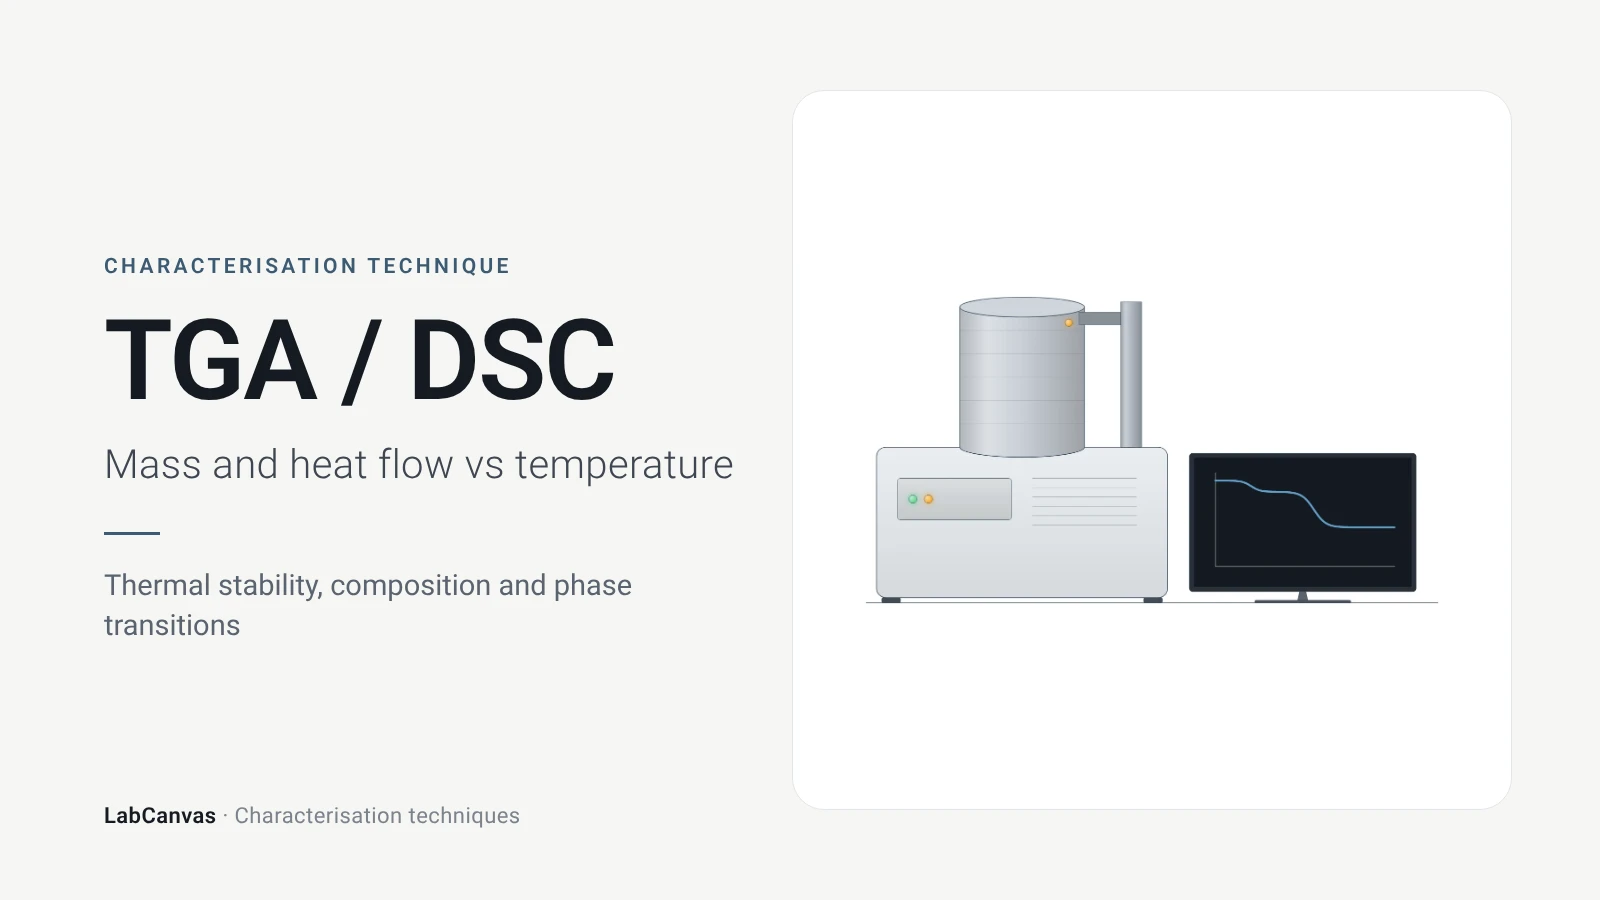
TGA and DSC (thermal analysis)
TGA and DSC explained: mass loss and DTG vs temperature, atmosphere, MOF thermal stability, and glass transition, melting and crystallisation in DSC.
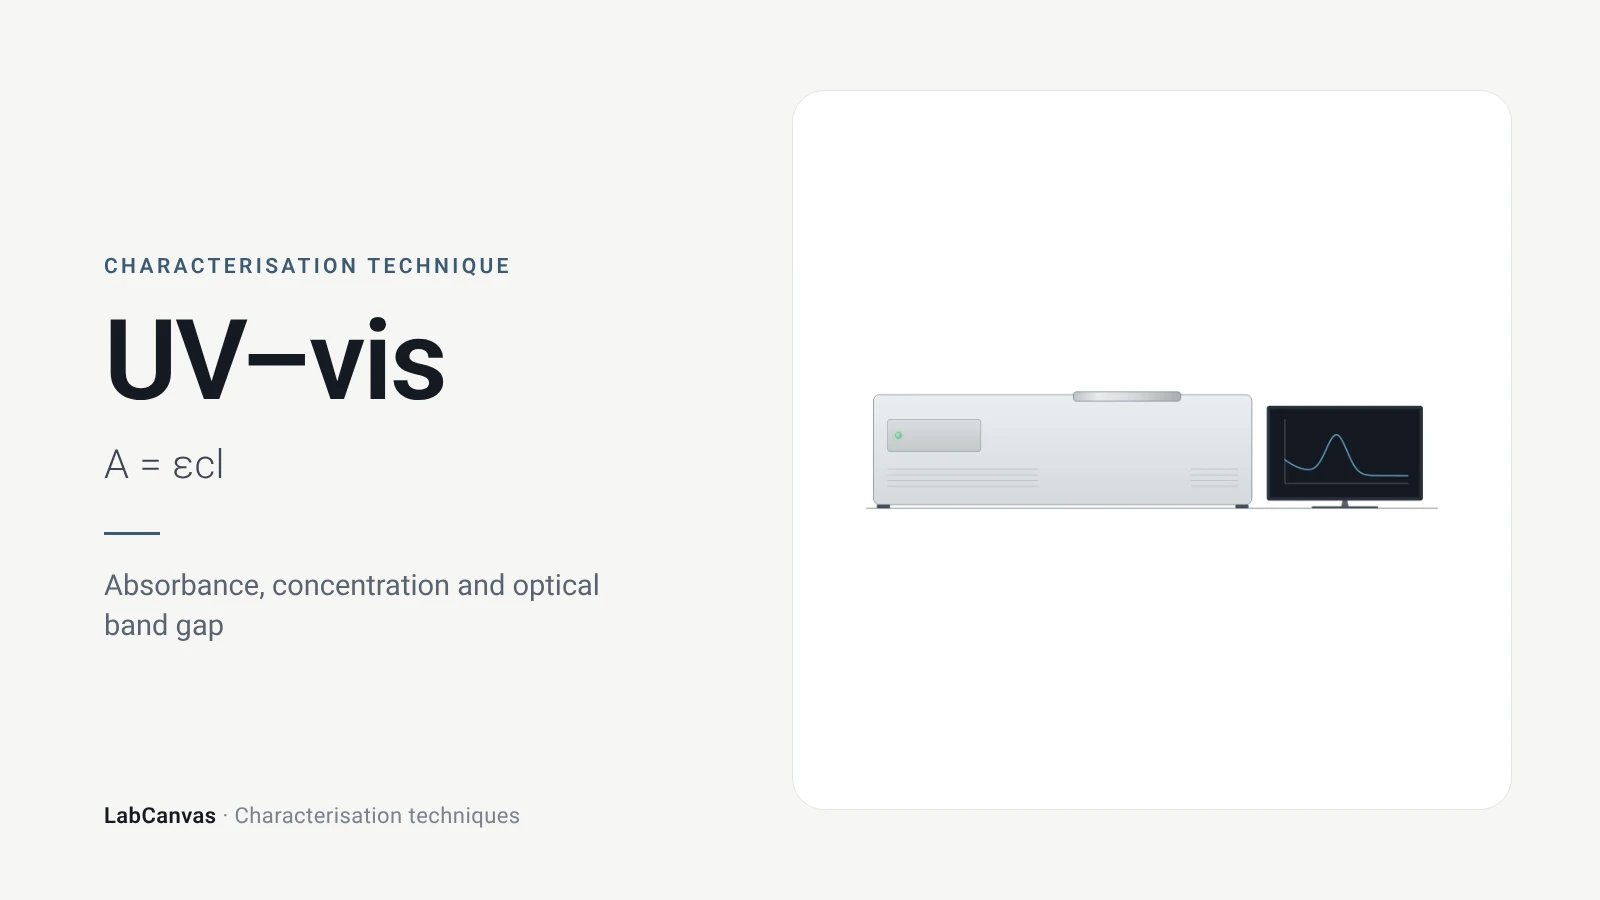
UV–vis spectroscopy
UV–vis spectroscopy explained: absorbance and the Beer–Lambert law, band gap from a Tauc plot, diffuse reflectance for powders and gold plasmon bands.
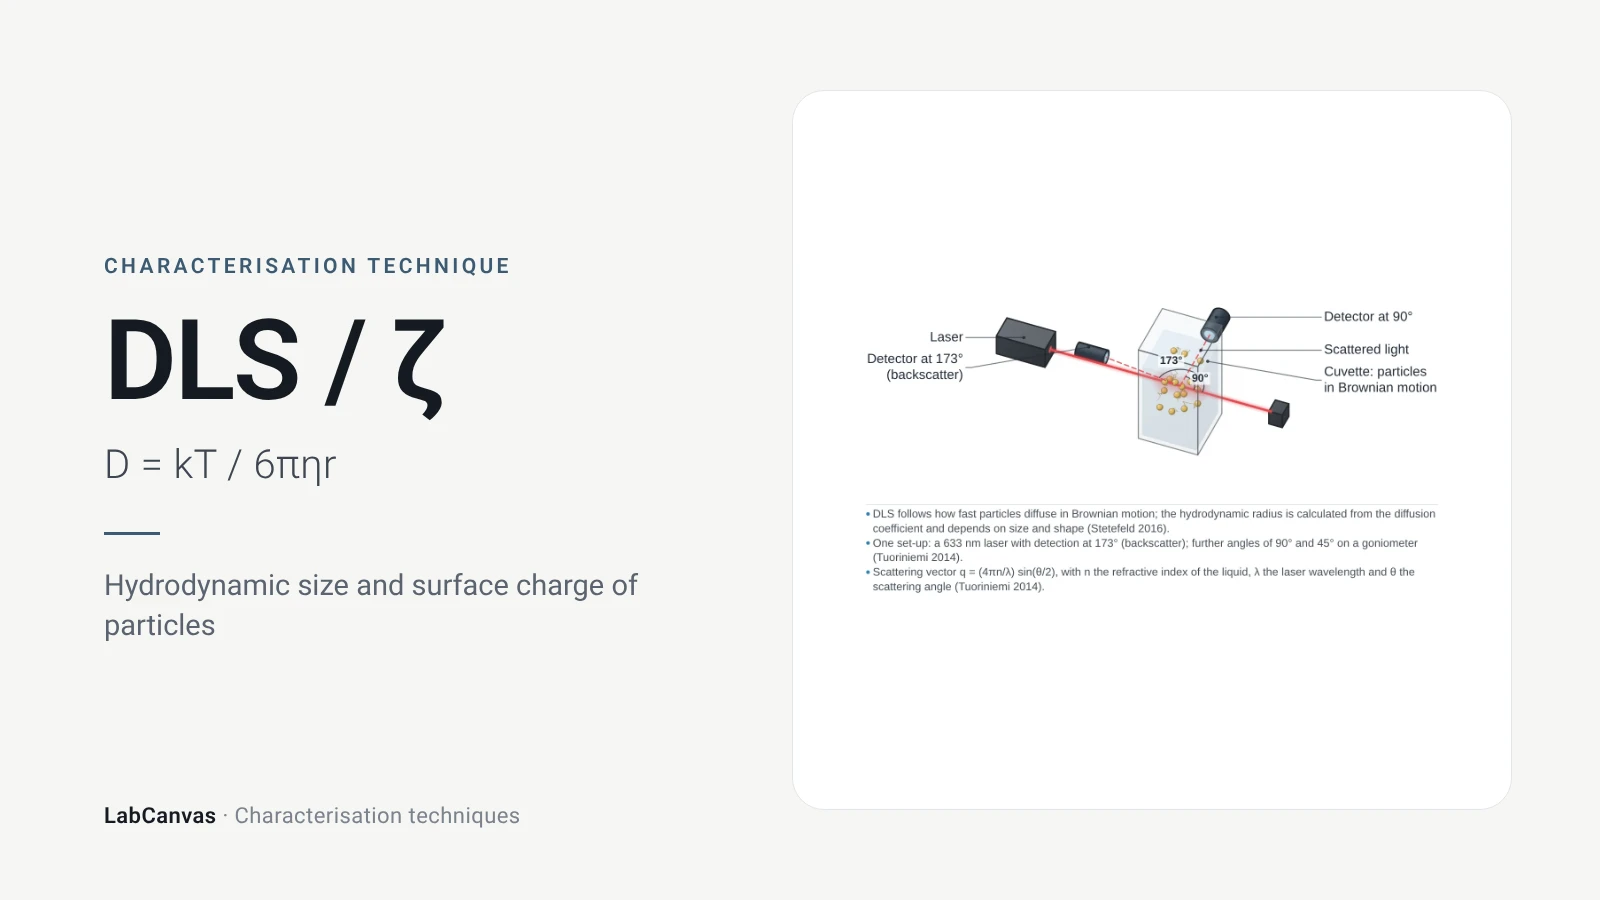
DLS and zeta potential
DLS and zeta potential explained: Brownian motion, Stokes–Einstein hydrodynamic size, intensity vs number distributions, PDI and colloidal stability.
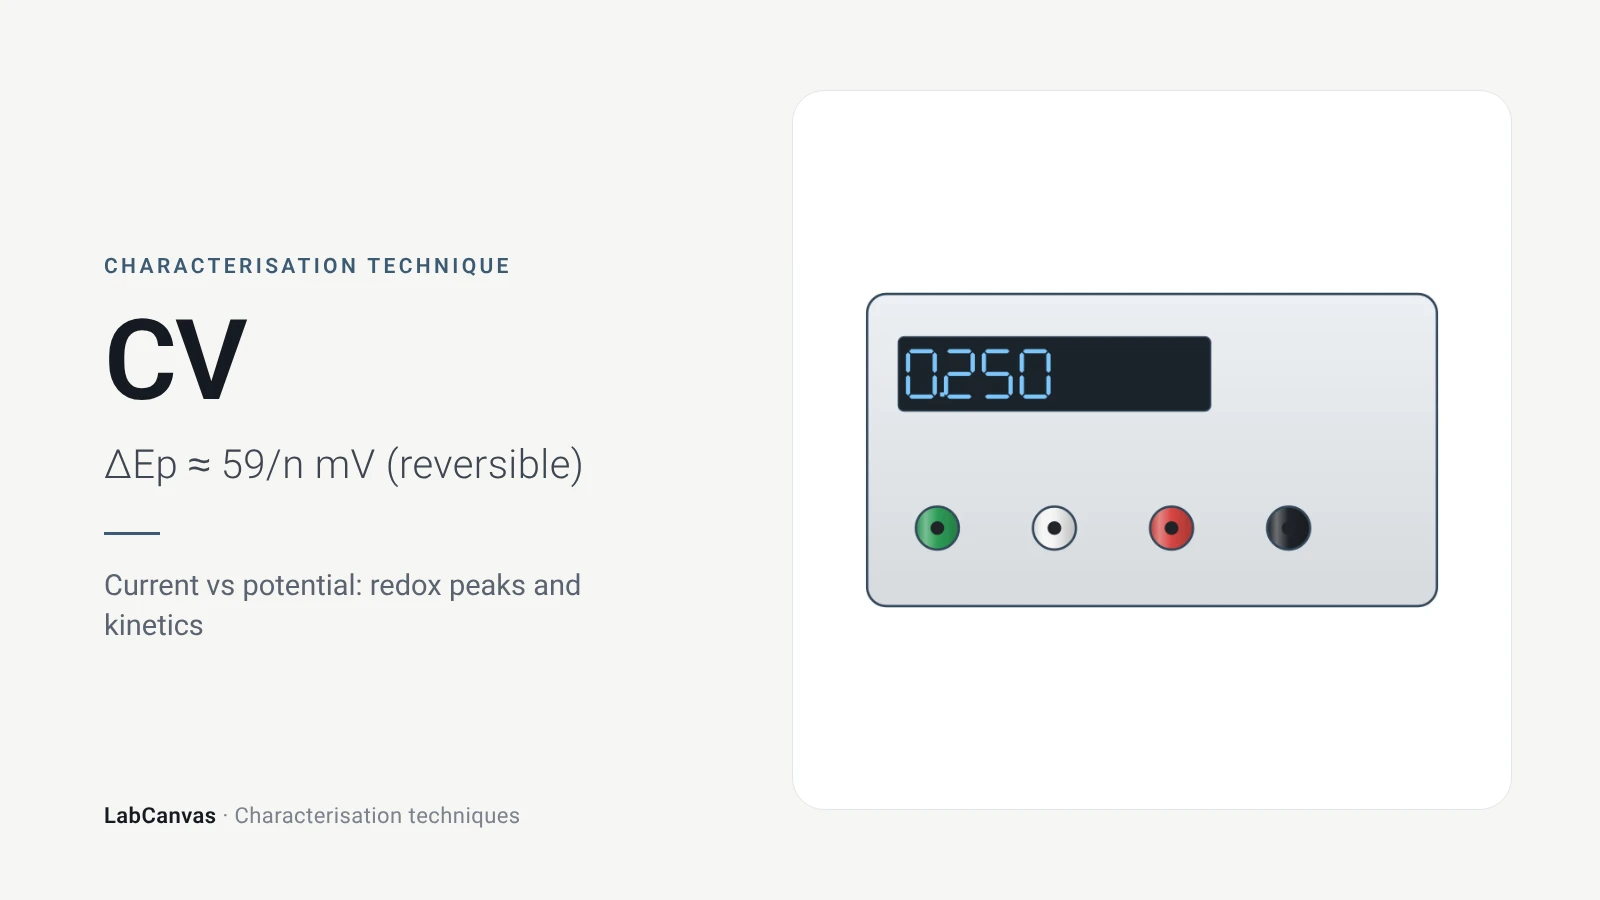
Cyclic voltammetry (CV)
Cyclic voltammetry explained: three-electrode cell, scan rate, redox peaks, 59/n mV reversibility, Randles–Ševčík, RHE conversion, ECSA and Tafel pitfalls.
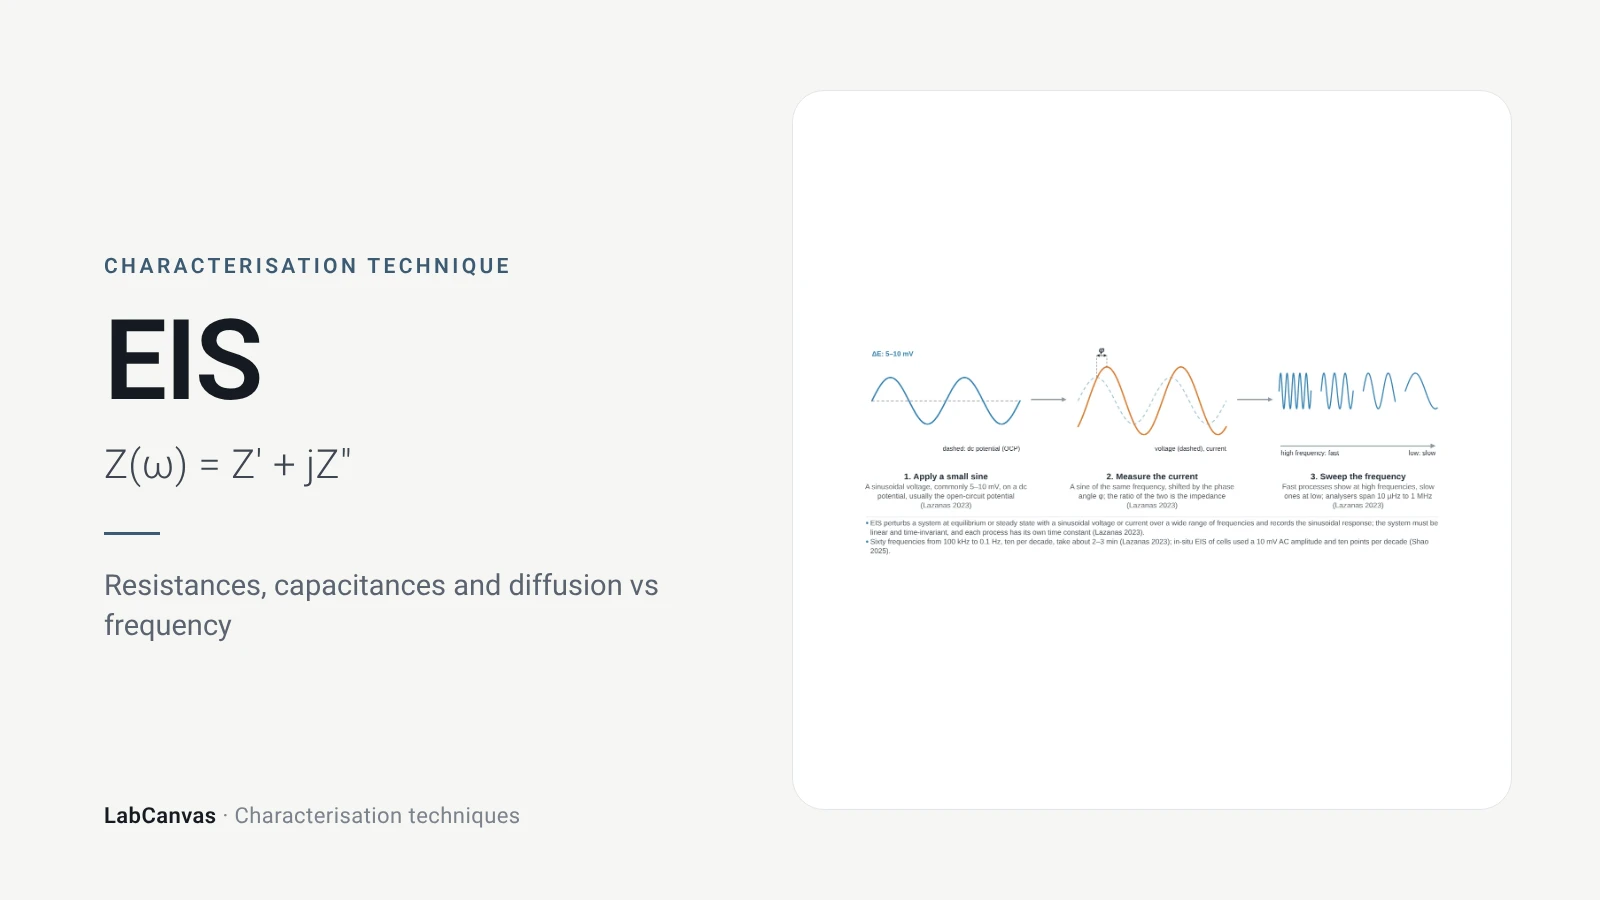
Electrochemical impedance spectroscopy (EIS)
EIS explained: small AC perturbation, Nyquist and Bode plots, Randles circuit, charge-transfer resistance, Warburg diffusion, batteries and catalysts.
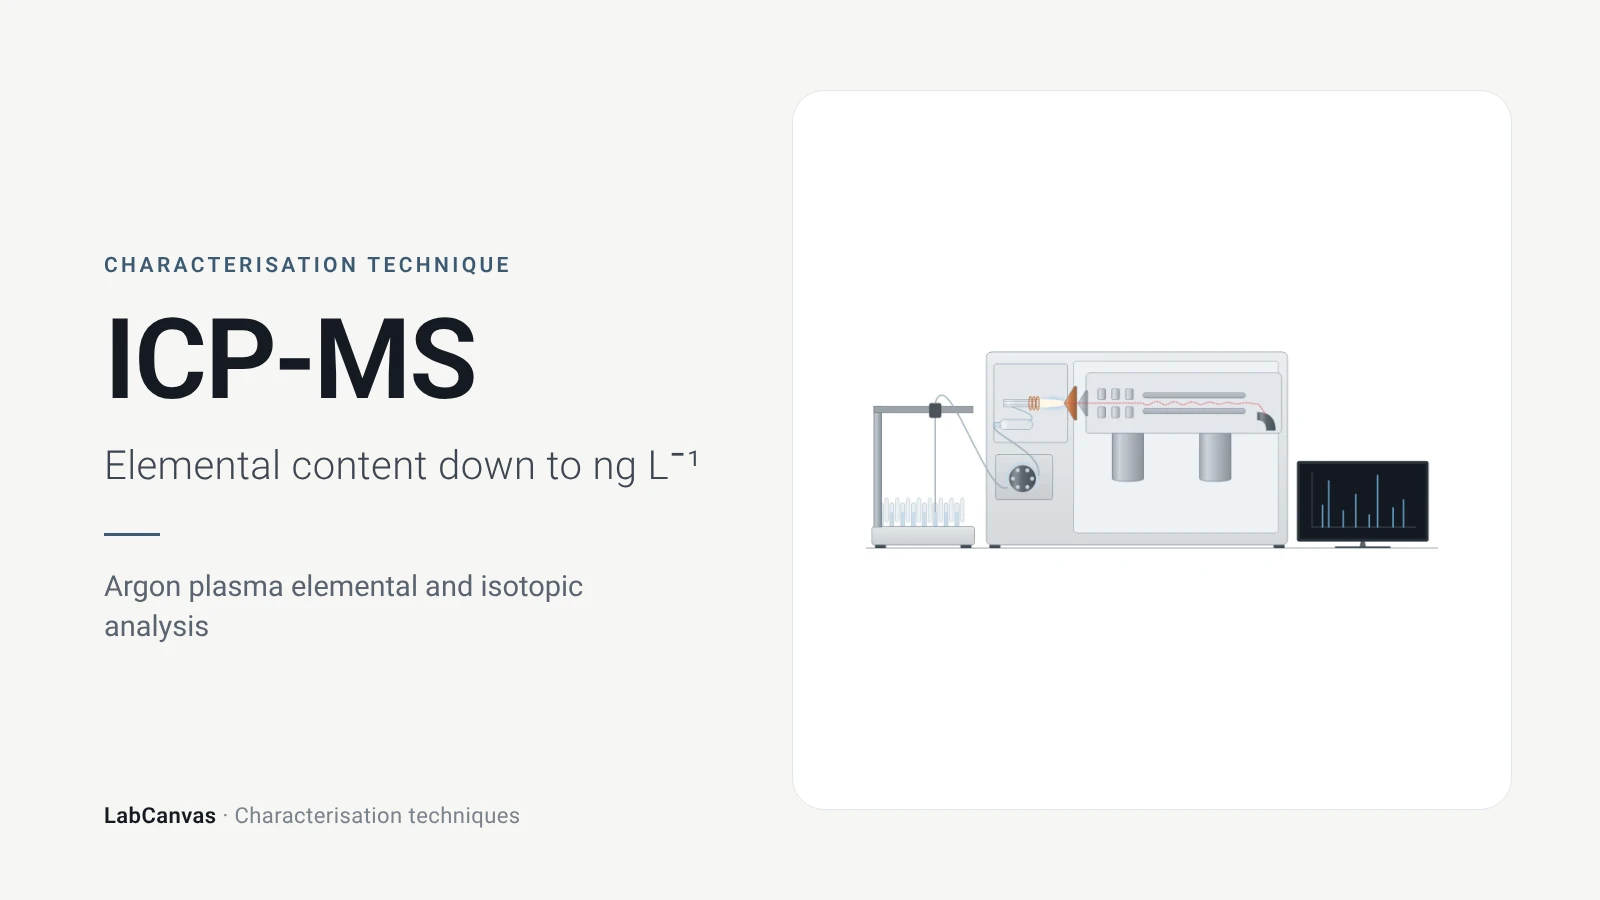
ICP-MS and ICP-OES
ICP-MS and ICP-OES explained: argon plasma, detection limits, acid digestion, interferences, single-particle ICP-MS and metal content of MOFs.