X-ray diffraction (XRD): principle, how to read a pattern, and what it tells you
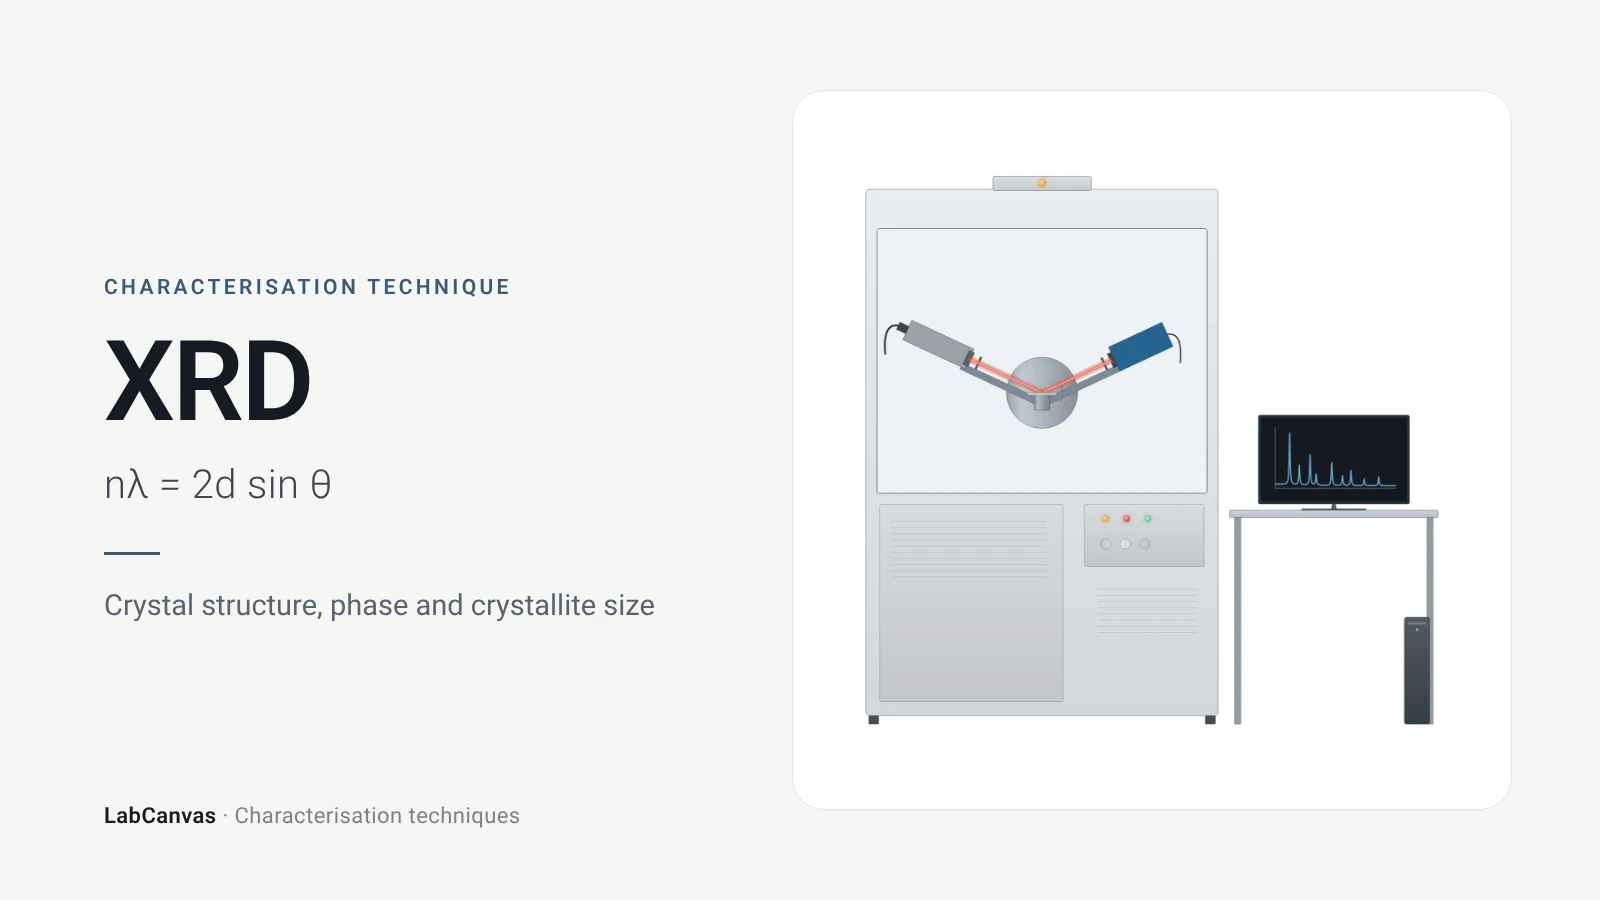
X-ray diffraction (XRD) measures how X-rays scattered by the ordered planes of atoms in a crystal interfere, giving sharp peaks at angles fixed by Bragg’s law, nλ = 2d sin θ, where d is the spacing of the lattice planes (Wang et al. 2026). Because the size and shape of the unit cell decide where those peaks fall, a diffraction pattern is a fingerprint that identifies crystalline phases and checks their purity (Abid et al. 2023). Peak widths give crystallite size and strain, and whole-pattern Rietveld refinement extracts lattice parameters and structural detail (Abid et al. 2023; Cline et al. 2015).
Contents
X-ray diffraction (XRD) at a glance
| Probe | A beam of X-rays, typically monochromatic in a laboratory diffractometer; Cu Kα with λ = 1.54187 Å is common (Shulga et al. 2021; Wang et al. 2026) |
|---|---|
| Signal measured | Diffracted intensity versus scattering angle 2θ, collected as a θ–2θ scan over many hkl reflections (Cline et al. 2015) |
| Governing law | Bragg’s law, nλ = 2d sin θ; n is the order of diffraction and d the lattice-plane spacing (Wang et al. 2026) |
| Main information | Crystalline phase and purity, lattice parameters, crystallite size, strain and defects (Abid et al. 2023; Cline et al. 2015) |
| Peak position | Set by the size and shape of the unit cell; compared with published patterns to identify phases (Abid et al. 2023) |
| Peak width | Narrow, sharp peaks for micron-sized crystals; broad, short peaks for nanocrystals (Abid et al. 2023) |
| Crystallite size | Scherrer equation for crystals below about 100 nm, shape factor K of 0.89–0.94 (Abid et al. 2023) |
| Typical powder sample | Fine, homogeneous powder, ideally 0.1–1 μm crystallites for quantitative work (Abid et al. 2023); NIST describes 5–30 μm crystallites as typical (Cline et al. 2015) |
| Single-crystal XRD | Needs one good crystal larger than about 100 μm; solves and refines new structures (Abid et al. 2023) |
| Whole-pattern analysis | Rietveld refinement fits structural, instrumental and sample parameters at once against the measured pattern (Wang et al. 2026) |
| Data quality | At least five data points above the peak FWHM for a Rietveld analysis (Cline et al. 2015) |
| What it averages over | All crystallites in the beam: powder XRD gives average, bulk information (Abid et al. 2023) |
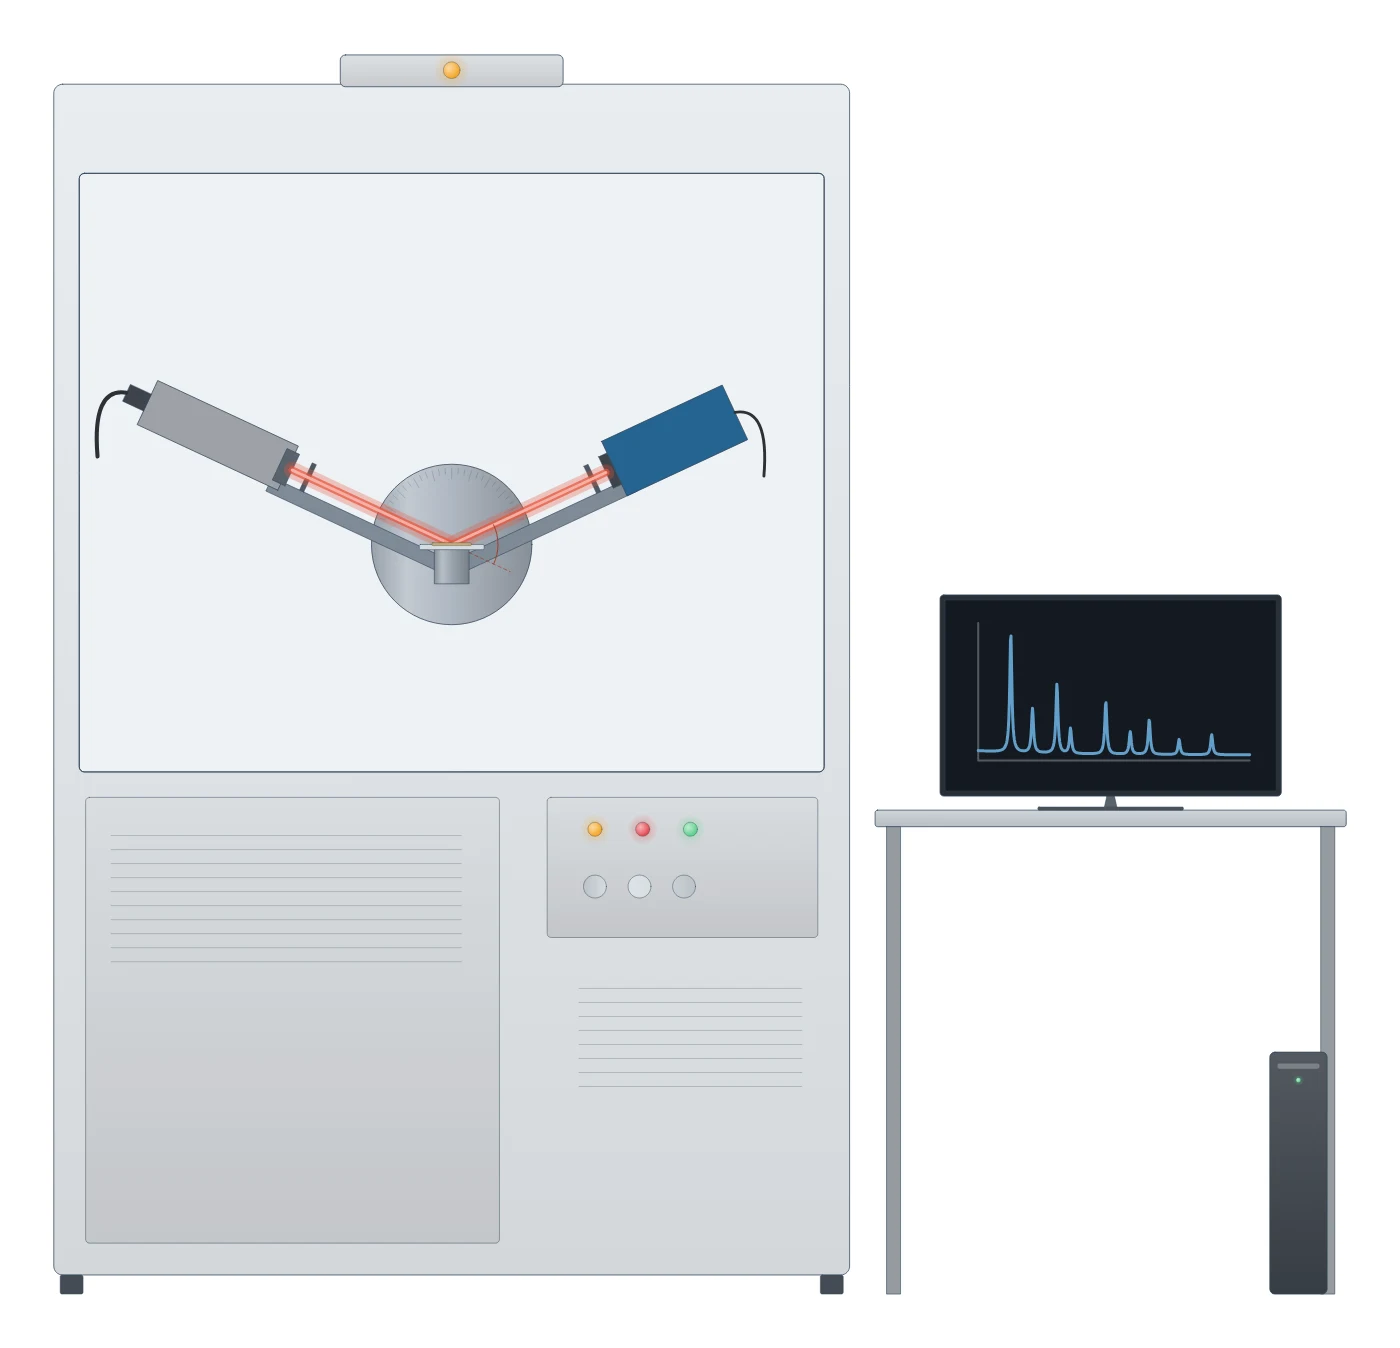
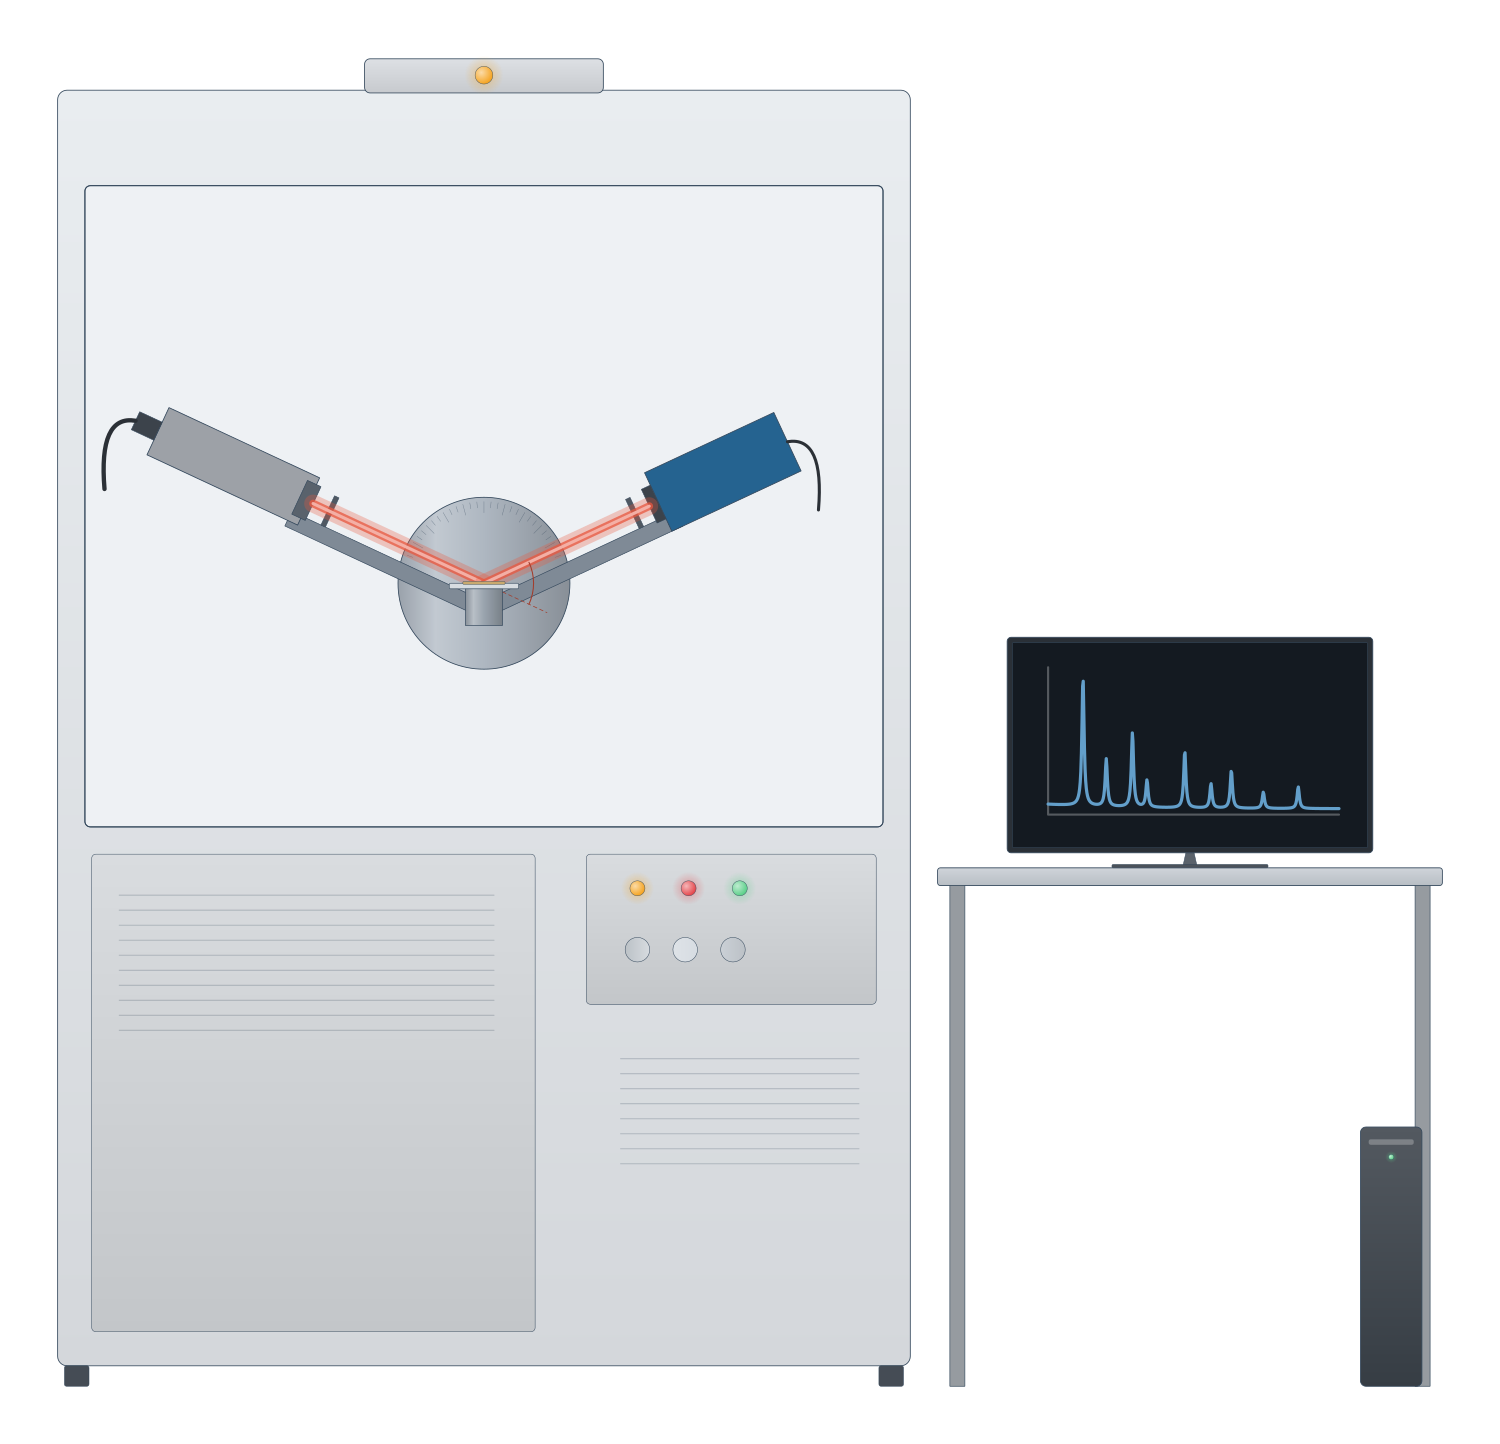
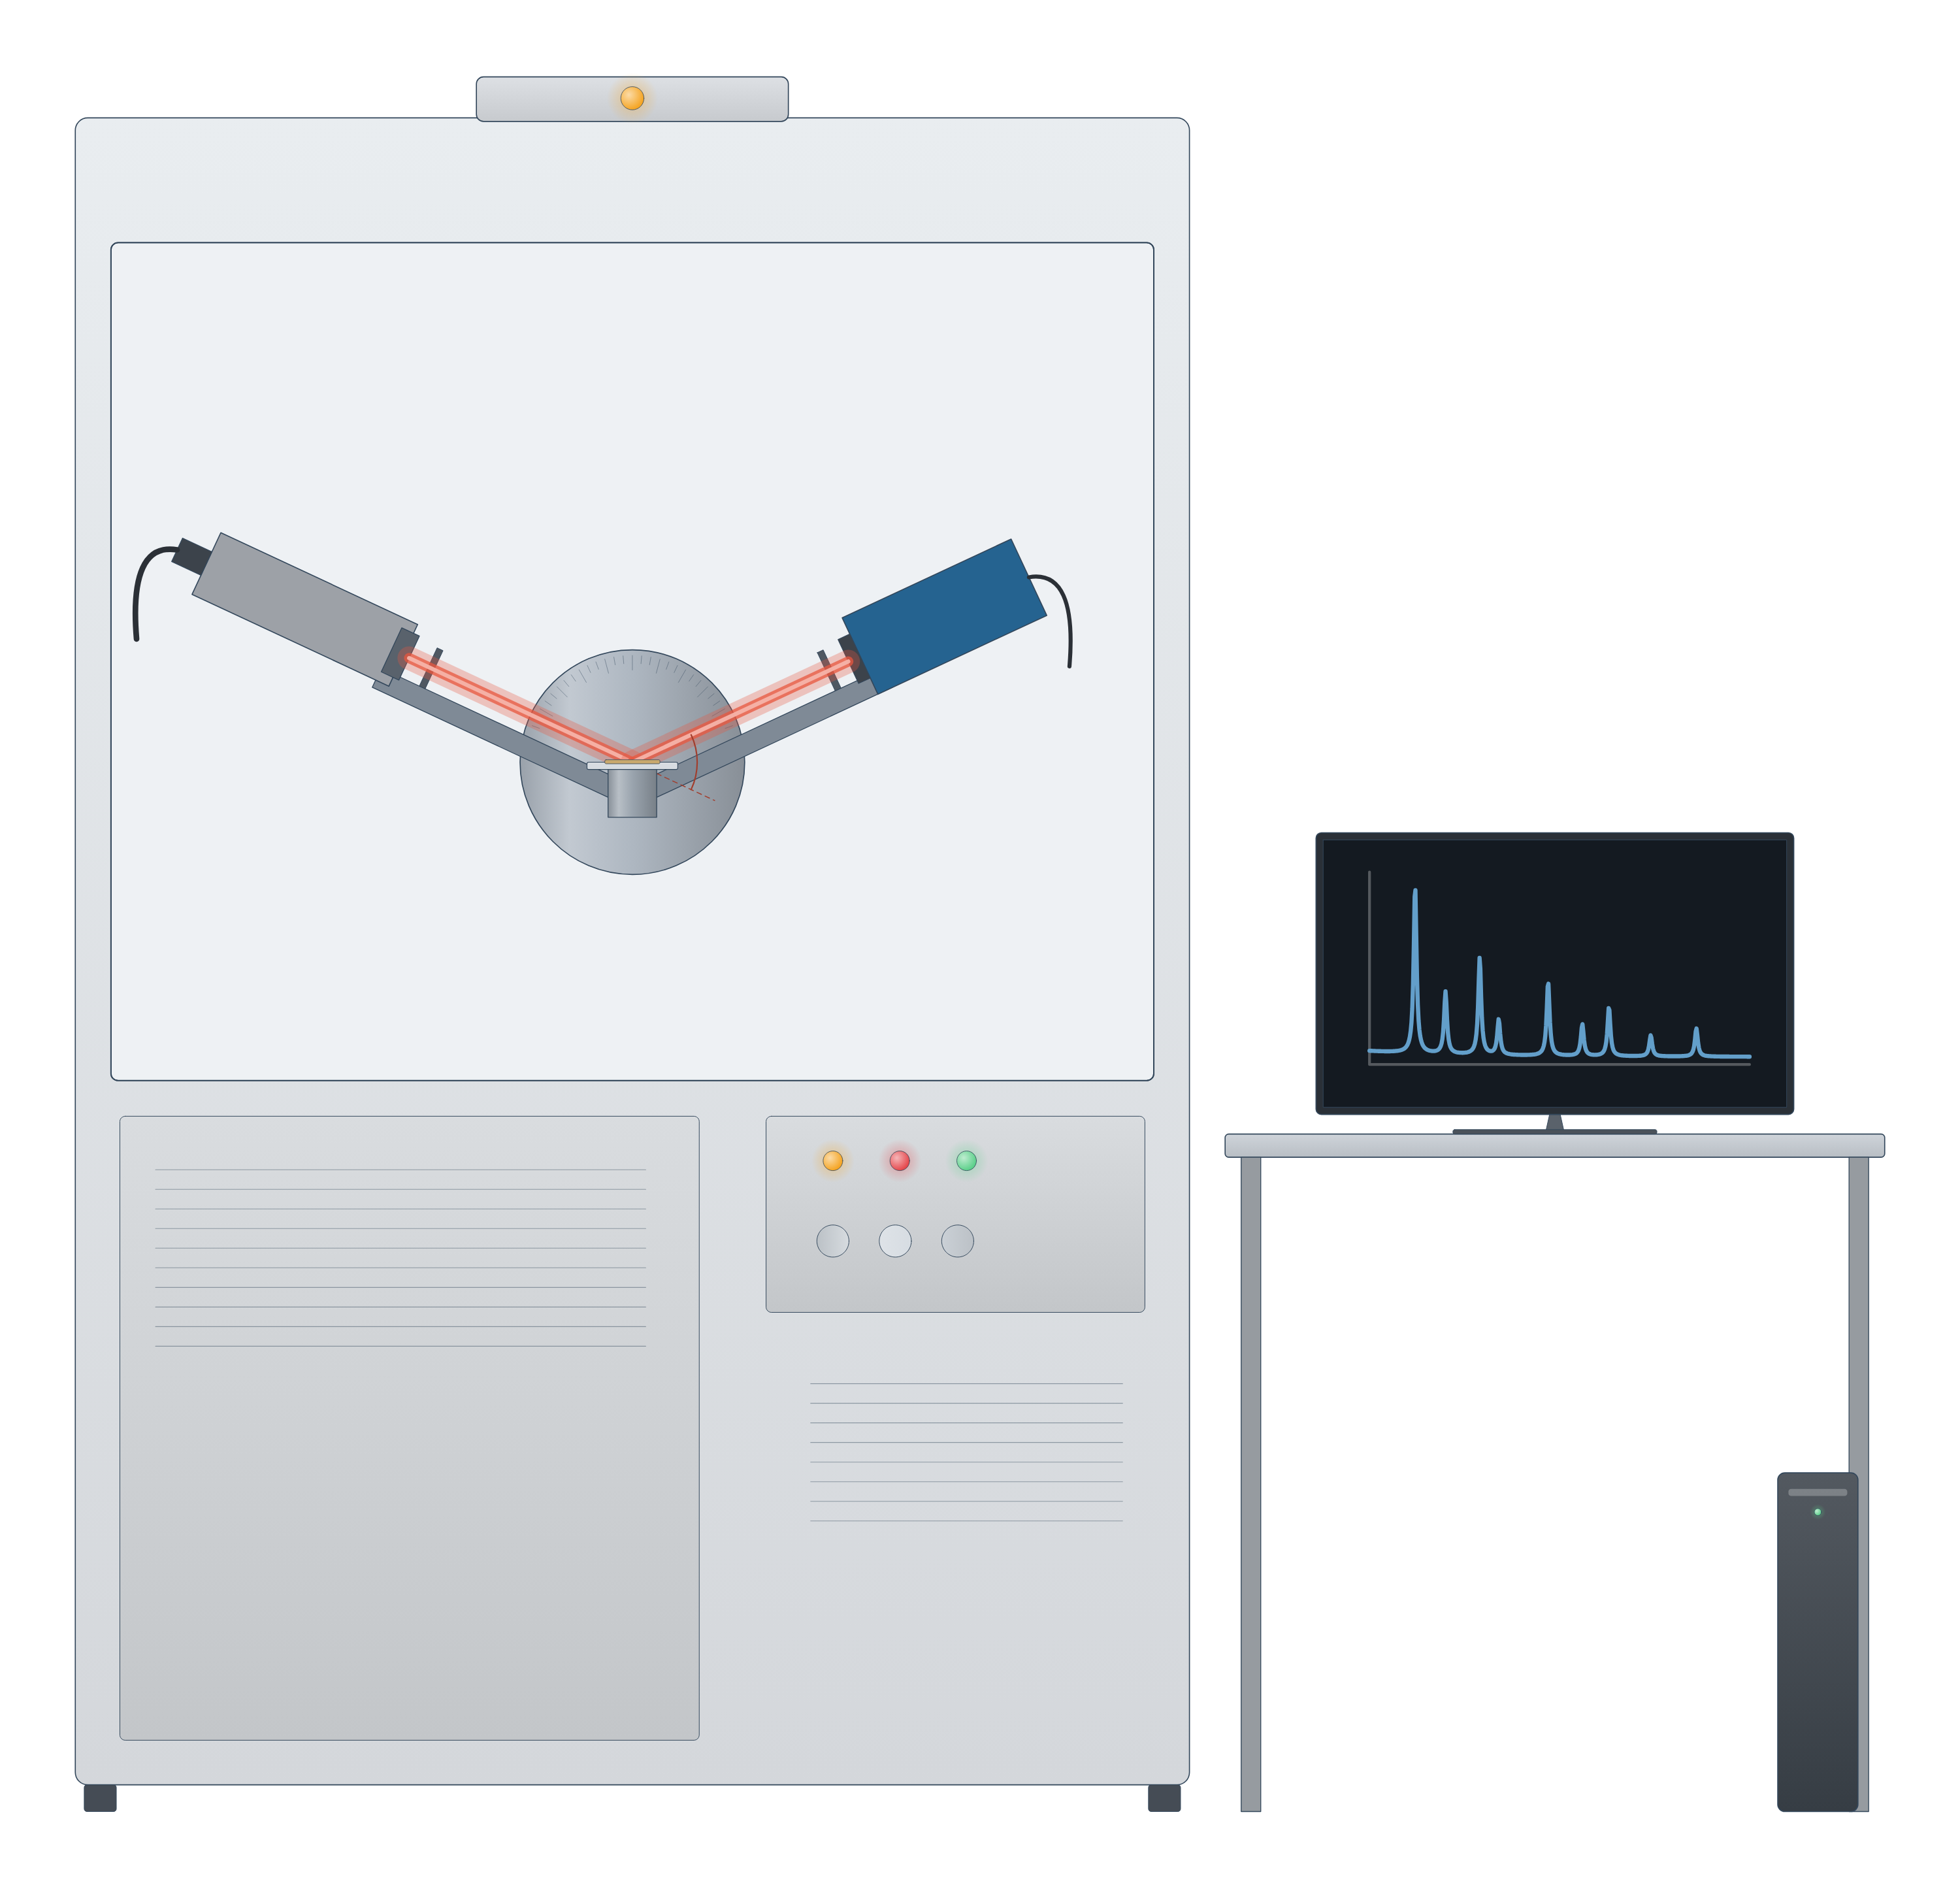
X-ray diffraction (XRD) instrument drawing (high-resolution SVG)
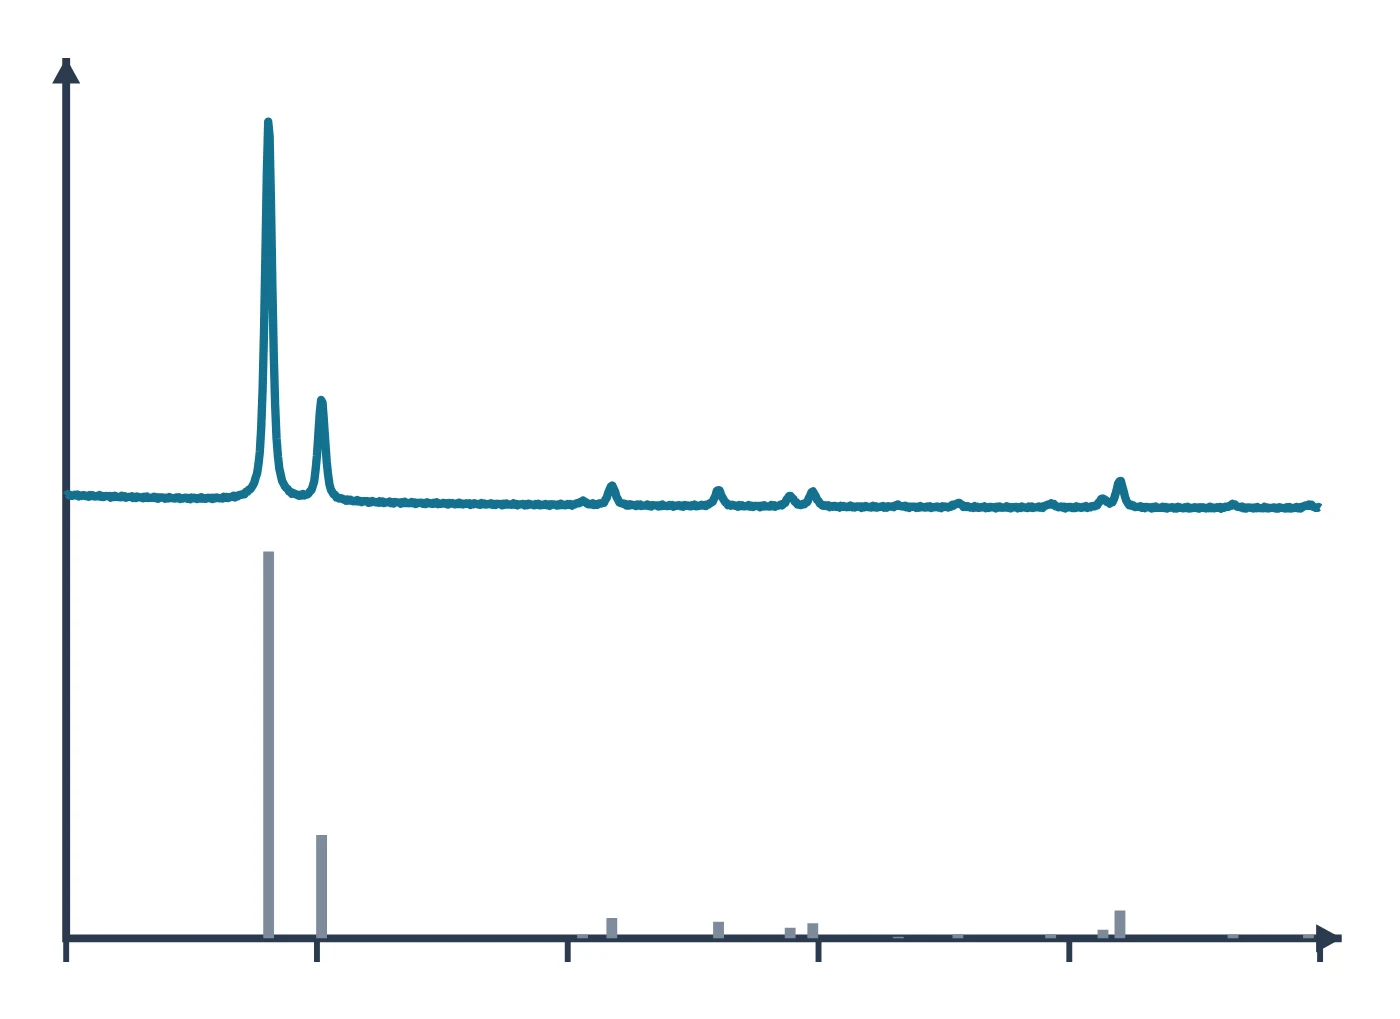
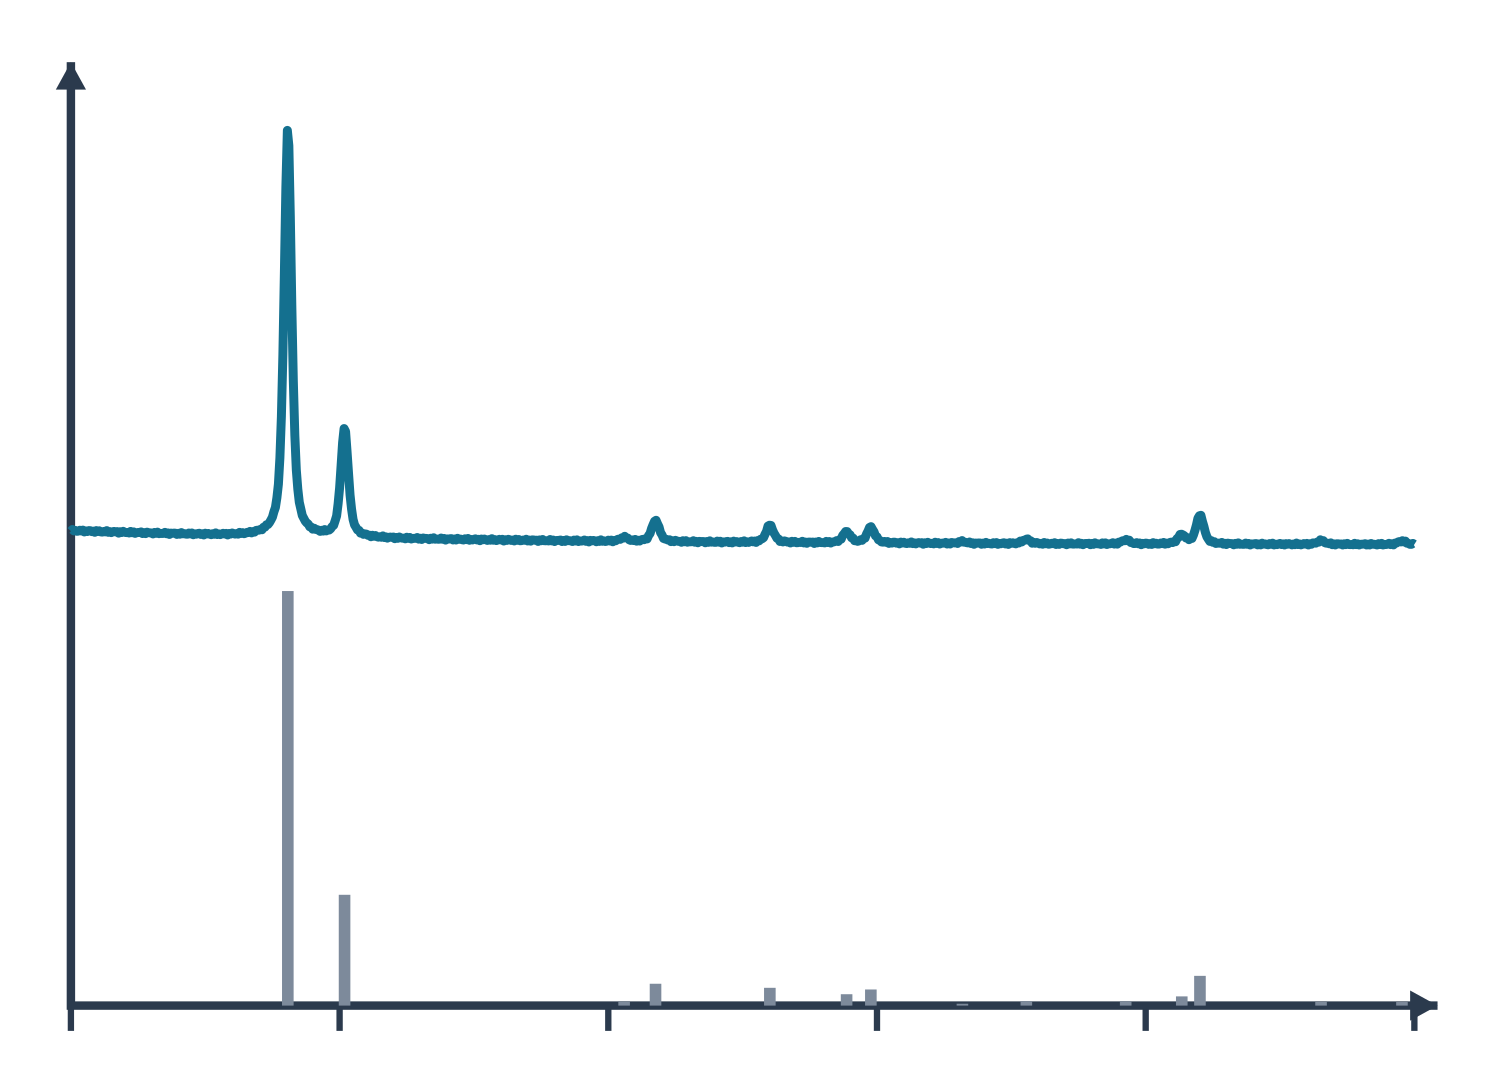
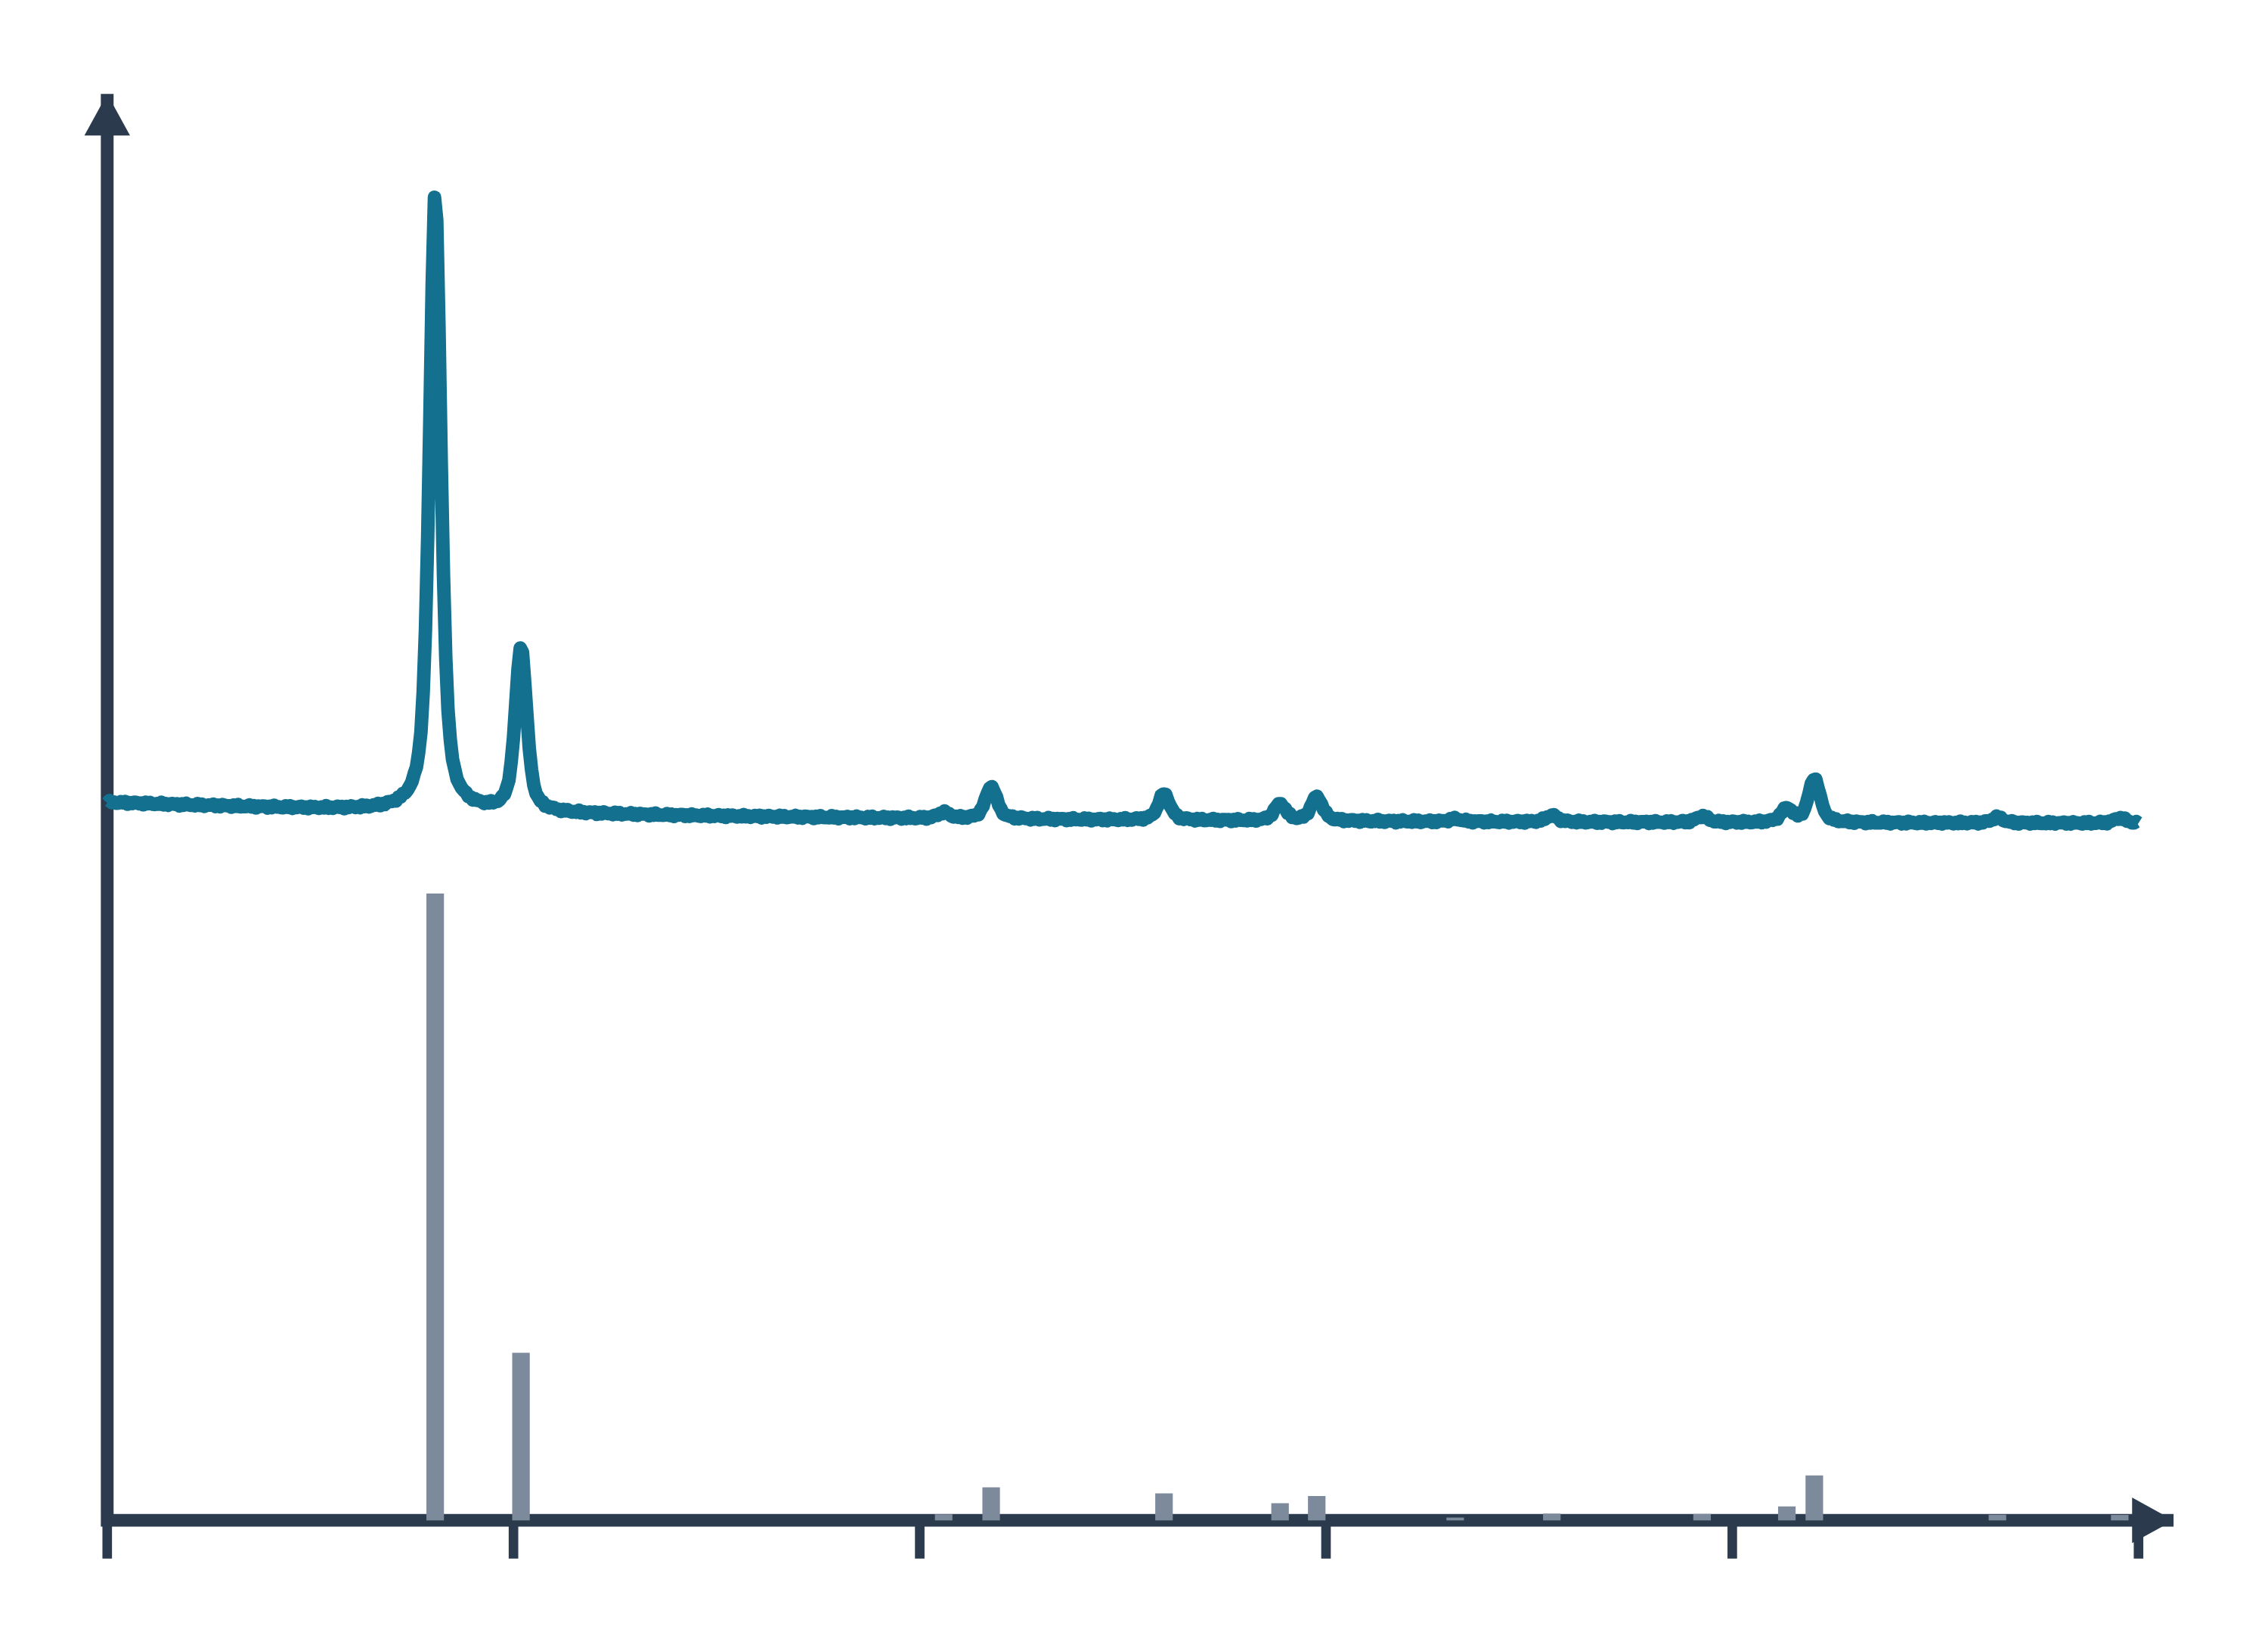
X-ray diffraction (XRD) data: an example plot to edit
How XRD works
A crystal is built from repeating unit cells, and its atoms lie on families of parallel planes. X-rays scattered by these planes reinforce one another only in particular directions, given by Bragg’s law, nλ = 2d sin θ, where λ is the X-ray wavelength, θ the angle between the beam and the planes, d the spacing between planes and n the order of diffraction (Wang et al. 2026). In practice only first-order reflections are used: a second-order reflection from the (100) planes is the same as a first-order reflection from (200) (Wang et al. 2026).
The size and shape of the unit cell set the directions in which constructive interference occurs (Abid et al. 2023), so each crystalline compound gives its own set of peak positions. A laboratory powder diffractometer scans θ–2θ and collects a whole suite of hkl reflections in one run; the common Bragg–Brentano arrangement uses a divergent beam so that many crystallites diffract at once (Cline et al. 2015).
Single-crystal XRD (SCXRD) uses one crystal and determines the full atomic arrangement of an unknown structure, but needs a well-formed crystal larger than about 100 μm; when only a powder is available, structures can be solved from high-resolution powder data with computation (Abid et al. 2023).
What the data looks like and how to read it
A powder pattern is a plot of intensity against 2θ. Read it in three parts:
- Peak positions give d-spacings through Bragg’s law and identify the phase: compare them with published or database patterns. Shifts of peaks can point to internal stress, twin boundaries, stacking faults, chemical heterogeneity, a small crystal size or structural defects (Abid et al. 2023).
- Peak widths carry size and strain. Micron-sized crystals give sharp, narrow peaks and nanocrystals give broad, short ones (Abid et al. 2023). For crystals below about 100 nm the mean crystallite size can be estimated with the Scherrer equation, D = Kλ / (β cos θ), with β the full width at half maximum and K a shape factor of about 0.89–0.94 (Abid et al. 2023). Micro-strain also broadens peaks (Cline et al. 2015).
- Peak intensities depend on the crystal structure. Whole-pattern Rietveld refinement fits a calculated pattern to the measured one, optimising structural, instrumental and sample parameters together (Wang et al. 2026); typical refined terms include lattice parameters, sample displacement and transparency, background, scale factors and atomic parameters (Cline et al. 2015). Peak shapes are usually modelled with Voigt or pseudo-Voigt functions (Wang et al. 2026).
A crystalline material with no long-range order in one direction shows it in the pattern: a highly porous carbon made from graphene oxide showed no graphite-like (002) reflection, only broad (100)/(101) features, indicating that it was not built from stacked multilayer graphene (Shulga et al. 2021).
Sample preparation
- Grind to a fine, homogeneous powder. For quantitative powder work, crystallites of about 0.1–1 μm are recommended; larger or smaller crystallites can still be used when only phase identification is needed (Abid et al. 2023).
- Get the height right. In Bragg–Brentano geometry both the diffraction angle and the sample position matter; specimen displacement and X-ray transparency of the sample shift and distort peaks (Cline et al. 2015).
- Use a standard. An internal standard mixed into the sample corrects peak positions for displacement and transparency, which an external standard cannot do; NIST Standard Reference Materials such as the LaB₆ SRM 660 series calibrate the instrument (Cline et al. 2015).
- Protect sensitive crystals. Crystals that react with light, air or moisture can be sealed in thin-walled glass capillaries under inert gas before single-crystal measurement (Abid et al. 2023).
- Collect enough points. Choose a step size that gives at least five points above the FWHM if you plan a Rietveld refinement (Cline et al. 2015).
What XRD tells you about materials
Porous frameworks. For metal–organic frameworks such as ZIF-8, HKUST-1 or UiO-66, XRD is the first check after synthesis: it confirms that the intended framework formed and that it is phase-pure before any other measurement (Abid et al. 2023). Adding a modulator such as benzoic acid to a Zr framework grew larger crystals, seen both in electron micrographs and as narrower XRD peaks (Abid et al. 2023). Pair XRD with SEM for crystal size and shape and with BET gas sorption to check that the pores are open after activation.
Carbon and 2D materials. Peak positions and widths show whether layers are stacked: a high-surface-area carbon derived from graphene oxide lacked the graphitic (002) peak and had coherent scattering domains of about 2.8 nm by the Scherrer formula (Shulga et al. 2021). Compare with graphene and Raman spectroscopy for disorder.
Battery electrodes. Operando energy-dispersive XRD can follow composition and lattice parameters inside working cells during cycling (Wang et al. 2026), an approach suited to battery materials such as LiFePO₄ and NMC cathodes.
Other crystalline solids. The same phase-identification logic applies to zeolites and perovskites. For surface chemistry, which XRD does not see, use XPS; for local structure at the nanoscale use TEM. All methods are compared on the characterisation techniques hub.
Common mistakes and limits
- Treating the Scherrer size as particle size. Scherrer gives the size of coherently diffracting crystallites, not of particles: polycrystalline particles make the two differ, and the shape constant K is uncertain for polydisperse samples (Jeong et al. 2008). Compare with TEM images.
- Ignoring instrument broadening and aberrations. The observed peak maximum does not necessarily reflect the true hkl spacing on a laboratory diffractometer; calibrate with a standard reference material before quoting precise lattice parameters (Cline et al. 2015).
- Reading a shifted peak as a new phase. Sample displacement shifts all peaks systematically; an internal standard separates this from real lattice changes (Cline et al. 2015).
- Forgetting that powder XRD is an average. PXRD reports an average over all the crystallites in the beam, not the structure of any one grain, and extremely small crystals (below about 10 nm) are better studied by small-angle X-ray scattering (Abid et al. 2023).
- Thin films on substrates. Strong substrate reflections can swamp a thin film’s pattern; high-resolution TEM is an alternative check of crystallinity (Abid et al. 2023).
- Ignoring texture. When intensities matter, preferred orientation of the crystallites (texture) has to be modelled, for example with a spherical-harmonic term in a Rietveld refinement (Cline et al. 2015).
How to draw the XRD setup and data in LabCanvas
For a methods figure or graphical abstract, show the X-ray source, the sample and the detector with the incident and diffracted beams at angle θ, and next to it the pattern with labelled peaks. In LabCanvas the figure editor’s Library has the diffractometer as an editable object, including a cutaway of the beam path from tube to sample to detector, and an editable XRD data plot. You can label peaks with their hkl indices, mark the 2θ scale, add a reference pattern for comparison and export the figure at journal resolution. To estimate crystallite size from a peak width, use the Scherrer calculator linked below.
Powder XRD, single-crystal XRD and SAXS compared
| Method | What it measures | Sample | Length scale | Source |
|---|---|---|---|---|
| Powder XRD (PXRD) | Phase identity and purity, lattice parameters, crystallite size, strain; averaged over many crystallites | Fine homogeneous powder, ideally 0.1–1 μm crystallites | Crystal structures; Scherrer sizes below about 100 nm | Abid et al. 2023 |
| Single-crystal XRD (SCXRD) | Full atomic arrangement of a new or unknown structure | One good crystal larger than about 100 μm | Atomic positions in the unit cell | Abid et al. 2023 |
| Small-angle X-ray scattering (SAXS) | Particle size, size distribution, shape and hierarchical organisation | Sample in transmission, area detector | About 1–1000 nm, scattering angles 0.1–10° | Abid et al. 2023 |
Related techniques
X-ray photoelectron spectroscopy (XPS)
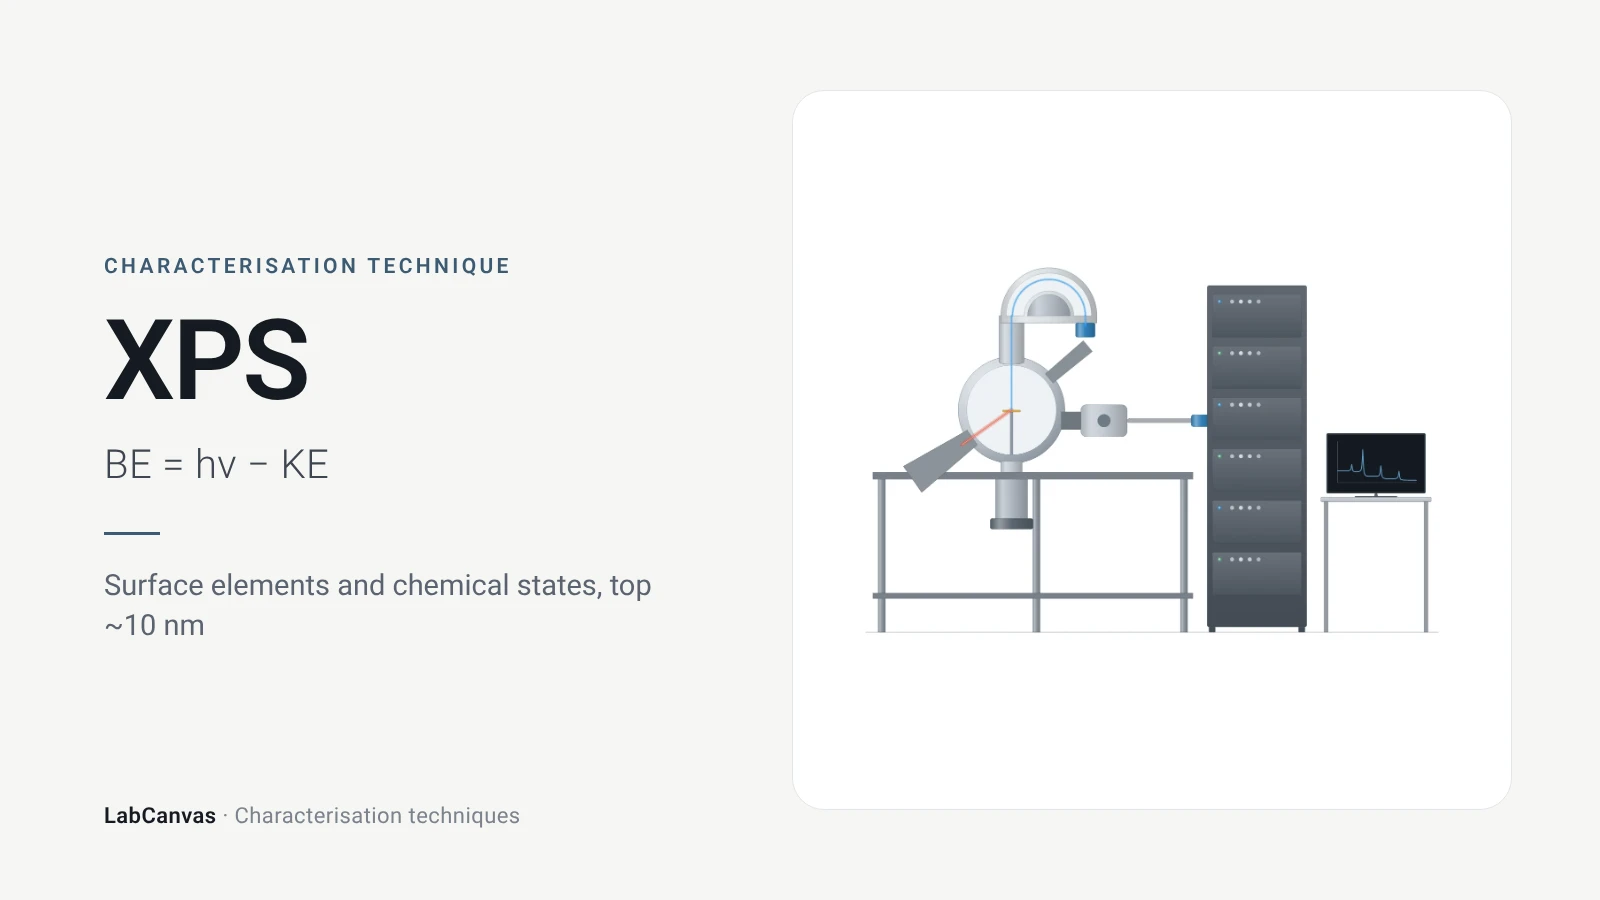
XPS explained: binding energy, 2–10 nm surface sensitivity, survey vs high-resolution spectra, chemical shifts, C 1s charge referencing and depth profiling.
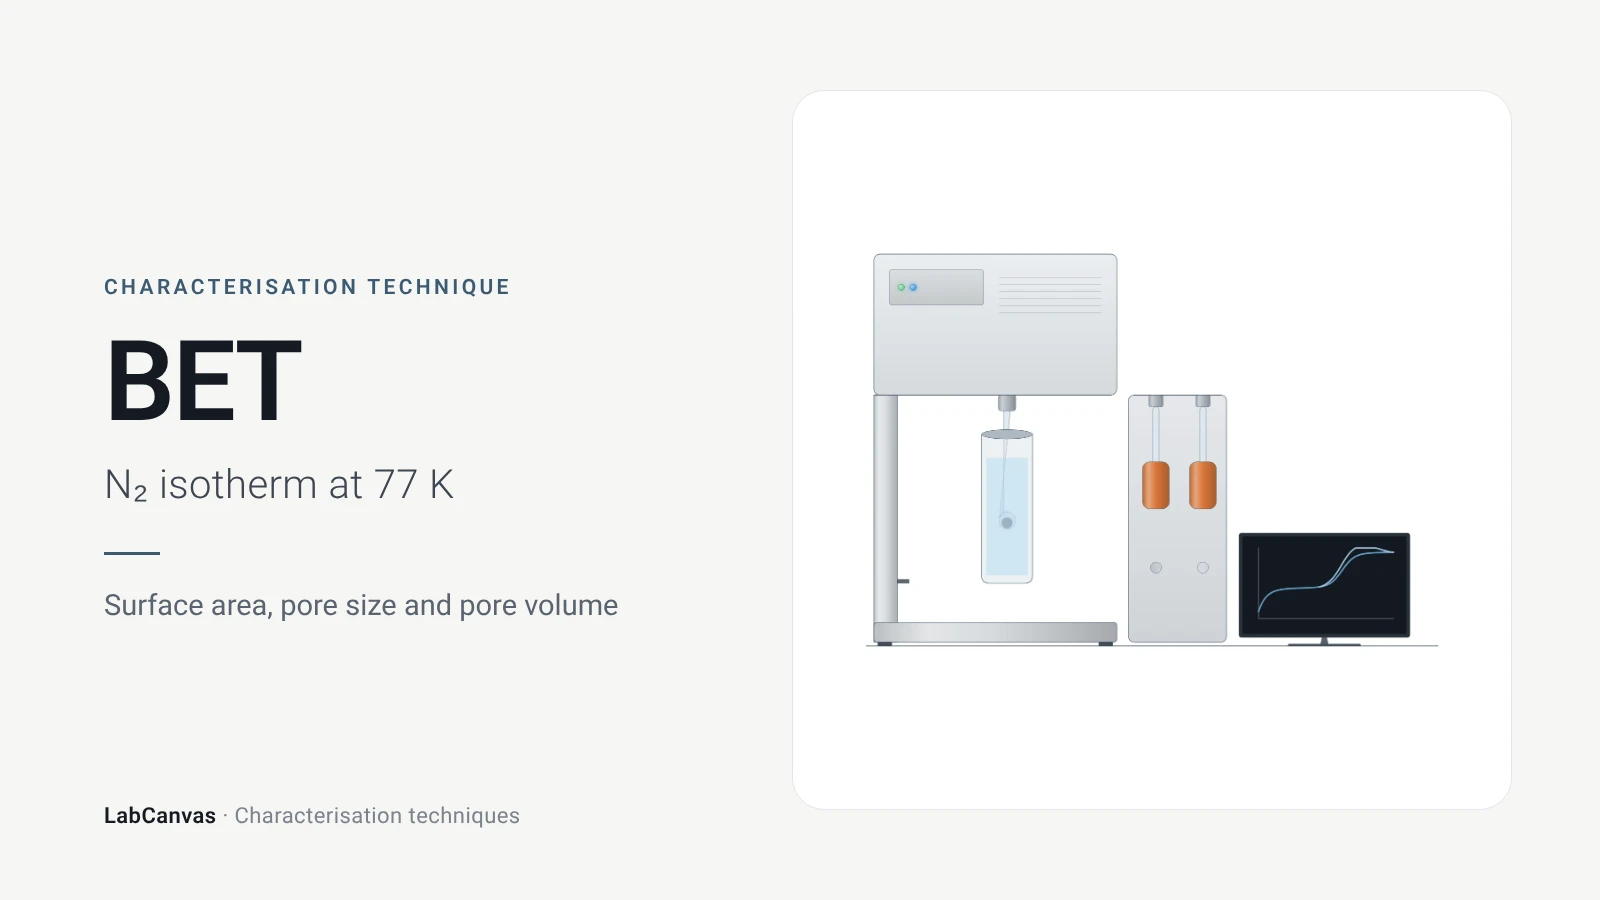
Gas sorption and BET surface area
BET surface area explained: N₂ sorption at 77 K, IUPAC isotherm types, the BET range and Rouquerol criteria, pore size, degassing and limits for MOFs.
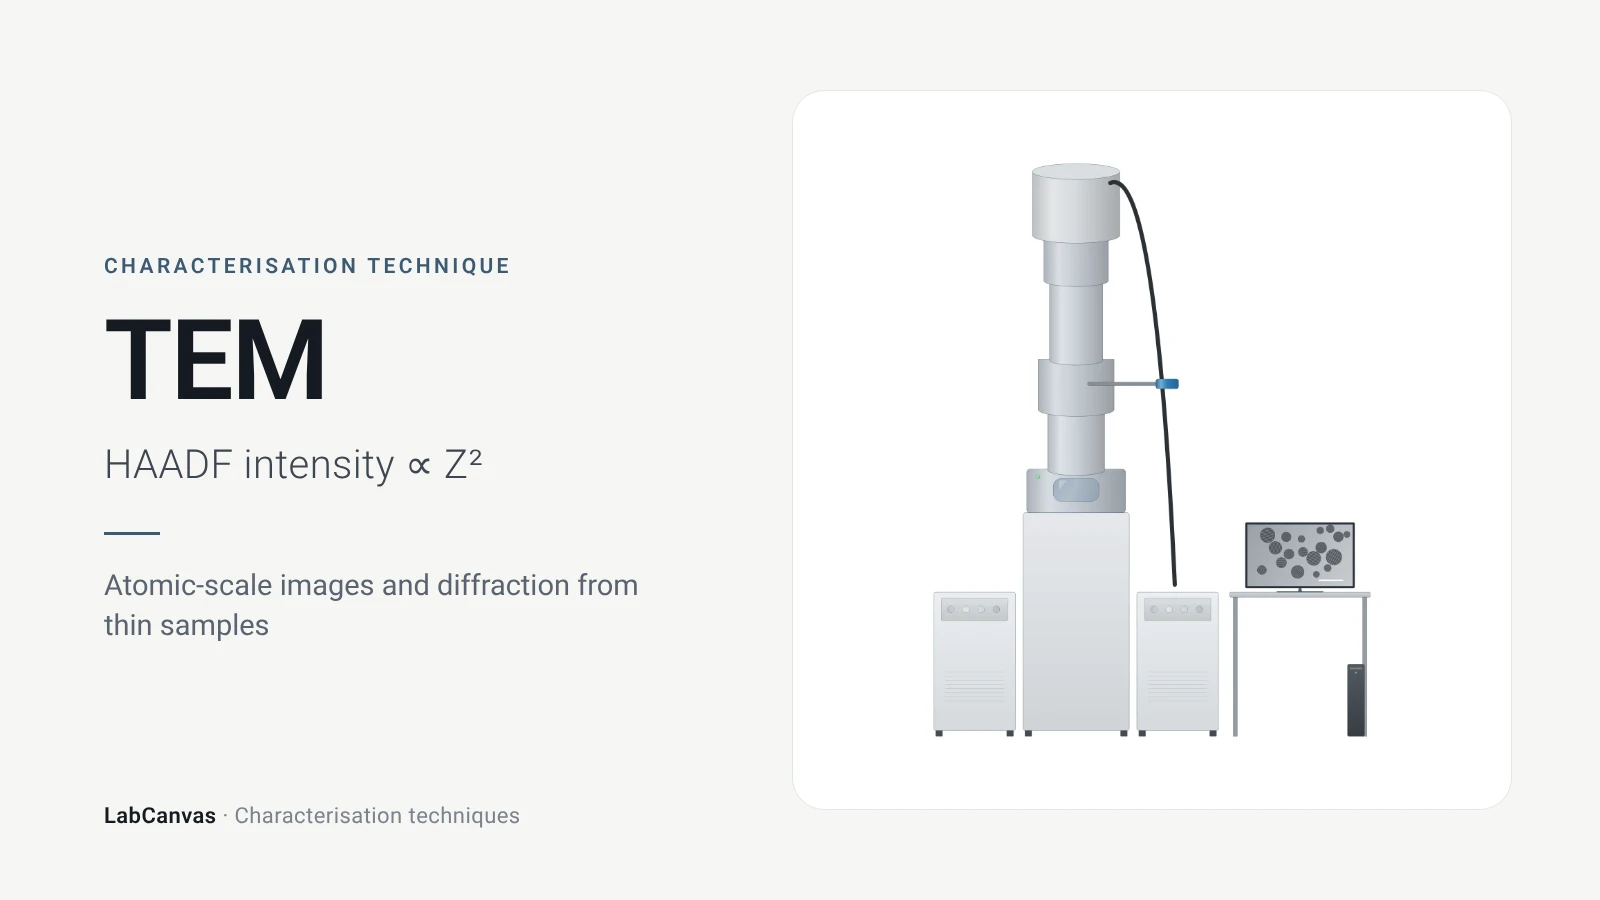
Transmission electron microscopy (TEM)
How TEM works: bright field, HRTEM lattice images, SAED diffraction, STEM-HAADF Z-contrast, EDS/EELS, sample thickness and beam damage of MOFs.
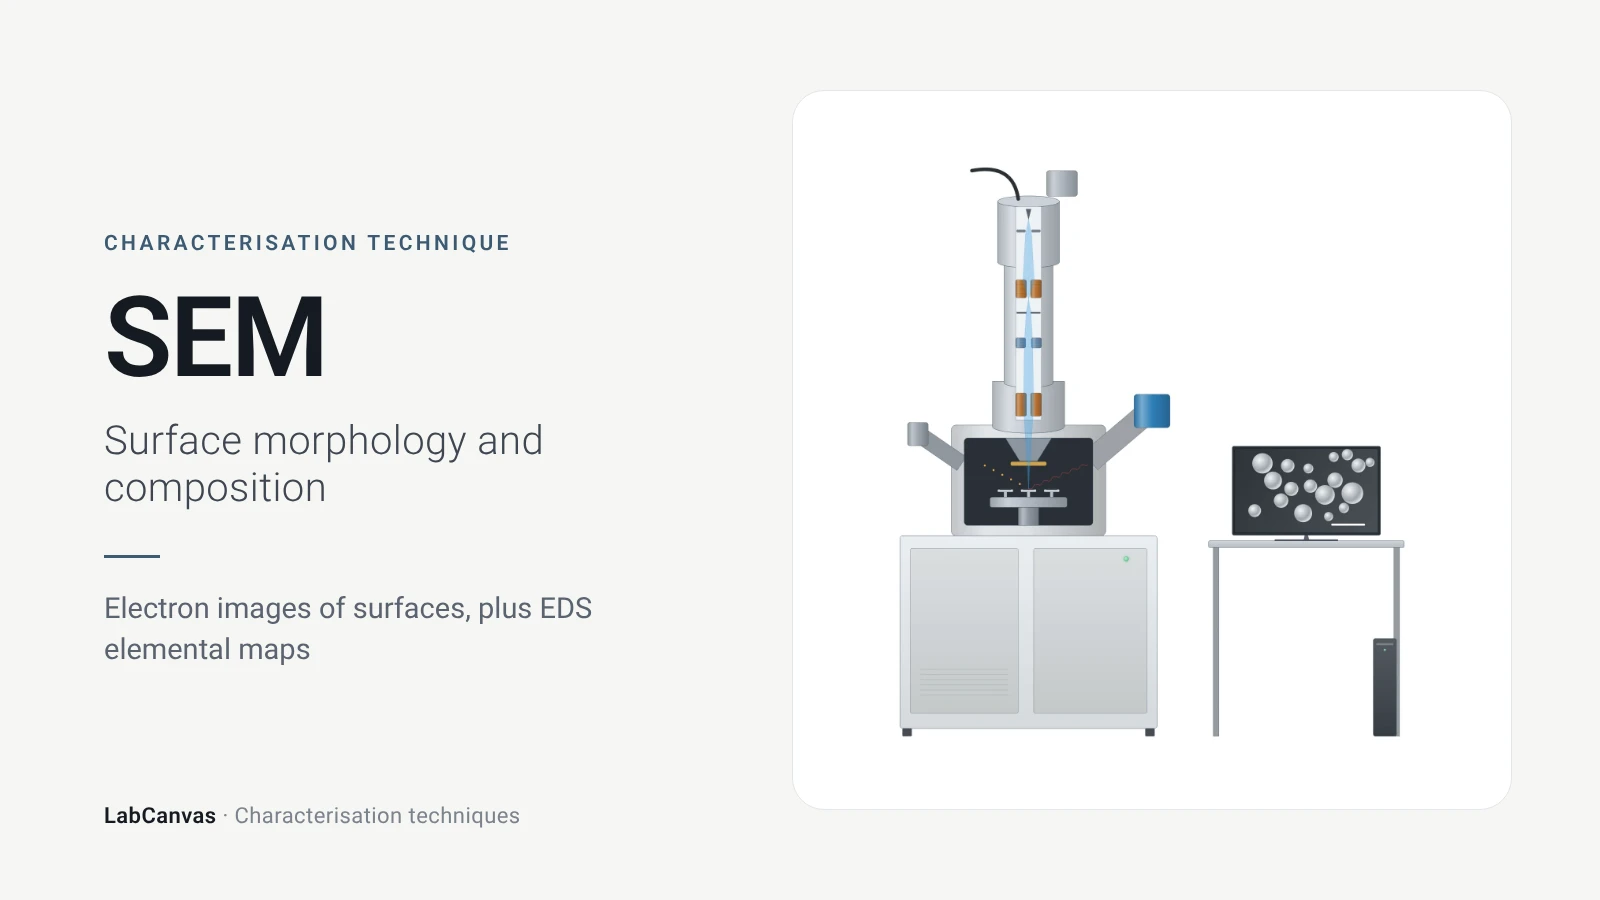
Scanning electron microscopy (SEM)
How SEM works: secondary vs backscattered electron images, EDS/EDX elemental analysis, resolution, sample coating, low-vacuum mode and common mistakes.
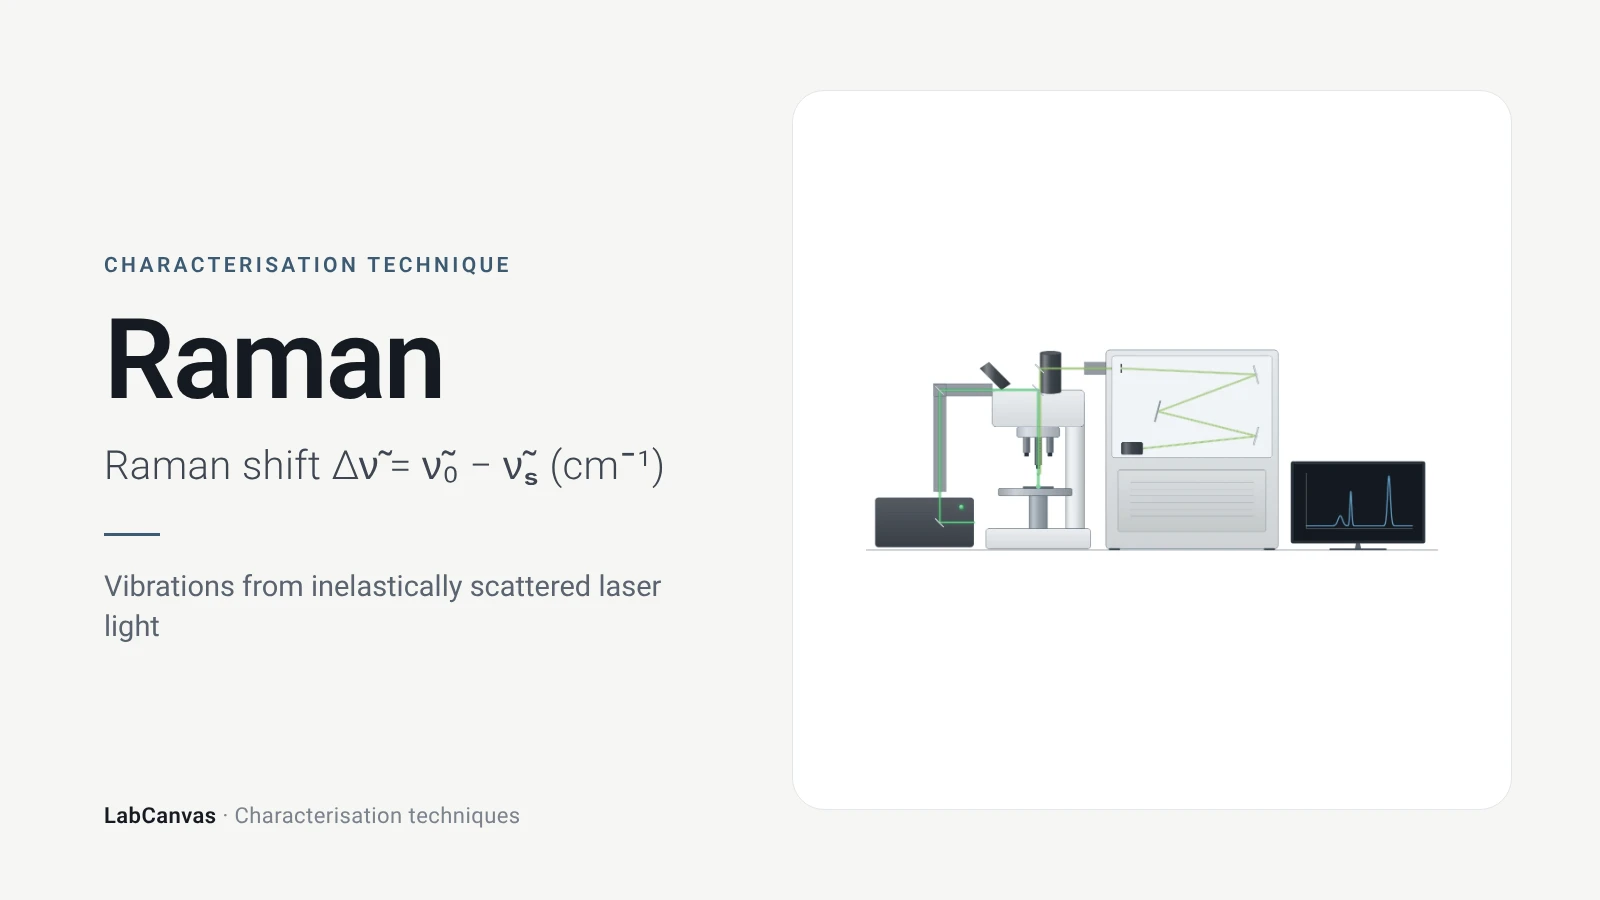
Raman spectroscopy
Raman spectroscopy explained: inelastic laser scattering, Raman shift, Stokes lines, IR complementarity, graphene D, G and 2D bands, lasers, fluorescence.
More on LabCanvas
- All characterisation techniques: XRD, XPS, BET, SEM, TEM, NMR, FTIR, Raman and more, explained with cited sources
- Graphical abstract sizes and templates: ACS, Wiley, Angewandte, RSC, Elsevier and Cell Press, with templates at the right size
- XRD Scherrer crystallite size calculator: Free tool
- Materials explained: MOFs, COFs, 2D materials, perovskites, batteries and zeolites, with cited facts
- Journal figure size guide: Column widths and resolutions for 38 journals
Frequently asked questions
What is XRD used for?
XRD identifies crystalline phases and checks their purity, and measures lattice parameters, crystallite size, strain and defects. Because the unit cell sets where the peaks fall, the pattern works as a fingerprint of a crystalline material (Abid et al. 2023).
What is Bragg’s law?
Bragg’s law, nλ = 2d sin θ, links the X-ray wavelength λ and the diffraction angle θ to the spacing d between lattice planes; n is the order of diffraction, and in practice only first-order reflections are used (Wang et al. 2026).
How do you read an XRD pattern?
Peak positions give d-spacings and identify the phase when compared with reference patterns; peak widths give crystallite size and strain; peak intensities depend on the crystal structure and are analysed by Rietveld refinement. Shifted peaks can indicate strain, defects or chemical changes (Abid et al. 2023; Wang et al. 2026).
What is the Scherrer equation?
The Scherrer equation, D = Kλ / (β cos θ), estimates the mean crystallite size D from the peak width β (full width at half maximum, in radians) at Bragg angle θ, with a shape factor K of about 0.89–0.94. It is meant for crystallites below about 100 nm (Abid et al. 2023).
Is XRD crystallite size the same as particle size?
No. Scherrer gives the size of coherently diffracting domains; a particle can contain several crystallites, and the shape factor is uncertain for polydisperse samples, so XRD sizes and microscopy sizes often differ (Jeong et al. 2008).
What is Rietveld refinement?
A whole-pattern fitting method in which structural, instrumental and sample parameters are optimised together by minimising the difference between the calculated and measured powder patterns (Wang et al. 2026). It yields lattice parameters, phase fractions and atomic parameters.
Powder XRD vs single-crystal XRD: what is the difference?
Single-crystal XRD measures one crystal larger than about 100 μm and solves the full atomic structure; powder XRD measures a fine powder of many crystallites and gives phase identity, lattice parameters and size, averaged over the sample (Abid et al. 2023).
XRD vs XPS: what is the difference?
XRD probes the long-range crystal structure of the bulk, averaged over all crystallites in the beam (Abid et al. 2023). XPS measures the elements and chemical states in only the top few nanometres of the surface, about 2–10 nm (Baio et al. 2020).
References
- Z. Wang, G. Li, J. Zhang, Y. Wang, R. Sun, J. Lin. Energy-dispersive X-ray diffraction: principles, instrumentation and emerging applications. Materials 2026, 19, 697. doi:10.3390/ma19040697
- H. R. Abid, M. R. Azhar, S. Iglauer, Z. H. Rada, A. Al-Yaseri, A. Keshavarz. Physiochemical characterization of metal organic framework materials: a mini review. Heliyon 2023, 10, e23840. doi:10.1016/j.heliyon.2023.e23840
- J. P. Cline, M. H. Mendenhall, D. Black, D. Windover, A. Henins. The optics and alignment of the divergent beam laboratory X-ray powder diffractometer and its calibration using NIST Standard Reference Materials. J. Res. Natl. Inst. Stand. Technol. 2015, 120, 173–222. doi:10.6028/jres.120.013
- H. Y. Jeong, J. H. Lee, K. F. Hayes. Characterization of synthetic nanocrystalline mackinawite: crystal structure, particle size, and specific surface area. Geochim. Cosmochim. Acta 2008, 72, 493–505. doi:10.1016/j.gca.2007.11.008
- Y. M. Shulga et al.. The concentration of C(sp³) atoms and properties of an activated carbon with over 3000 m²/g BET surface area. Nanomaterials 2021, 11, 1324. doi:10.3390/nano11051324
- J. E. Baio, D. J. Graham, D. G. Castner. Surface analysis tools for characterizing biological materials. Chem. Soc. Rev. 2020, 49, 3278–3296. doi:10.1039/d0cs00181c
Draw X-ray diffraction (XRD) figures for your paper
LabCanvas is a browser workspace for scientific figures: instruments with their beam and light paths, editable data plots, crystal structures, graphs and graphical abstracts at journal sizes.
Draw X-ray diffraction (XRD) in LabCanvas