TikZ colors: names, mixing, fill, shading and patterns
Quick answer
\draw[red], \fill[blue!30] (30% blue, 70% white) or red!50!blue (half red, half blue). draw= sets the line colour, fill= the inside and text= the text of a node; \filldraw[fill=yellow, draw=orange] does both. Define your own with \definecolor{brand}{HTML}{1F77B4}, and load \usepackage[dvipsnames]{xcolor} for 68 more names such as ForestGreen.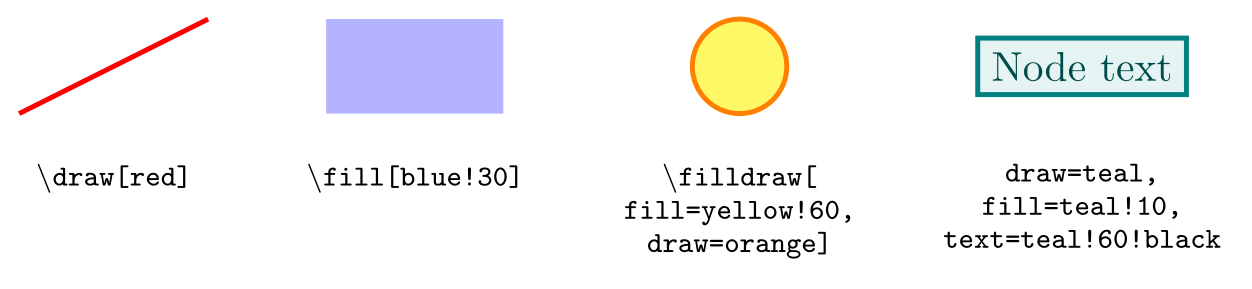
\usepackage{tikz}\begin{tikzpicture}[code/.style={font=\ttfamily\scriptsize, align=center, anchor=north}]
\draw[red, very thick] (0,0) -- (1.6,0.8);
\node[code] at (0.8,-0.3) {\textbackslash draw[red]};
\fill[blue!30] (2.6,0) rectangle (4.1,0.8);
\node[code] at (3.35,-0.3) {\textbackslash fill[blue!30]};
\filldraw[fill=yellow!60, draw=orange, very thick] (6.1,0.4) circle[radius=0.4];
\node[code] at (6.1,-0.3) {\textbackslash filldraw[\\fill=yellow!60,\\draw=orange]};
\node[draw=teal, fill=teal!10, text=teal!60!black, very thick] at (9,0.4) {Node text};
\node[code] at (9,-0.3) {draw=teal,\\fill=teal!10,\\text=teal!60!black};
\end{tikzpicture}Full document
\documentclass[border=4pt]{standalone}
\usepackage{tikz}
\begin{document}
\begin{tikzpicture}[code/.style={font=\ttfamily\scriptsize, align=center, anchor=north}]
  \draw[red, very thick] (0,0) -- (1.6,0.8);
  \node[code] at (0.8,-0.3) {\textbackslash draw[red]};

  \fill[blue!30] (2.6,0) rectangle (4.1,0.8);
  \node[code] at (3.35,-0.3) {\textbackslash fill[blue!30]};

  \filldraw[fill=yellow!60, draw=orange, very thick] (6.1,0.4) circle[radius=0.4];
  \node[code] at (6.1,-0.3) {\textbackslash filldraw[\\fill=yellow!60,\\draw=orange]};

  \node[draw=teal, fill=teal!10, text=teal!60!black, very thick] at (9,0.4) {Node text};
  \node[code] at (9,-0.3) {draw=teal,\\fill=teal!10,\\text=teal!60!black};
\end{tikzpicture}
\end{document}Contents
Colour options: color, draw, fill and text
Any option TikZ does not recognise is tried as a colour name, so \draw[red] is short for \draw[color=red]. color sets everything at once: the line, the fill (for \fill and \filldraw) and the text of nodes. The specific keys override it for one part:
| Key | Colours |
|---|---|
color=red or just red | Lines, fills without their own colour, and node text |
draw=red | The line (and switches drawing on) |
fill=red | The inside (and switches filling on) |
text=red | Node text only |
pattern color=red | Form-only patterns (see below) |
draw=none, fill=none | Turns the line or fill off again |
Order matters: color overrules a draw or fill colour given before it, so write [red, fill=yellow], not [fill=yellow, red]. The magic name . means the current colour, as in draw=.!50!black.
The 19 colours that always work
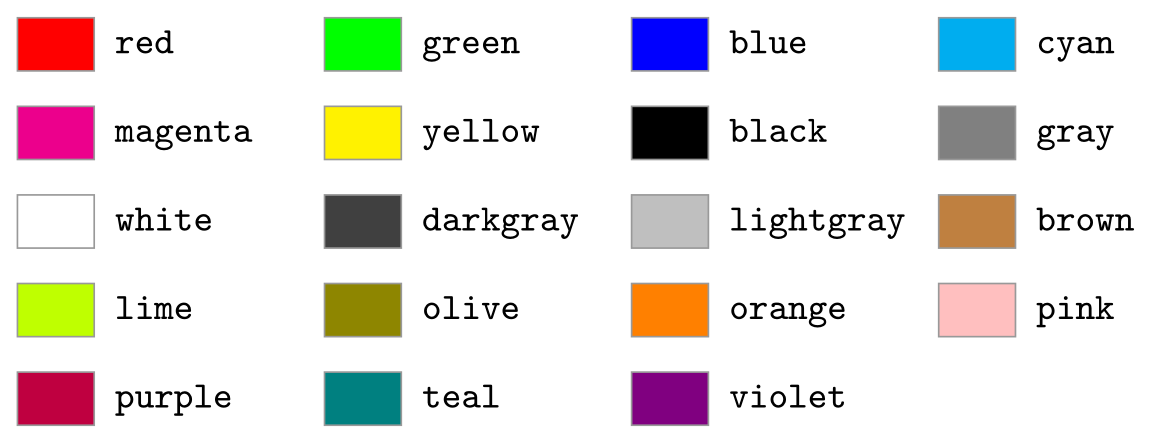
Without any option, xcolor defines these base colours: red, green, blue, cyan, magenta, yellow, black, gray, white, darkgray, lightgray, brown, lime, olive, orange, pink, purple, teal and violet. They are lowercase; Red or Gray with a capital letter is a different colour that only exists with the dvipsnames option. Pure green is very bright on screen, which is why so much TikZ code writes green!60!black.
\usepackage{tikz}\begin{tikzpicture}[x=2.6cm, y=-0.75cm]
\foreach \c [count=\i from 0] in {red, green, blue, cyan, magenta, yellow, black,
gray, white, darkgray, lightgray, brown, lime, olive, orange, pink, purple, teal, violet} {
\pgfmathtruncatemacro\col{mod(\i,4)}
\pgfmathtruncatemacro\row{\i/4}
\filldraw[fill=\c, draw=black!40] (\col,\row) rectangle ++(0.25,0.6);
\node[anchor=mid west, font=\ttfamily\small] at (\col+0.27,\row+0.3) {\c};
}
\end{tikzpicture}Full document
\documentclass[border=4pt]{standalone}
\usepackage{tikz}
\begin{document}
\begin{tikzpicture}[x=2.6cm, y=-0.75cm]
  \foreach \c [count=\i from 0] in {red, green, blue, cyan, magenta, yellow, black,
      gray, white, darkgray, lightgray, brown, lime, olive, orange, pink, purple, teal, violet} {
    \pgfmathtruncatemacro\col{mod(\i,4)}
    \pgfmathtruncatemacro\row{\i/4}
    \filldraw[fill=\c, draw=black!40] (\col,\row) rectangle ++(0.25,0.6);
    \node[anchor=mid west, font=\ttfamily\small] at (\col+0.27,\row+0.3) {\c};
  }
\end{tikzpicture}
\end{document}More colour names: dvipsnames, svgnames and x11names
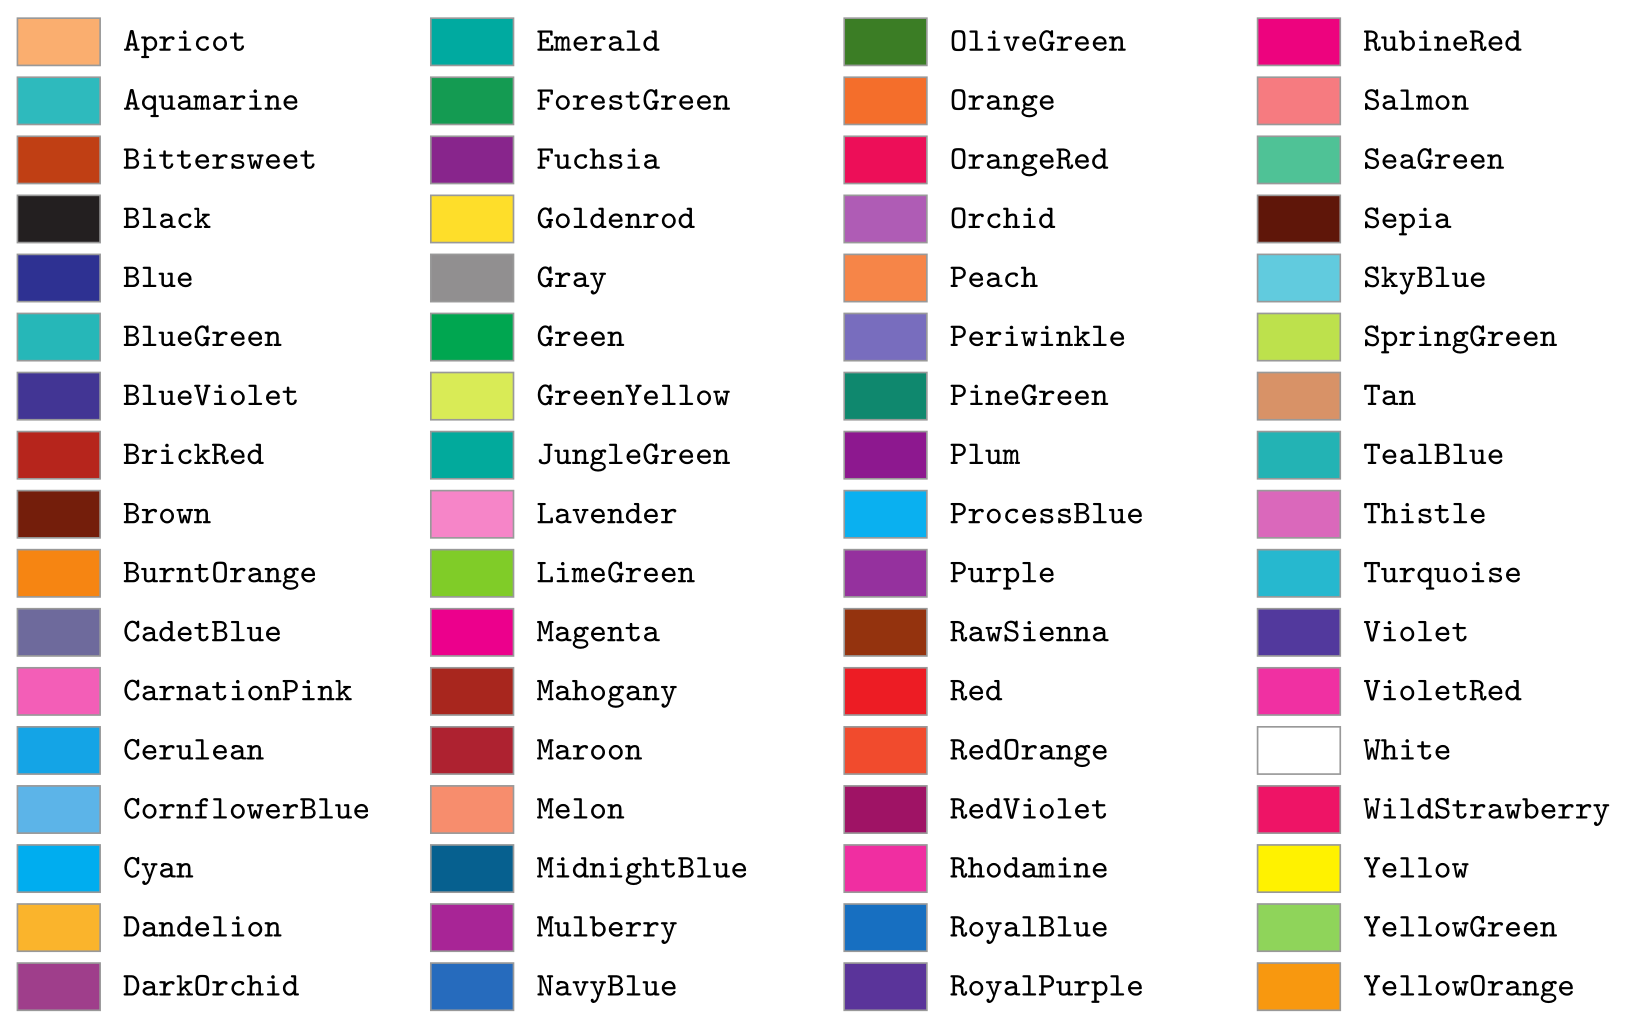
xcolor has three larger sets, switched on by package options: dvipsnames (68 colours in cmyk, the chart below), svgnames (151 colours from the SVG standard, such as SteelBlue, Tomato and DarkSlateGray) and x11names (317 variants such as DodgerBlue3). All of them are written in CamelCase. When svgnames and dvipsnames define the same name, the svgnames colour wins regardless of the order of the options; xcolor’s manual (§2.15.1) shows how to keep both.
Where to put the option: \usepackage[dvipsnames]{xcolor}. TikZ already loads xcolor, and with xcolor 3.00 (November 2023, in TeX Live 2024 and later) a second \usepackage with new options is accepted, which is how the chart below was compiled: tikz first, then xcolor with the option. With an older xcolor, LaTeX stops with an option clash, so if your documents must work everywhere, put the xcolor line before \usepackage{tikz}, or give dvipsnames as a class option: \documentclass[dvipsnames]{article}.
\usepackage{tikz} \usepackage[dvipsnames]{xcolor}\begin{tikzpicture}[x=3.5cm, y=-0.5cm]
\foreach \c [count=\i from 0] in {Apricot, Aquamarine, Bittersweet, Black, Blue,
BlueGreen, BlueViolet, BrickRed, Brown, BurntOrange, CadetBlue, CarnationPink,
Cerulean, CornflowerBlue, Cyan, Dandelion, DarkOrchid, Emerald, ForestGreen,
Fuchsia, Goldenrod, Gray, Green, GreenYellow, JungleGreen, Lavender, LimeGreen,
Magenta, Mahogany, Maroon, Melon, MidnightBlue, Mulberry, NavyBlue, OliveGreen,
Orange, OrangeRed, Orchid, Peach, Periwinkle, PineGreen, Plum, ProcessBlue,
Purple, RawSienna, Red, RedOrange, RedViolet, Rhodamine, RoyalBlue, RoyalPurple,
RubineRed, Salmon, SeaGreen, Sepia, SkyBlue, SpringGreen, Tan, TealBlue, Thistle,
Turquoise, Violet, VioletRed, White, WildStrawberry, Yellow, YellowGreen,
YellowOrange} {
\pgfmathtruncatemacro\col{\i/17}
\pgfmathtruncatemacro\row{mod(\i,17)}
\filldraw[fill=\c, draw=black!40] (\col,\row) rectangle ++(0.2,0.8);
\node[anchor=mid west, font=\ttfamily\footnotesize] at (\col+0.22,\row+0.4) {\c};
}
\end{tikzpicture}Full document
\documentclass[border=4pt]{standalone}
\usepackage{tikz}
\usepackage[dvipsnames]{xcolor}
\begin{document}
\begin{tikzpicture}[x=3.5cm, y=-0.5cm]
  \foreach \c [count=\i from 0] in {Apricot, Aquamarine, Bittersweet, Black, Blue,
      BlueGreen, BlueViolet, BrickRed, Brown, BurntOrange, CadetBlue, CarnationPink,
      Cerulean, CornflowerBlue, Cyan, Dandelion, DarkOrchid, Emerald, ForestGreen,
      Fuchsia, Goldenrod, Gray, Green, GreenYellow, JungleGreen, Lavender, LimeGreen,
      Magenta, Mahogany, Maroon, Melon, MidnightBlue, Mulberry, NavyBlue, OliveGreen,
      Orange, OrangeRed, Orchid, Peach, Periwinkle, PineGreen, Plum, ProcessBlue,
      Purple, RawSienna, Red, RedOrange, RedViolet, Rhodamine, RoyalBlue, RoyalPurple,
      RubineRed, Salmon, SeaGreen, Sepia, SkyBlue, SpringGreen, Tan, TealBlue, Thistle,
      Turquoise, Violet, VioletRed, White, WildStrawberry, Yellow, YellowGreen,
      YellowOrange} {
    \pgfmathtruncatemacro\col{\i/17}
    \pgfmathtruncatemacro\row{mod(\i,17)}
    \filldraw[fill=\c, draw=black!40] (\col,\row) rectangle ++(0.2,0.8);
    \node[anchor=mid west, font=\ttfamily\footnotesize] at (\col+0.22,\row+0.4) {\c};
  }
\end{tikzpicture}
\end{document}Mixing colours: red!30, blue!50!black and complements
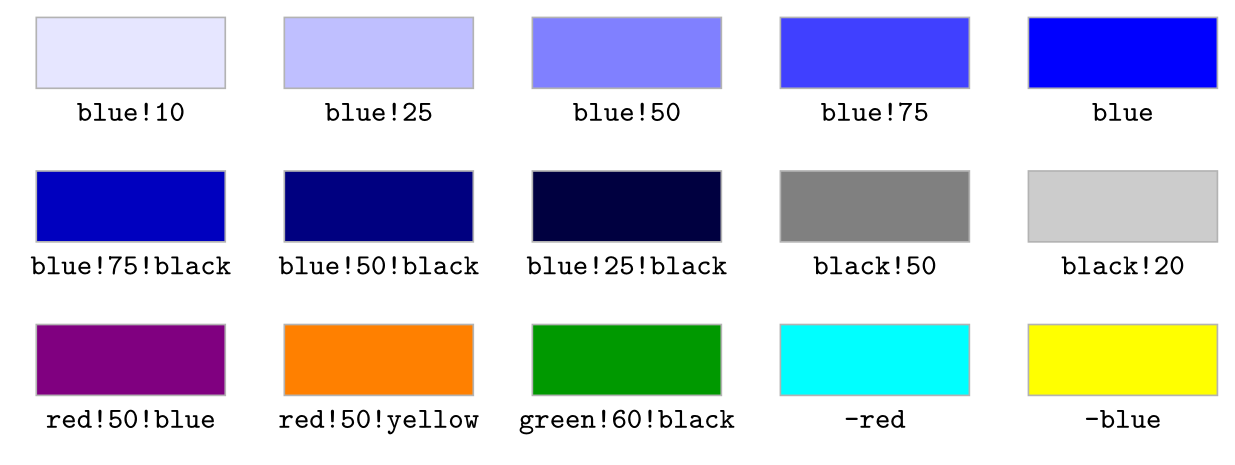
xcolor’s mixing syntax works anywhere a colour name does:
blue!30is 30% blue and 70% white, a tint.blue!0is white,blue!100is blue.blue!50!blackis 50% blue and 50% black, a shade;red!50!bluemixes two colours,red!25!blueis mostly blue.- Mixes chain from left to right:
red!50!green!20!blueis 20% of the red-green mix and 80% blue. - A leading minus gives the complement:
-redis cyan,-blueyellow.
Percentages must lie between 0 and 100: red!150 stops with Argument `-0.5' not in range [0,1]. For weighted mixes of more than two colours there is the extended syntax rgb:red,1;blue,2 (one part red, two parts blue); because of its commas it has to be wrapped in braces after a key, fill={rgb:red,1;blue,2}.
\usepackage{tikz}\begin{tikzpicture}
\foreach \row/\list in {
0/{blue!10, blue!25, blue!50, blue!75, blue},
1/{blue!75!black, blue!50!black, blue!25!black, black!50, black!20},
2/{red!50!blue, red!50!yellow, green!60!black, -red, -blue}} {
\foreach \c [count=\i from 0] in \list {
\filldraw[fill=\c, draw=black!30] (2.1*\i,-1.3*\row) rectangle ++(1.6,0.6);
\node[font=\ttfamily\scriptsize, below] at (2.1*\i+0.8,-1.3*\row) {\c};
}
}
\end{tikzpicture}Full document
\documentclass[border=4pt]{standalone}
\usepackage{tikz}
\begin{document}
\begin{tikzpicture}
  \foreach \row/\list in {
      0/{blue!10, blue!25, blue!50, blue!75, blue},
      1/{blue!75!black, blue!50!black, blue!25!black, black!50, black!20},
      2/{red!50!blue, red!50!yellow, green!60!black, -red, -blue}} {
    \foreach \c [count=\i from 0] in \list {
      \filldraw[fill=\c, draw=black!30] (2.1*\i,-1.3*\row) rectangle ++(1.6,0.6);
      \node[font=\ttfamily\scriptsize, below] at (2.1*\i+0.8,-1.3*\row) {\c};
    }
  }
\end{tikzpicture}
\end{document}Define your own colours: \definecolor and \colorlet
\definecolor{⟨name⟩}{⟨model⟩}{⟨values⟩} creates a colour, best in the preamble so every picture can use it. The model says how to read the values:
| Model | Values | Example |
|---|---|---|
HTML | six hex digits, no # | {HTML}{1F77B4} |
RGB | 0–255 | {RGB}{255,127,14} |
rgb | 0–1 | {rgb}{0.17,0.63,0.17} |
cmyk | 0–1, for print | {cmyk}{0,0.85,0.7,0.15} |
gray | 0 (black) – 1 (white) | {gray}{0.6} |
The HTML model accepts upper- or lowercase hex digits, but a # in front, as copied from a web colour picker, breaks with Illegal parameter number in definition of \@@clr. \colorlet{brandlight}{brand!20} names the result of a mixing expression, which keeps colour choices in one place.
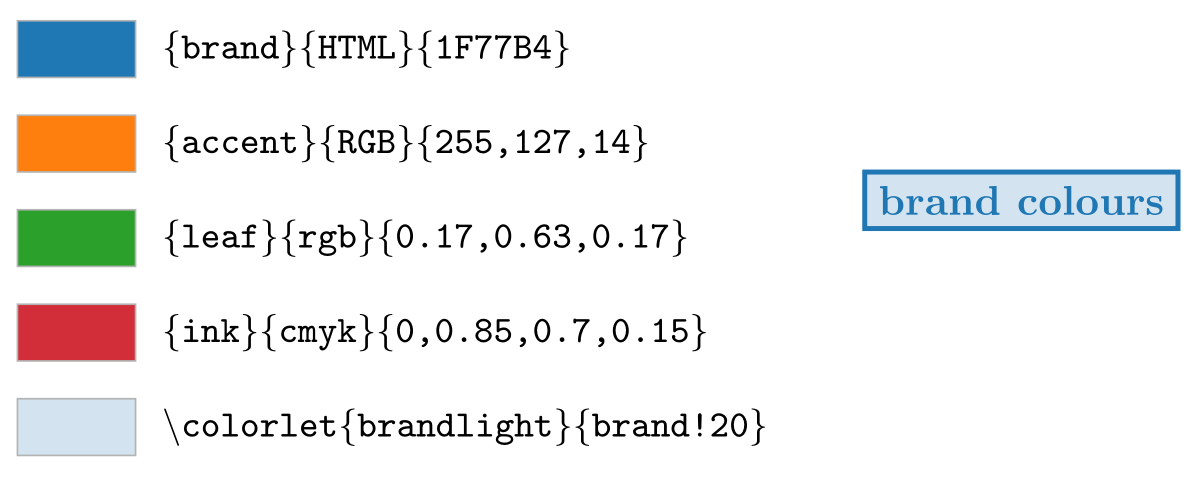
\usepackage{tikz} \definecolor{brand}{HTML}{1F77B4} \definecolor{accent}{RGB}{255,127,14} \definecolor{leaf}{rgb}{0.17,0.63,0.17} \definecolor{ink}{cmyk}{0,0.85,0.7,0.15} \colorlet{brandlight}{brand!20}\begin{tikzpicture}[y=-0.8cm, code/.style={anchor=west, font=\ttfamily\small}]
\foreach \c/\spec [count=\i from 0] in {
brand/{\{brand\}\{HTML\}\{1F77B4\}},
accent/{\{accent\}\{RGB\}\{255,127,14\}},
leaf/{\{leaf\}\{rgb\}\{0.17,0.63,0.17\}},
ink/{\{ink\}\{cmyk\}\{0,0.85,0.7,0.15\}},
brandlight/{\textbackslash colorlet\{brandlight\}\{brand!20\}}} {
\filldraw[fill=\c, draw=black!30] (0,\i) rectangle ++(1,0.6);
\node[code] at (1.1,\i+0.3) {\spec};
}
\node[draw=brand, very thick, fill=brandlight, text=brand, font=\bfseries]
at (8.5,1.9) {brand colours};
\end{tikzpicture}Full document
\documentclass[border=4pt]{standalone}
\usepackage{tikz}
\definecolor{brand}{HTML}{1F77B4}
\definecolor{accent}{RGB}{255,127,14}
\definecolor{leaf}{rgb}{0.17,0.63,0.17}
\definecolor{ink}{cmyk}{0,0.85,0.7,0.15}
\colorlet{brandlight}{brand!20}
\begin{document}
\begin{tikzpicture}[y=-0.8cm, code/.style={anchor=west, font=\ttfamily\small}]
  \foreach \c/\spec [count=\i from 0] in {
      brand/{\{brand\}\{HTML\}\{1F77B4\}},
      accent/{\{accent\}\{RGB\}\{255,127,14\}},
      leaf/{\{leaf\}\{rgb\}\{0.17,0.63,0.17\}},
      ink/{\{ink\}\{cmyk\}\{0,0.85,0.7,0.15\}},
      brandlight/{\textbackslash colorlet\{brandlight\}\{brand!20\}}} {
    \filldraw[fill=\c, draw=black!30] (0,\i) rectangle ++(1,0.6);
    \node[code] at (1.1,\i+0.3) {\spec};
  }
  \node[draw=brand, very thick, fill=brandlight, text=brand, font=\bfseries]
    at (8.5,1.9) {brand colours};
\end{tikzpicture}
\end{document}Fill and filldraw
\fill is \path[fill], \draw is \path[draw] and \filldraw is \path[fill, draw]: TikZ fills first, then draws the line on top. A filldrawn shape is therefore slightly larger than the same shape filled, by half the line width all round, as the first two squares show. Filling closes an open path by itself, but end outlines with -- cycle anyway so that the last corner of the line is joined properly.
When a path has several closed parts, the default nonzero rule decides what is inside from the direction of each part; even odd rule treats every second boundary as a hole, which makes a ring from two circles. To colour the area under a curve, close the curve down to the axis and fill it, then draw the curve again on top; for the area between two plotted curves, the pgfplots fillbetween library does the bookkeeping.
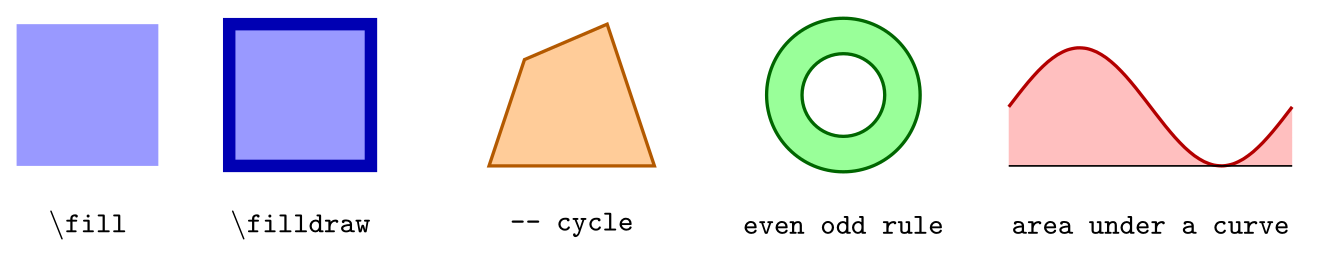
\usepackage{tikz}\begin{tikzpicture}[code/.style={font=\ttfamily\scriptsize, align=center}]
% fill vs filldraw: the stroke adds half the line width outside
\fill[blue!40] (0,0) rectangle (1.2,1.2);
\filldraw[fill=blue!40, draw=blue!70!black, line width=3pt] (1.8,0) rectangle (3,1.2);
\node[code] at (0.6,-0.5) {\textbackslash fill};
\node[code] at (2.4,-0.5) {\textbackslash filldraw};
% a closed outline made of lines; fill closes the path itself
\filldraw[fill=orange!40, draw=orange!70!black, thick]
(4,0) -- (5.4,0) -- (5.0,1.2) -- (4.3,0.9) -- cycle;
\node[code] at (4.7,-0.5) {-- cycle};
% even odd rule: the inner circle becomes a hole
\filldraw[fill=green!40, draw=green!40!black, thick, even odd rule]
(7,0.6) circle[radius=0.65] (7,0.6) circle[radius=0.35];
\node[code] at (7,-0.5) {even odd rule};
% the area under a curve: close it down to the axis
\fill[red!25] (8.4,0) -- plot[domain=0:2.4, smooth, samples=30]
({8.4+\x}, {0.5+0.5*sin(150*\x)}) -- (10.8,0) -- cycle;
\draw[red!70!black, thick] plot[domain=0:2.4, smooth, samples=30]
({8.4+\x}, {0.5+0.5*sin(150*\x)});
\draw (8.4,0) -- (10.8,0);
\node[code] at (9.6,-0.5) {area under a curve};
\end{tikzpicture}Full document
\documentclass[border=4pt]{standalone}
\usepackage{tikz}
\begin{document}
\begin{tikzpicture}[code/.style={font=\ttfamily\scriptsize, align=center}]
  % fill vs filldraw: the stroke adds half the line width outside
  \fill[blue!40] (0,0) rectangle (1.2,1.2);
  \filldraw[fill=blue!40, draw=blue!70!black, line width=3pt] (1.8,0) rectangle (3,1.2);
  \node[code] at (0.6,-0.5) {\textbackslash fill};
  \node[code] at (2.4,-0.5) {\textbackslash filldraw};

  % a closed outline made of lines; fill closes the path itself
  \filldraw[fill=orange!40, draw=orange!70!black, thick]
    (4,0) -- (5.4,0) -- (5.0,1.2) -- (4.3,0.9) -- cycle;
  \node[code] at (4.7,-0.5) {-- cycle};

  % even odd rule: the inner circle becomes a hole
  \filldraw[fill=green!40, draw=green!40!black, thick, even odd rule]
    (7,0.6) circle[radius=0.65] (7,0.6) circle[radius=0.35];
  \node[code] at (7,-0.5) {even odd rule};

  % the area under a curve: close it down to the axis
  \fill[red!25] (8.4,0) -- plot[domain=0:2.4, smooth, samples=30]
    ({8.4+\x}, {0.5+0.5*sin(150*\x)}) -- (10.8,0) -- cycle;
  \draw[red!70!black, thick] plot[domain=0:2.4, smooth, samples=30]
    ({8.4+\x}, {0.5+0.5*sin(150*\x)});
  \draw (8.4,0) -- (10.8,0);
  \node[code] at (9.6,-0.5) {area under a curve};
\end{tikzpicture}
\end{document}Transparency: opacity, fill opacity, draw opacity and text opacity
fill opacity=0.5 makes fills half transparent, so overlapping areas mix as in a Venn diagram. draw opacity does the same for lines, text opacity for node text, and opacity sets all of them. One trap: in a node, fill opacity also fades the text, so add text opacity=1 to keep it crisp. Values run from 0 (invisible) to 1. There are also named styles, which set opacity: transparent (0), ultra nearly transparent (0.05), very nearly transparent (0.1), nearly transparent (0.25), semitransparent (0.5), nearly opaque (0.75), very nearly opaque (0.9), ultra nearly opaque (0.95) and opaque (1); the manual lists them without their values, which are taken from tikz.code.tex.
With opacity on a filldrawn shape, the line and the fill are each transparent, so where the stroke overlaps the fill the colour is darker (first square). For a whole group to fade as one, put it in a scope with transparency group.
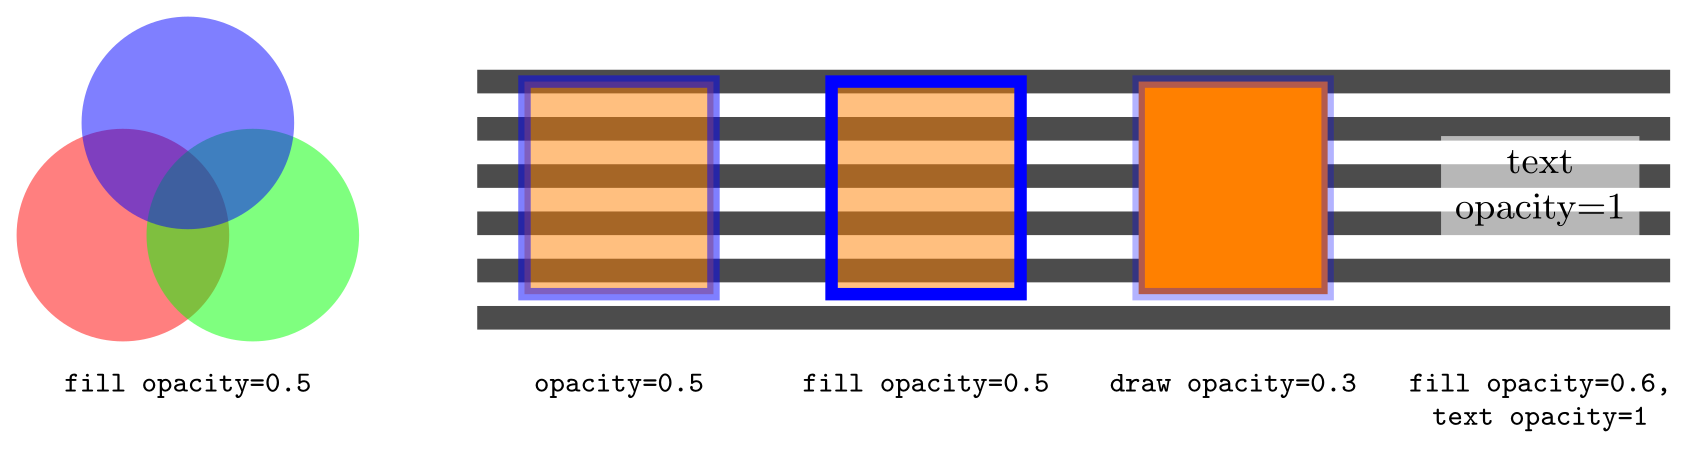
\usepackage{tikz}\begin{tikzpicture}[code/.style={font=\ttfamily\scriptsize, align=center, anchor=north}]
% fill opacity lets overlapping areas mix
\begin{scope}[fill opacity=0.5]
\fill[red] (0,0) circle[radius=0.9];
\fill[green] (1.1,0) circle[radius=0.9];
\fill[blue] (0.55,0.95) circle[radius=0.9];
\end{scope}
\node[code] at (0.55,-1.05) {fill opacity=0.5};
% what each key fades, over a striped background
\foreach \y in {-0.8,-0.4,...,1.6} \fill[black!70] (3,\y) rectangle (13.1,\y+0.2);
\filldraw[fill=orange, draw=blue, line width=3pt, opacity=0.5] (3.4,-0.5) rectangle ++(1.6,1.8);
\node[code] at (4.2,-1.05) {opacity=0.5};
\filldraw[fill=orange, draw=blue, line width=3pt, fill opacity=0.5] (6.0,-0.5) rectangle ++(1.6,1.8);
\node[code] at (6.8,-1.05) {fill opacity=0.5};
\filldraw[fill=orange, draw=blue, line width=3pt, draw opacity=0.3] (8.6,-0.5) rectangle ++(1.6,1.8);
\node[code] at (9.4,-1.05) {draw opacity=0.3};
\node[fill=white, fill opacity=0.6, text opacity=1, align=center, font=\small]
at (12.0,0.4) {text\\opacity=1};
\node[code] at (12.0,-1.05) {fill opacity=0.6,\\text opacity=1};
\end{tikzpicture}Full document
\documentclass[border=4pt]{standalone}
\usepackage{tikz}
\begin{document}
\begin{tikzpicture}[code/.style={font=\ttfamily\scriptsize, align=center, anchor=north}]
  % fill opacity lets overlapping areas mix
  \begin{scope}[fill opacity=0.5]
    \fill[red]   (0,0)   circle[radius=0.9];
    \fill[green] (1.1,0) circle[radius=0.9];
    \fill[blue]  (0.55,0.95) circle[radius=0.9];
  \end{scope}
  \node[code] at (0.55,-1.05) {fill opacity=0.5};

  % what each key fades, over a striped background
  \foreach \y in {-0.8,-0.4,...,1.6} \fill[black!70] (3,\y) rectangle (13.1,\y+0.2);
  \filldraw[fill=orange, draw=blue, line width=3pt, opacity=0.5] (3.4,-0.5) rectangle ++(1.6,1.8);
  \node[code] at (4.2,-1.05) {opacity=0.5};
  \filldraw[fill=orange, draw=blue, line width=3pt, fill opacity=0.5] (6.0,-0.5) rectangle ++(1.6,1.8);
  \node[code] at (6.8,-1.05) {fill opacity=0.5};
  \filldraw[fill=orange, draw=blue, line width=3pt, draw opacity=0.3] (8.6,-0.5) rectangle ++(1.6,1.8);
  \node[code] at (9.4,-1.05) {draw opacity=0.3};
  \node[fill=white, fill opacity=0.6, text opacity=1, align=center, font=\small]
    at (12.0,0.4) {text\\opacity=1};
  \node[code] at (12.0,-1.05) {fill opacity=0.6,\\text opacity=1};
\end{tikzpicture}
\end{document}Shading and gradients
A shading is a fill that changes colour. The colour keys select the shading and switch it on, so \draw[left color=red, right color=blue] or \shade[…] is all you need, with no library:
left color/right color,top color/bottom colorandmiddle colormake anaxisshading.top colorandbottom colorresetmiddle colorto the average of the two, so givemiddle colorlast.inner color/outer colormake aradialshading from the centre outwards.ball colormakes a sphere, mixing in white at the highlight and black at the edge.shading angle(initially 0) rotates the shading, not the path; set it aftertop color, which resets it.
The shadings library adds bilinear interpolation with a colour at each corner (upper left, upper right, lower left, lower right), color wheel and Mandelbrot set. Shadings also work on nodes: \node[draw, top color=white, bottom color=blue!20] {…};.
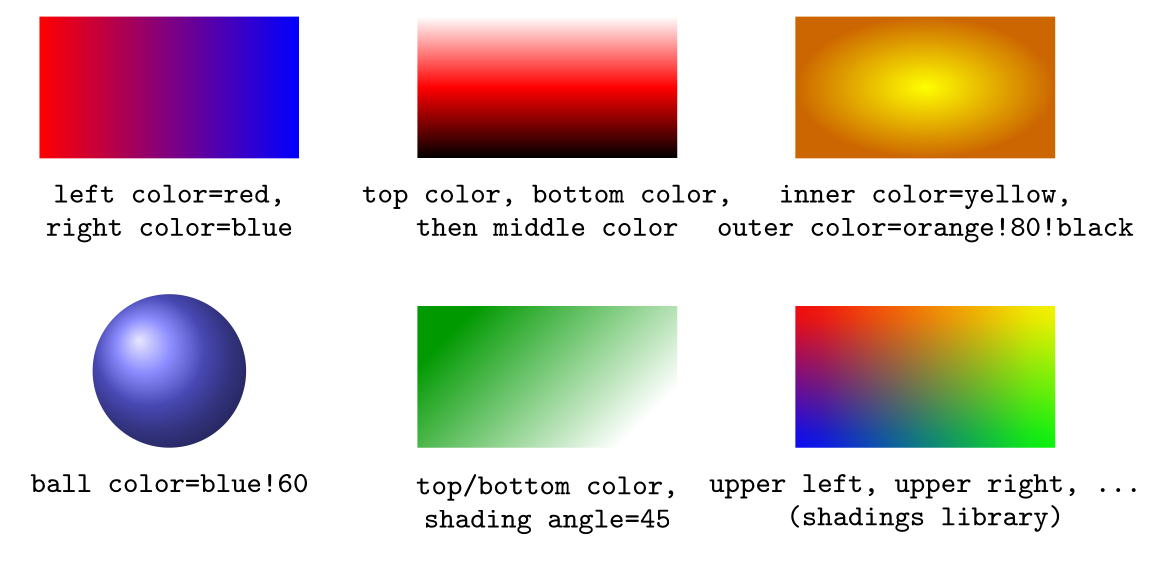
\usepackage{tikz} \usetikzlibrary{shadings}\begin{tikzpicture}[code/.style={font=\ttfamily\scriptsize, align=center, anchor=north}]
\shade[left color=red, right color=blue] (0,0) rectangle (2.2,1.2);
\node[code] at (1.1,-0.1) {left color=red,\\right color=blue};
\shade[top color=white, bottom color=black, middle color=red] (3.2,0) rectangle (5.4,1.2);
\node[code] at (4.3,-0.1) {top color, bottom color,\\then middle color};
\shade[inner color=yellow, outer color=orange!80!black] (6.4,0) rectangle (8.6,1.2);
\node[code] at (7.5,-0.1) {inner color=yellow,\\outer color=orange!80!black};
\shade[ball color=blue!60] (1.1,-1.8) circle[radius=0.65];
\node[code] at (1.1,-2.55) {ball color=blue!60};
\shade[top color=green!60!black, bottom color=white, shading angle=45]
(3.2,-2.45) rectangle (5.4,-1.25);
\node[code] at (4.3,-2.55) {top/bottom color,\\shading angle=45};
\shade[upper left=red, upper right=yellow, lower left=blue, lower right=green]
(6.4,-2.45) rectangle (8.6,-1.25);
\node[code] at (7.5,-2.55) {upper left, upper right, ...\\(shadings library)};
\end{tikzpicture}Full document
\documentclass[border=4pt]{standalone}
\usepackage{tikz}
\usetikzlibrary{shadings}
\begin{document}
\begin{tikzpicture}[code/.style={font=\ttfamily\scriptsize, align=center, anchor=north}]
  \shade[left color=red, right color=blue] (0,0) rectangle (2.2,1.2);
  \node[code] at (1.1,-0.1) {left color=red,\\right color=blue};
  \shade[top color=white, bottom color=black, middle color=red] (3.2,0) rectangle (5.4,1.2);
  \node[code] at (4.3,-0.1) {top color, bottom color,\\then middle color};
  \shade[inner color=yellow, outer color=orange!80!black] (6.4,0) rectangle (8.6,1.2);
  \node[code] at (7.5,-0.1) {inner color=yellow,\\outer color=orange!80!black};

  \shade[ball color=blue!60] (1.1,-1.8) circle[radius=0.65];
  \node[code] at (1.1,-2.55) {ball color=blue!60};
  \shade[top color=green!60!black, bottom color=white, shading angle=45]
    (3.2,-2.45) rectangle (5.4,-1.25);
  \node[code] at (4.3,-2.55) {top/bottom color,\\shading angle=45};
  \shade[upper left=red, upper right=yellow, lower left=blue, lower right=green]
    (6.4,-2.45) rectangle (8.6,-1.25);
  \node[code] at (7.5,-2.55) {upper left, upper right, ...\\(shadings library)};
\end{tikzpicture}
\end{document}Patterns: the patterns library
A pattern fills a path with a repeating tile. Load \usetikzlibrary{patterns} and use pattern=⟨name⟩ instead of a fill colour; pattern color colours the twelve form-only patterns below (black when not set). The library also has eight inherently coloured patterns, such as checkerboard light gray and horizontal lines dark blue, which ignore pattern color.
A pattern behaves like a fill colour: a later fill= replaces it. To put a pattern on a coloured background, fill in a preaction: \draw[preaction={fill=yellow!30}, pattern=north east lines]. The classic patterns cannot be resized or rotated; the manual suggests declaring a new pattern for that, which is what patterns.meta makes easy.
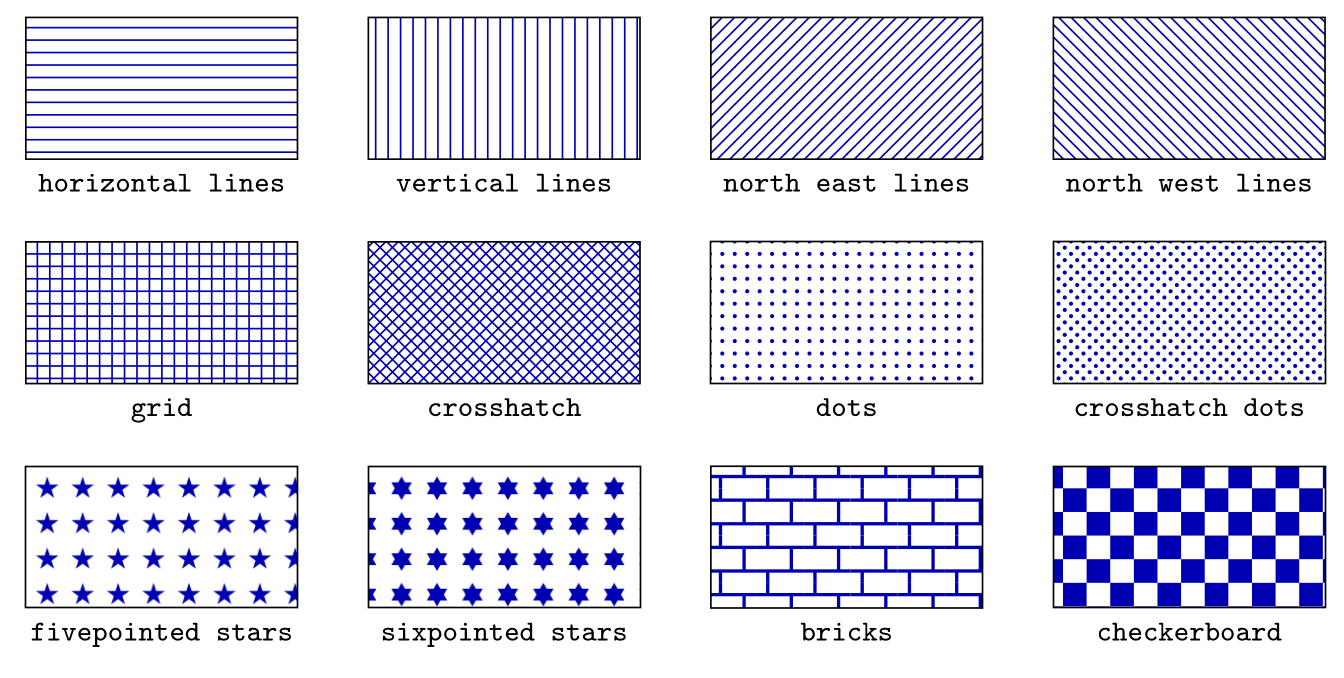
\usepackage{tikz} \usetikzlibrary{patterns}\begin{tikzpicture}
\foreach \p [count=\i from 0] in {horizontal lines, vertical lines, north east lines,
north west lines, grid, crosshatch, dots, crosshatch dots, fivepointed stars,
sixpointed stars, bricks, checkerboard} {
\pgfmathsetmacro\x{2.9*mod(\i,4)}
\pgfmathsetmacro\y{-1.9*floor(\i/4)}
\draw[pattern=\p, pattern color=blue!70!black] (\x,\y) rectangle ++(2.3,1.2);
\node[font=\ttfamily\scriptsize, below] at (\x+1.15,\y) {\p};
}
\end{tikzpicture}Full document
\documentclass[border=4pt]{standalone}
\usepackage{tikz}
\usetikzlibrary{patterns}
\begin{document}
\begin{tikzpicture}
  \foreach \p [count=\i from 0] in {horizontal lines, vertical lines, north east lines,
      north west lines, grid, crosshatch, dots, crosshatch dots, fivepointed stars,
      sixpointed stars, bricks, checkerboard} {
    \pgfmathsetmacro\x{2.9*mod(\i,4)}
    \pgfmathsetmacro\y{-1.9*floor(\i/4)}
    \draw[pattern=\p, pattern color=blue!70!black] (\x,\y) rectangle ++(2.3,1.2);
    \node[font=\ttfamily\scriptsize, below] at (\x+1.15,\y) {\p};
  }
\end{tikzpicture}
\end{document}Patterns with options: patterns.meta
\usetikzlibrary{patterns.meta} adds configurable patterns, written like arrow tips with options in brackets and braces around the whole value: pattern={Lines[angle=45, distance=4pt, line width=1pt]}. Lines replaces the four line patterns, Hatch replaces grid and crosshatch, Dots replaces dots and crosshatch dots, and Stars the star patterns. Their keys and initial values:
| Pattern | Keys (initial value) |
|---|---|
Lines, Hatch | distance (3pt), angle (0), xshift, yshift (0pt), line width (the current line width) |
Dots | distance (3pt), angle, xshift, yshift, radius (0.5pt) |
Stars | distance (3mm), angle, xshift, yshift, radius (1mm), points (5) |
The manual still labels this library experimental (“might change without notice”), and Lines is not a drop-in replacement for the old line patterns: north east lines corresponds to Lines[angle=45, distance={3pt/sqrt(2)}]. \tikzdeclarepattern defines entirely new patterns. Loading patterns alone and writing Lines[…] gives Undefined pattern.
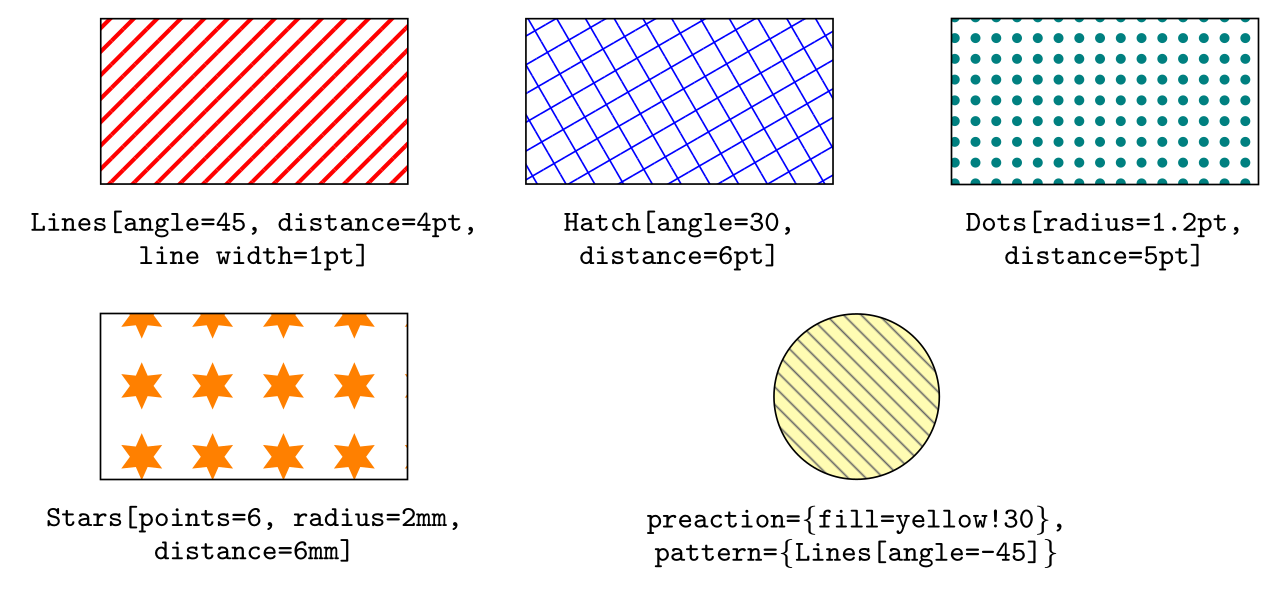
\usepackage{tikz} \usetikzlibrary{patterns.meta}\begin{tikzpicture}[code/.style={font=\ttfamily\scriptsize, align=center, anchor=north}]
\draw[pattern={Lines[angle=45, distance=4pt, line width=1pt]}, pattern color=red]
(0,0) rectangle ++(2.6,1.4);
\node[code] at (1.3,-0.1) {Lines[angle=45, distance=4pt,\\line width=1pt]};
\draw[pattern={Hatch[angle=30, distance=6pt]}, pattern color=blue]
(3.6,0) rectangle ++(2.6,1.4);
\node[code] at (4.9,-0.1) {Hatch[angle=30,\\distance=6pt]};
\draw[pattern={Dots[radius=1.2pt, distance=5pt]}, pattern color=teal]
(7.2,0) rectangle ++(2.6,1.4);
\node[code] at (8.5,-0.1) {Dots[radius=1.2pt,\\distance=5pt]};
\draw[pattern={Stars[points=6, radius=2mm, distance=6mm]}, pattern color=orange]
(0,-2.5) rectangle ++(2.6,1.4);
\node[code] at (1.3,-2.6) {Stars[points=6, radius=2mm,\\distance=6mm]};
\draw[preaction={fill=yellow!30}, pattern={Lines[angle=-45, distance=3pt]},
pattern color=black!60] (6.4,-1.8) circle[radius=0.7];
\node[code] at (6.4,-2.6) {preaction=\{fill=yellow!30\},\\pattern=\{Lines[angle=-45]\}};
\end{tikzpicture}Full document
\documentclass[border=4pt]{standalone}
\usepackage{tikz}
\usetikzlibrary{patterns.meta}
\begin{document}
\begin{tikzpicture}[code/.style={font=\ttfamily\scriptsize, align=center, anchor=north}]
  \draw[pattern={Lines[angle=45, distance=4pt, line width=1pt]}, pattern color=red]
    (0,0) rectangle ++(2.6,1.4);
  \node[code] at (1.3,-0.1) {Lines[angle=45, distance=4pt,\\line width=1pt]};
  \draw[pattern={Hatch[angle=30, distance=6pt]}, pattern color=blue]
    (3.6,0) rectangle ++(2.6,1.4);
  \node[code] at (4.9,-0.1) {Hatch[angle=30,\\distance=6pt]};
  \draw[pattern={Dots[radius=1.2pt, distance=5pt]}, pattern color=teal]
    (7.2,0) rectangle ++(2.6,1.4);
  \node[code] at (8.5,-0.1) {Dots[radius=1.2pt,\\distance=5pt]};

  \draw[pattern={Stars[points=6, radius=2mm, distance=6mm]}, pattern color=orange]
    (0,-2.5) rectangle ++(2.6,1.4);
  \node[code] at (1.3,-2.6) {Stars[points=6, radius=2mm,\\distance=6mm]};
  \draw[preaction={fill=yellow!30}, pattern={Lines[angle=-45, distance=3pt]},
        pattern color=black!60] (6.4,-1.8) circle[radius=0.7];
  \node[code] at (6.4,-2.6) {preaction=\{fill=yellow!30\},\\pattern=\{Lines[angle=-45]\}};
\end{tikzpicture}
\end{document}Colormaps: pgfplots, and using them in TikZ
TikZ itself has no colormaps; they come from pgfplots, where colormap name=viridis (or the style colormap/viridis) colours surfaces, scatter plots and a colorbar. pgfplots defines viridis, hot, hot2, jet, blackwhite, bluered, cool, greenyellow, redyellow and violet; \usepgfplotslibrary{colormaps} adds many more (and a high-resolution viridis), and \usepgfplotslibrary{colorbrewer} the ColorBrewer schemes.
With pgfplots loaded, any TikZ drawing can take a colour from a colormap: \fill[color of colormap={300 of colormap/viridis}] picks the colour at 300 on a scale from 0 (start) to 1000 (end), which is how the swatch rows were drawn. index of colormap={2 of …} picks the nth defining colour instead. Prefer viridis over rainbow maps such as jet: its brightness increases steadily, so the order of values survives greyscale printing and most colour-vision deficiencies.
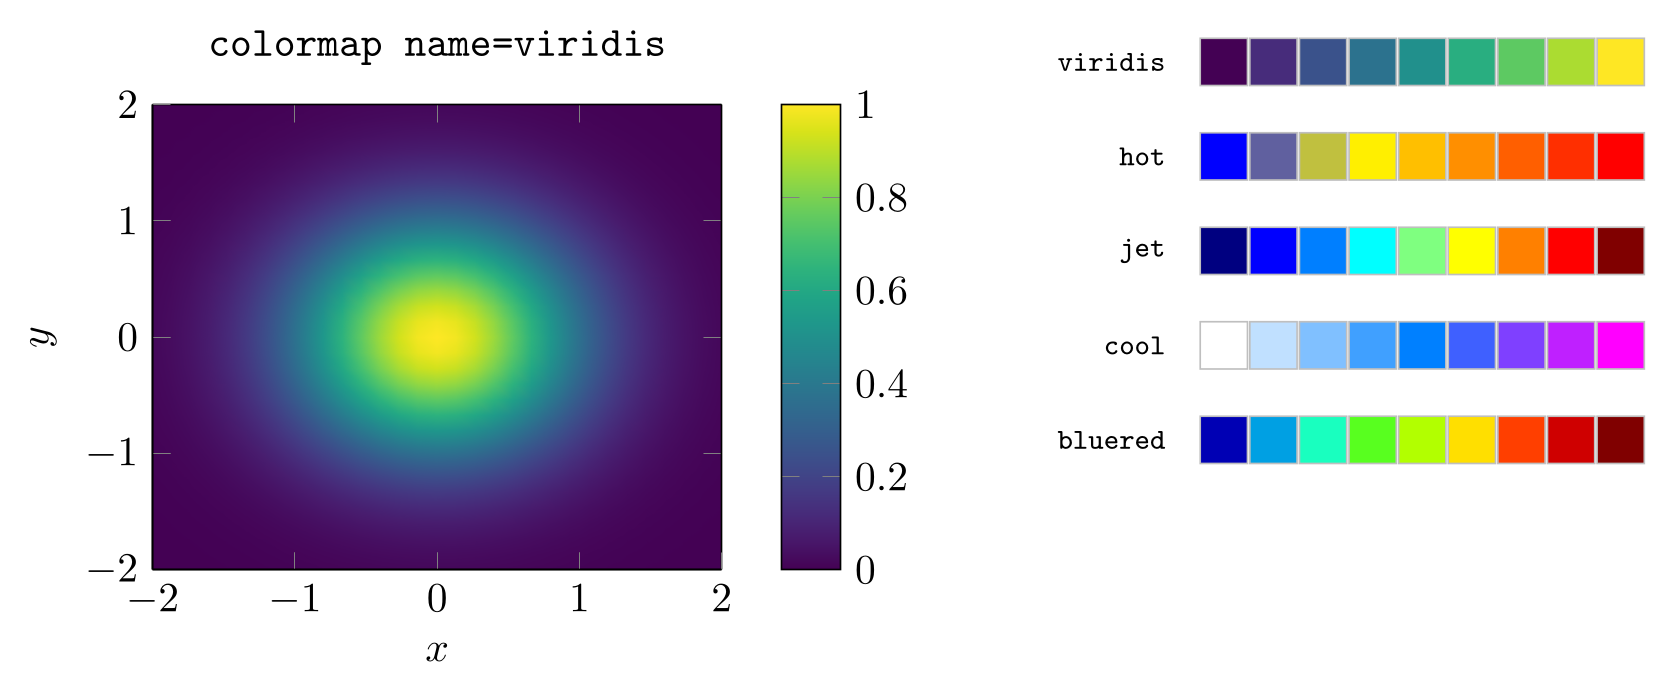
\usepackage{tikz} \usepackage{pgfplots} \pgfplotsset{compat=1.18}\begin{tikzpicture}
\begin{axis}[width=6.4cm, view={0}{90}, colorbar, colormap name=viridis,
title={\texttt{colormap name=viridis}}, xlabel=$x$, ylabel=$y$]
\addplot3[surf, shader=interp, domain=-2:2, samples=31] {exp(-x^2-y^2)};
\end{axis}
% colormap colours in ordinary TikZ drawings
\foreach \map [count=\r] in {viridis, hot, jet, cool, bluered} {
\node[anchor=east, font=\ttfamily\scriptsize] at (8.7,5.1-0.8*\r) {\map};
\foreach \v [count=\i] in {0,125,...,1000}
\filldraw[color of colormap={\v of colormap/\map}, draw=black!25]
(8.45+0.42*\i,4.9-0.8*\r) rectangle ++(0.4,0.4);
}
\end{tikzpicture}Full document
\documentclass[border=4pt]{standalone}
\usepackage{tikz}
\usepackage{pgfplots}
\pgfplotsset{compat=1.18}
\begin{document}
\begin{tikzpicture}
  \begin{axis}[width=6.4cm, view={0}{90}, colorbar, colormap name=viridis,
               title={\texttt{colormap name=viridis}}, xlabel=$x$, ylabel=$y$]
    \addplot3[surf, shader=interp, domain=-2:2, samples=31] {exp(-x^2-y^2)};
  \end{axis}
  % colormap colours in ordinary TikZ drawings
  \foreach \map [count=\r] in {viridis, hot, jet, cool, bluered} {
    \node[anchor=east, font=\ttfamily\scriptsize] at (8.7,5.1-0.8*\r) {\map};
    \foreach \v [count=\i] in {0,125,...,1000}
      \filldraw[color of colormap={\v of colormap/\map}, draw=black!25]
        (8.45+0.42*\i,4.9-0.8*\r) rectangle ++(0.4,0.4);
  }
\end{tikzpicture}
\end{document}Colour-blind-friendly colours
About one in twelve men of northern European ancestry has a red–green colour-vision deficiency, so a figure that tells red and green lines apart only by hue loses information. Two habits fix most problems: choose a palette designed for it, such as the eight Okabe–Ito colours defined below (orange, sky blue, bluish green, yellow, blue, vermillion, reddish purple, plus black), and do not rely on colour alone: vary the line style (solid, dashed, dotted), use different markers, and label lines directly instead of through a legend.
LabCanvas has a palette tool with 16 published colour-blind-safe palettes (Okabe–Ito, Paul Tol, viridis, ColorBrewer …) whose HEX codes go straight into \definecolor{…}{HTML}{…}, and a colour-blindness checker that shows how a finished figure (rendered as PNG) looks with protanopia, deuteranopia, tritanopia and in monochrome, and lists the colour pairs that become hard to tell apart.
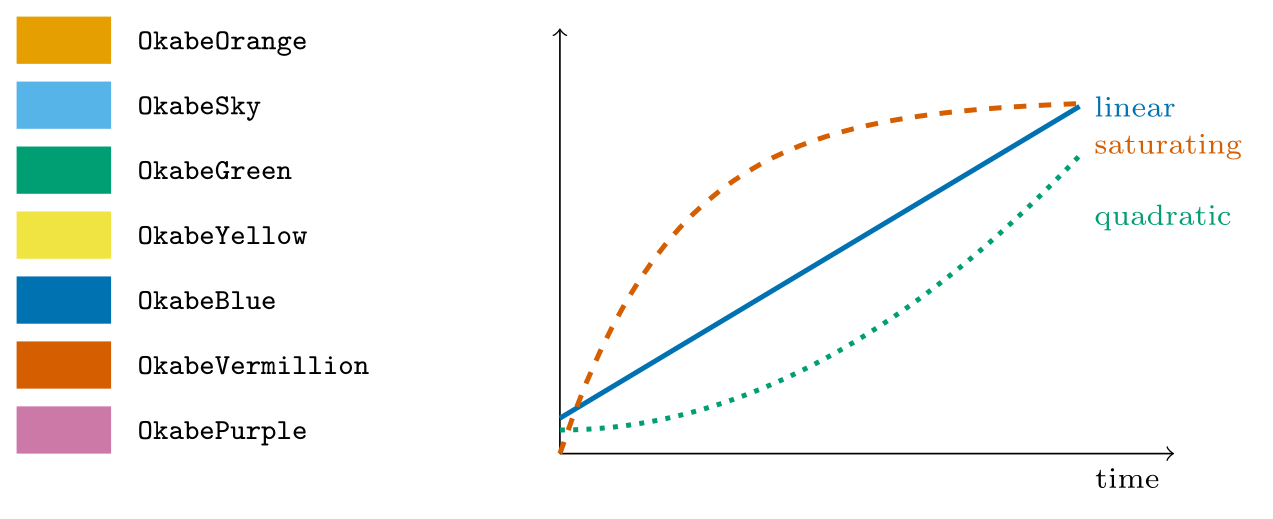
\usepackage{tikz} \definecolor{OkabeOrange}{HTML}{E69F00} \definecolor{OkabeSky}{HTML}{56B4E9} \definecolor{OkabeGreen}{HTML}{009E73} \definecolor{OkabeYellow}{HTML}{F0E442} \definecolor{OkabeBlue}{HTML}{0072B2} \definecolor{OkabeVermillion}{HTML}{D55E00} \definecolor{OkabePurple}{HTML}{CC79A7}\begin{tikzpicture}
\foreach \c [count=\i from 0] in {OkabeOrange, OkabeSky, OkabeGreen, OkabeYellow,
OkabeBlue, OkabeVermillion, OkabePurple} {
\fill[\c] (0,-0.55*\i) rectangle ++(0.8,0.4);
\node[anchor=mid west, font=\ttfamily\scriptsize] at (0.9,-0.55*\i+0.2) {\c};
}
% a chart that also works without colour: line styles and direct labels
\begin{scope}[xshift=4.6cm, yshift=-3.3cm]
\draw[->] (0,0) -- (5.2,0) node[below left, font=\scriptsize] {time};
\draw[->] (0,0) -- (0,3.6);
\draw[OkabeBlue, very thick] plot[domain=0:4.4, samples=40] (\x, {0.3+0.6*\x});
\draw[OkabeVermillion, very thick, dashed] plot[domain=0:4.4, samples=40] (\x, {3*(1-exp(-\x))});
\draw[OkabeGreen, very thick, dotted] plot[domain=0:4.4, samples=40] (\x, {0.2+0.12*\x*\x});
\node[right, text=OkabeBlue, font=\scriptsize] at (4.4,2.94) {linear};
\node[right, text=OkabeVermillion, font=\scriptsize] at (4.4,2.6) {saturating};
\node[right, text=OkabeGreen, font=\scriptsize] at (4.4,2.0) {quadratic};
\end{scope}
\end{tikzpicture}Full document
\documentclass[border=4pt]{standalone}
\usepackage{tikz}
\definecolor{OkabeOrange}{HTML}{E69F00}
\definecolor{OkabeSky}{HTML}{56B4E9}
\definecolor{OkabeGreen}{HTML}{009E73}
\definecolor{OkabeYellow}{HTML}{F0E442}
\definecolor{OkabeBlue}{HTML}{0072B2}
\definecolor{OkabeVermillion}{HTML}{D55E00}
\definecolor{OkabePurple}{HTML}{CC79A7}
\begin{document}
\begin{tikzpicture}
  \foreach \c [count=\i from 0] in {OkabeOrange, OkabeSky, OkabeGreen, OkabeYellow,
      OkabeBlue, OkabeVermillion, OkabePurple} {
    \fill[\c] (0,-0.55*\i) rectangle ++(0.8,0.4);
    \node[anchor=mid west, font=\ttfamily\scriptsize] at (0.9,-0.55*\i+0.2) {\c};
  }
  % a chart that also works without colour: line styles and direct labels
  \begin{scope}[xshift=4.6cm, yshift=-3.3cm]
    \draw[->] (0,0) -- (5.2,0) node[below left, font=\scriptsize] {time};
    \draw[->] (0,0) -- (0,3.6);
    \draw[OkabeBlue, very thick] plot[domain=0:4.4, samples=40] (\x, {0.3+0.6*\x});
    \draw[OkabeVermillion, very thick, dashed] plot[domain=0:4.4, samples=40] (\x, {3*(1-exp(-\x))});
    \draw[OkabeGreen, very thick, dotted] plot[domain=0:4.4, samples=40] (\x, {0.2+0.12*\x*\x});
    \node[right, text=OkabeBlue, font=\scriptsize] at (4.4,2.94) {linear};
    \node[right, text=OkabeVermillion, font=\scriptsize] at (4.4,2.6) {saturating};
    \node[right, text=OkabeGreen, font=\scriptsize] at (4.4,2.0) {quadratic};
  \end{scope}
\end{tikzpicture}
\end{document}Common errors and how to fix them
| LaTeX says (or you see) | Cause and fix |
|---|---|
| Package pgfkeys Error: I do not know the key '/tikz/ForestGreen' and I am going to ignore it. Perhaps you misspelled it. | TikZ tried the option as a colour and found none of that name. ForestGreen and the other CamelCase names come from \usepackage[dvipsnames]{xcolor} (or svgnames, x11names); check the spelling and capitalisation too. |
| Package xcolor Error: Undefined color `ForestGreen'. | The same problem when the colour is given to a key such as fill=, draw= or text=. Load the colour set or define the colour with \definecolor. |
| Package tikz Error: You need to say \usetikzlibrary{patterns}. | pattern= has no patterns until a library defines them: add \usetikzlibrary{patterns} (or patterns.meta for Lines, Hatch, Dots and Stars). |
| Package pgf Error: Undefined pattern `Lines[angle=45]'. | Lines, Hatch, Dots and Stars are in patterns.meta, not patterns: add \usetikzlibrary{patterns.meta}. |
| Illegal parameter number in definition of \@@clr. | An HTML colour was written with a hash sign, as in \definecolor{brand}{HTML}{#1F77B4}. Leave the # out: {HTML}{1F77B4}. |
| Package pgfkeys Error: I do not know the key '/tikz/upper left', to which you passed 'red', and I am going to ignore it. Perhaps you misspelled it. | The four-corner (bilinear interpolation) shading keys are in the shadings library: add \usetikzlibrary{shadings}. left color, top color, inner color and ball color need no library. |
| Package color Error: Argument `-0.5' not in range [0,1]. | A mixing percentage above 100, here red!150. Percentages run from 0 to 100; for a darker colour mix with black instead (red!70!black). |
| Package pgfkeys Error: I do not know the key '/tikz/rgb:red' and I am going to ignore it. Perhaps you misspelled it. | An extended colour expression with commas was written as a bare option, \fill[rgb:red,1;blue,2], and split at the commas. Give it to a key inside braces: \fill[fill={rgb:red,1;blue,2}]. |
| Package pgfkeys Error: I do not know the key '/tikz/color of colormap', to which you passed '500 of colormap/viridis', and I am going to ignore it. Perhaps you misspelled it. | color of colormap belongs to pgfplots: add \usepackage{pgfplots} (with \pgfplotsset{compat=1.18}). |
| The pattern disappears when a fill colour is added (no error) | A pattern is a kind of fill, and a later fill=… replaces it. Fill in a preaction instead: \draw[preaction={fill=yellow!30}, pattern=north east lines] …. |
Frequently asked questions
What colors are available in TikZ?
Without options, the 19 xcolor base colours: red, green, blue, cyan, magenta, yellow, black, gray, white, darkgray, lightgray, brown, lime, olive, orange, pink, purple, teal and violet, plus any mix of them such as blue!30 or green!60!black. \usepackage[dvipsnames]{xcolor} adds 68 names (ForestGreen, RoyalBlue …), svgnames 151 and x11names 317.
How do I fill a shape with color in TikZ?
Use \fill[blue!30] for a fill without outline, \filldraw[fill=blue!30, draw=blue] for both, or add fill=… to \draw or a node. The path must be closed (a rectangle, circle or a line ending in -- cycle); open paths are closed automatically for filling.
How do I use a hex color in TikZ?
Define it once in the preamble with \definecolor{mycolor}{HTML}{1F77B4} (six hex digits, no #), then use mycolor like any other colour: \fill[mycolor] or draw=mycolor!50.
How do I make a gradient in TikZ?
Use the shading keys: \shade[left color=red, right color=blue] … for a left-to-right gradient, top color and bottom color for top to bottom, inner color and outer color for a radial one, and shading angle to rotate it. No library is needed for these.
How do I make a shape transparent in TikZ?
Add fill opacity=0.5 for a see-through fill, draw opacity for the line, or opacity for both. In a node, fill opacity also fades the text unless you add text opacity=1.
How do I fill an area with hatching in TikZ?
Load \usetikzlibrary{patterns} and write \draw[pattern=north east lines, pattern color=gray] …. For adjustable spacing, angle and line width, load patterns.meta and use pattern={Lines[angle=45, distance=4pt, line width=0.8pt]}.
References
- PGF/TikZ manual, §15.2 Specifying a Colortikz.dev
- PGF/TikZ manual, §15.5 Filling a Path (fill, filldraw, interior rules)tikz.dev
- PGF/TikZ manual, §15.5.1 Graphic Parameters: Fill Patterntikz.dev
- PGF/TikZ manual, §15.7 Shading a Pathtikz.dev
- PGF/TikZ manual, §23.2 Specifying a Uniform Opacitytikz.dev
- PGF/TikZ manual, §69 Shadings Librarytikz.dev
- PGF/TikZ manual, §62.1 Form-Only Patternstikz.dev
- PGF/TikZ manual, §62.3 User-Defined Patterns (patterns.meta)tikz.dev
- pgfplots manual, §4.7.6 Color Maps (predefined maps, color of colormap)tikz.dev
- pgfplots manual, §5.3 Colormaps librarytikz.dev
- xcolor package on CTAN (manual: §2.3 colour expressions, §4 colour names)ctan.org
- pgf package (TikZ) on CTAN, with the full manual as PDFctan.org
The facts on this page were checked against these sources, and every picture is the code with it typeset with TeX Live 2026. Code on this page: CC0 1.0, copy it freely.
Try the code in your browserEvery snippet on this page opens in the free TikZ editor: it is typeset with TeX Live as you type, with errors pointed at their line.
Open the TikZ editor