TikZ diagram examples: flowcharts, mind maps, Venn
Contents
Fourteen general-purpose diagrams: four flowcharts and pipelines, six concept diagrams (a circular process, bubble, constellation, descriptive and priority diagrams, and a chart of materials informatics challenges), two mind maps, a circular tree and a Venn diagram with transparent circles.
Eight of them are made with the smartdiagram package, which builds a whole diagram from a list of items in one command; the mind maps use TikZ’s mindmap library and the Venn diagram uses opacity. To build a flowchart node by node instead, start from the flowchart template here or from the boxes and arrows guides in this section.
Flowcharts & pipelines

Horizontal flowchart
MIT licence, © Packt (code from LaTeX Graphics with TikZ by Stefan Kottwitz) · PacktPublishing/LaTeX-graphics-with-TikZ
Open in the TikZ editor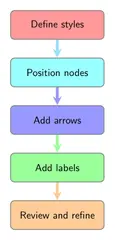
Vertical flowchart
MIT licence, © Packt (code from LaTeX Graphics with TikZ by Stefan Kottwitz) · PacktPublishing/LaTeX-graphics-with-TikZ
Open in the TikZ editor
Chevron sequence diagram
MIT licence, © Packt (code from LaTeX Graphics with TikZ by Stefan Kottwitz) · PacktPublishing/LaTeX-graphics-with-TikZ
Open in the TikZ editor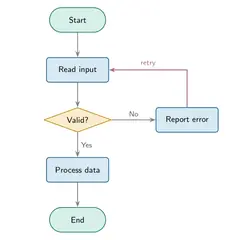
Concept diagrams
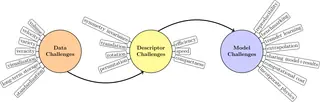
Materials informatics challenges
MIT licence, © Janosh Riebesell and contributors · janosh/diagrams
Open in the TikZ editor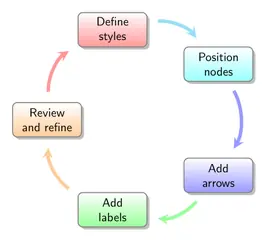
Circular process diagram
MIT licence, © Packt (code from LaTeX Graphics with TikZ by Stefan Kottwitz) · PacktPublishing/LaTeX-graphics-with-TikZ
Open in the TikZ editor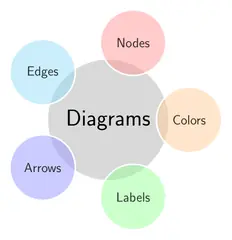
Bubble diagram
MIT licence, © Packt (code from LaTeX Graphics with TikZ by Stefan Kottwitz) · PacktPublishing/LaTeX-graphics-with-TikZ
Open in the TikZ editor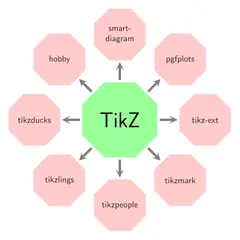
Constellation diagram
MIT licence, © Packt (code from LaTeX Graphics with TikZ by Stefan Kottwitz) · PacktPublishing/LaTeX-graphics-with-TikZ
Open in the TikZ editor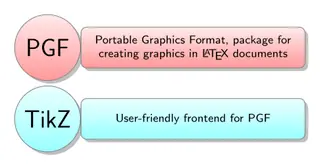
Descriptive diagram
MIT licence, © Packt (code from LaTeX Graphics with TikZ by Stefan Kottwitz) · PacktPublishing/LaTeX-graphics-with-TikZ
Open in the TikZ editor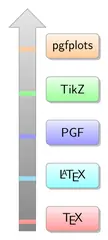
Priority diagram
MIT licence, © Packt (code from LaTeX Graphics with TikZ by Stefan Kottwitz) · PacktPublishing/LaTeX-graphics-with-TikZ
Open in the TikZ editor
Mind maps
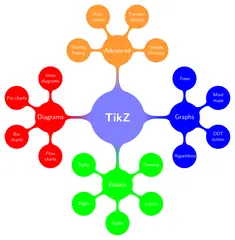
Mind map (large)
MIT licence, © Packt (code from LaTeX Graphics with TikZ by Stefan Kottwitz) · PacktPublishing/LaTeX-graphics-with-TikZ
Open in the TikZ editor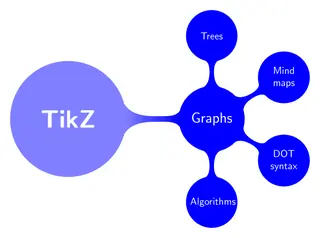
Mind map (medium)
MIT licence, © Packt (code from LaTeX Graphics with TikZ by Stefan Kottwitz) · PacktPublishing/LaTeX-graphics-with-TikZ
Open in the TikZ editor
Trees
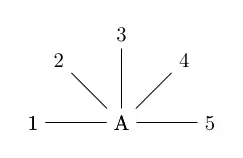
Circular tree
MIT licence, © Packt (code from LaTeX Graphics with TikZ by Stefan Kottwitz) · PacktPublishing/LaTeX-graphics-with-TikZ
Open in the TikZ editor
Venn diagrams
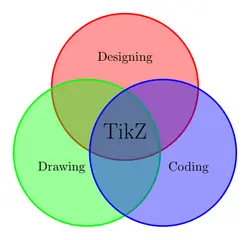
Venn diagram with transparency
MIT licence, © Packt (code from LaTeX Graphics with TikZ by Stefan Kottwitz) · PacktPublishing/LaTeX-graphics-with-TikZ
Open in the TikZ editor
Using these figures
Every figure keeps its own licence: MIT or CC0 1.0, both of which allow use, change and sharing, commercial use included. The MIT licence asks that its copyright and permission notice go with copies of the code, so each figure’s code starts with its source, author and licence; keep those lines when you reuse it. The full licence texts are on the sources and licences page.
“Open in the TikZ editor” loads the figure’s complete document into the free TikZ editor, where it is typeset with TeX Live 2026 and you can change it and download a PNG. To compile it on your own computer, save the code as a .tex file and run pdfLaTeX (or the engine the tile names) on it; LabCanvas changed the files only where needed to make each one compile on its own, as its first lines say.