TikZ and pgfplots chart examples
Contents
Sixteen plots and charts: function plots (two intersecting curves, the area between curves, a spiral on polar axes), 3D plots (a 3D bar plot, a colour-blind-friendly mesh, a viridis surface), seven bar and pie charts and three line and area charts. Most come from the code of Stefan Kottwitz’s book LaTeX Graphics with TikZ and from Martin Thoma’s examples.
Fourteen of the sixteen are made with pgfplots, which draws the axes, ticks and legends for you; the two pie charts use the pgf-pie package.
Function plots
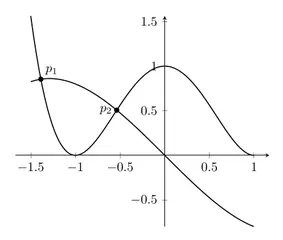
Intersection of two curves
MIT licence, © Packt (code from LaTeX Graphics with TikZ by Stefan Kottwitz) · PacktPublishing/LaTeX-graphics-with-TikZ
Open in the TikZ editor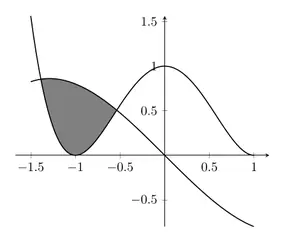
Filling between curves
MIT licence, © Packt (code from LaTeX Graphics with TikZ by Stefan Kottwitz) · PacktPublishing/LaTeX-graphics-with-TikZ
Open in the TikZ editor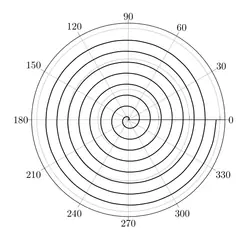
Spiral in polar axes
MIT licence, © Packt (code from LaTeX Graphics with TikZ by Stefan Kottwitz) · PacktPublishing/LaTeX-graphics-with-TikZ
Open in the TikZ editor
3D plots
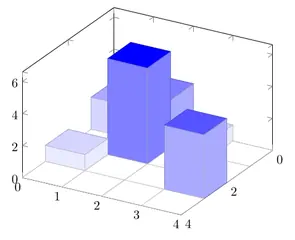
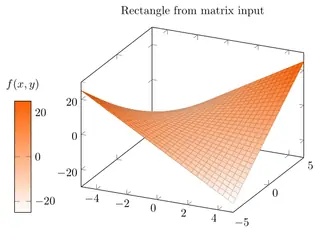
Colour-blind-friendly mesh plot
MIT licence, © Martin Thoma · MartinThoma/LaTeX-examples
Open in the TikZ editor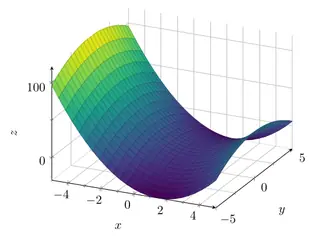
Surface plot (viridis)
MIT licence, © Martin Thoma · MartinThoma/LaTeX-examples
Open in the TikZ editor
Bar & pie charts
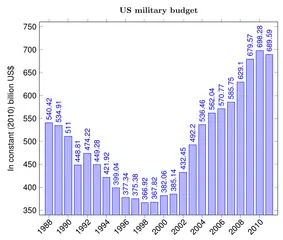
Bar chart with value labels
MIT licence, © Martin Thoma · MartinThoma/LaTeX-examples
Open in the TikZ editor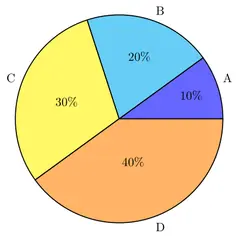
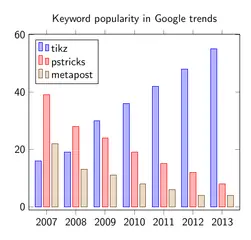
Grouped bar chart
MIT licence, © Packt (code from LaTeX Graphics with TikZ by Stefan Kottwitz) · PacktPublishing/LaTeX-graphics-with-TikZ
Open in the TikZ editor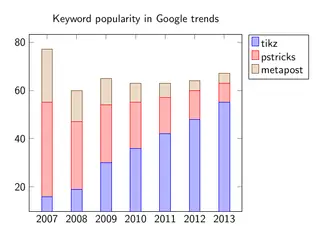
Stacked bar chart
MIT licence, © Packt (code from LaTeX Graphics with TikZ by Stefan Kottwitz) · PacktPublishing/LaTeX-graphics-with-TikZ
Open in the TikZ editor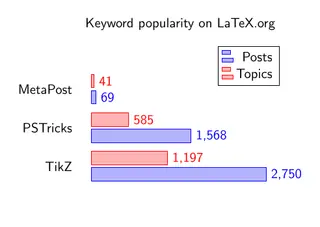
Horizontal bar chart
MIT licence, © Packt (code from LaTeX Graphics with TikZ by Stefan Kottwitz) · PacktPublishing/LaTeX-graphics-with-TikZ
Open in the TikZ editor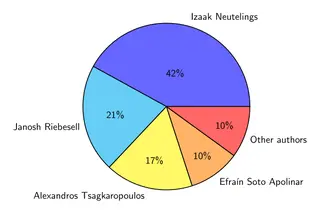
Pie chart (percentages)
MIT licence, © Packt (code from LaTeX Graphics with TikZ by Stefan Kottwitz) · PacktPublishing/LaTeX-graphics-with-TikZ
Open in the TikZ editor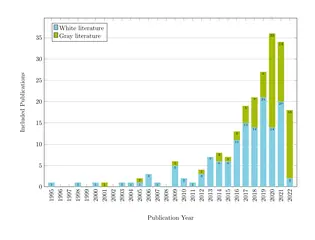
Stacked bar chart (publications per year)
MIT licence, © Andreas Bauer · andreas-bauer/tikz
Open in the TikZ editor
Line & area charts
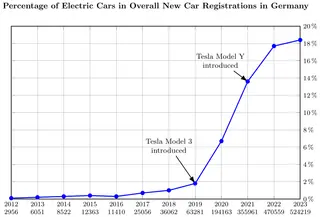
Line chart with annotations
MIT licence, © Martin Thoma · MartinThoma/LaTeX-examples
Open in the TikZ editor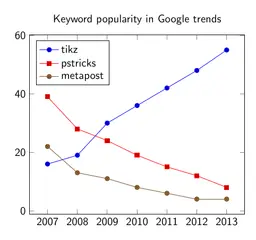
Line chart with markers
MIT licence, © Packt (code from LaTeX Graphics with TikZ by Stefan Kottwitz) · PacktPublishing/LaTeX-graphics-with-TikZ
Open in the TikZ editor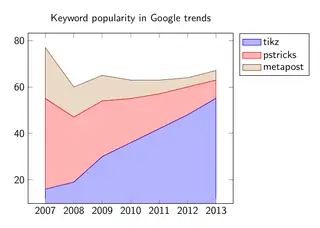
Stacked area chart
MIT licence, © Packt (code from LaTeX Graphics with TikZ by Stefan Kottwitz) · PacktPublishing/LaTeX-graphics-with-TikZ
Open in the TikZ editor
Using these figures
Every figure keeps its own licence: MIT or CC0 1.0, both of which allow use, change and sharing, commercial use included. The MIT licence asks that its copyright and permission notice go with copies of the code, so each figure’s code starts with its source, author and licence; keep those lines when you reuse it. The full licence texts are on the sources and licences page.
“Open in the TikZ editor” loads the figure’s complete document into the free TikZ editor, where it is typeset with TeX Live 2026 and you can change it and download a PNG. To compile it on your own computer, save the code as a .tex file and run pdfLaTeX (or the engine the tile names) on it; LabCanvas changed the files only where needed to make each one compile on its own, as its first lines say.