TikZ mathematics examples
Contents
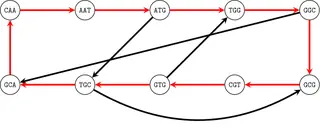
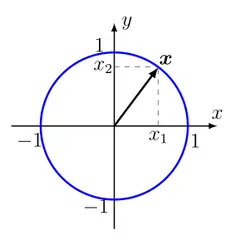
Thirty-six figures across geometry (the unit circle, incircle and circumcircle, the arbelos, a Koch snowflake), topology (a pair of pants), graph theory (a Hamiltonian cycle, K3,3, the Königsberg bridges), functions and calculus (Taylor polynomials of sine, the area under x², branch cuts, a saddle surface), linear algebra and tensors, probability distributions and numerical methods such as a five-point stencil, a Q1 finite element basis function and conjugate gradient steps.
Fourteen use pgfplots for axes and function plots and three use tikz-3dplot for 3D views; the others rely on TikZ’s own tools, such as polar coordinates, calc for computed points, and the angles and quotes libraries for marked angles.
Geometry
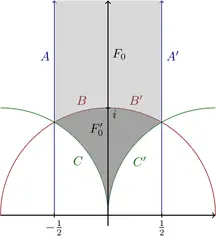
Fundamental domain of the modular group
MIT licence, © Janosh Riebesell and contributors · janosh/diagrams
Open in the TikZ editor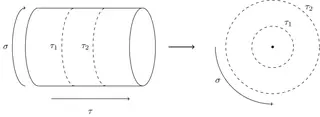
Cylinder to plane (conformal map)
MIT licence, © Janosh Riebesell and contributors · janosh/diagrams
Open in the TikZ editor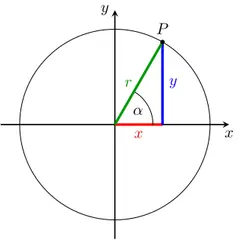
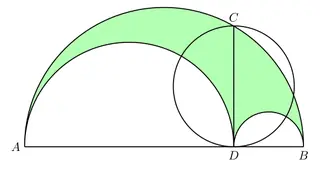
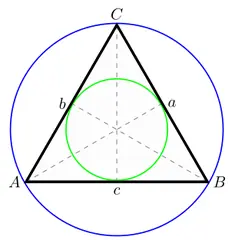
Incircle and circumcircle
MIT licence, © Martin Thoma · MartinThoma/LaTeX-examples
Open in the TikZ editor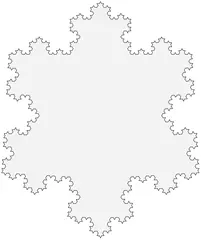
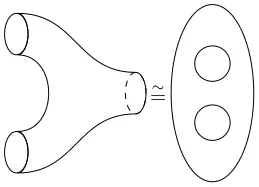
Topology
Graph theory
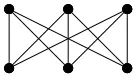
Complete bipartite graph K3,3
MIT licence, © Martin Thoma · MartinThoma/LaTeX-examples
Open in the TikZ editor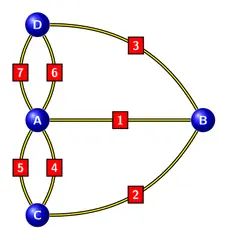
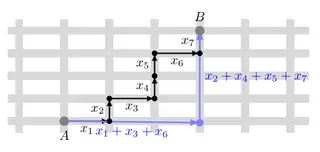
Königsberg bridges
MIT licence, © Packt (code from LaTeX Graphics with TikZ by Stefan Kottwitz) · PacktPublishing/LaTeX-graphics-with-TikZ
Open in the TikZ editor
Functions & calculus

Branch cuts in the complex plane
MIT licence, © Janosh Riebesell and contributors · janosh/diagrams
Open in the TikZ editor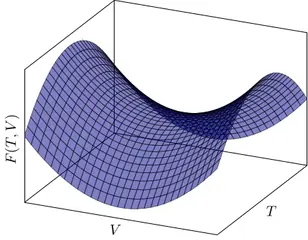
Saddle point surface
MIT licence, © Janosh Riebesell and contributors · janosh/diagrams
Open in the TikZ editor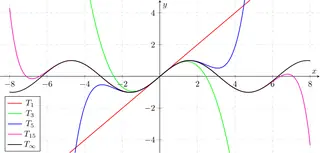
Taylor polynomials of sine
MIT licence, © Martin Thoma · MartinThoma/LaTeX-examples
Open in the TikZ editor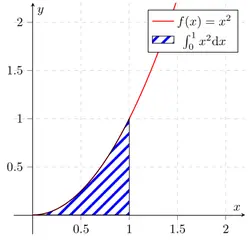
Area under x² (integral)
MIT licence, © Martin Thoma · MartinThoma/LaTeX-examples
Open in the TikZ editor
Linear algebra & tensors
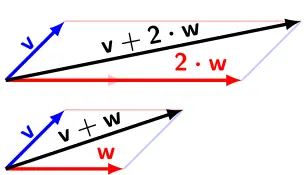
Vector addition and scaling
MIT licence, © Martin Thoma · MartinThoma/LaTeX-examples
Open in the TikZ editor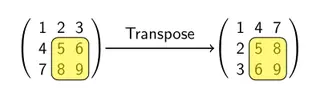
Highlighting matrix entries
MIT licence, © Packt (code from LaTeX Graphics with TikZ by Stefan Kottwitz) · PacktPublishing/LaTeX-graphics-with-TikZ
Open in the TikZ editor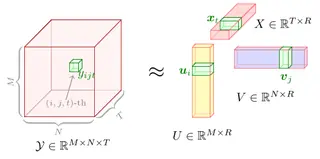
CP tensor factorisation
MIT licence, © Xinyu Chen · xinychen/awesome-latex-drawing
Open in the TikZ editor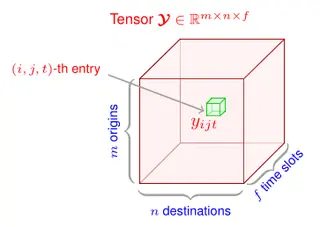
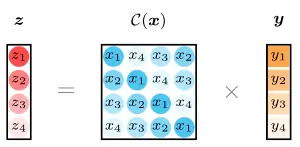
Circulant matrix product
MIT licence, © Xinyu Chen · xinychen/awesome-latex-drawing
Open in the TikZ editor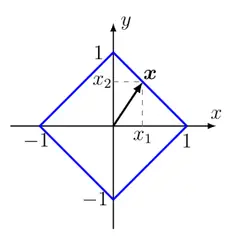
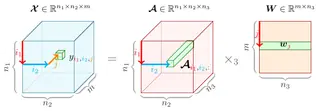
Tensor mode-3 product
MIT licence, © Xinyu Chen · xinychen/awesome-latex-drawing
Open in the TikZ editor
Probability & statistics
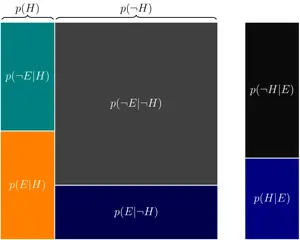
Bayes’ theorem, geometrically
MIT licence, © Janosh Riebesell and contributors · janosh/diagrams
Open in the TikZ editor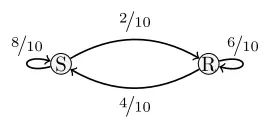
Markov chain (rain and sun)
MIT licence, © Martin Thoma · MartinThoma/LaTeX-examples
Open in the TikZ editor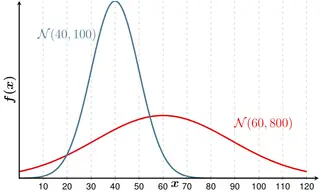
Two normal distributions
MIT licence, © Martin Thoma · MartinThoma/LaTeX-examples
Open in the TikZ editor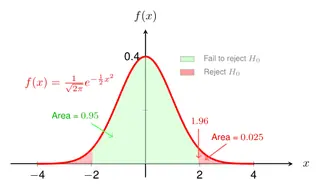
Normal distribution: rejection regions
MIT licence, © Xinyu Chen · xinychen/awesome-latex-drawing
Open in the TikZ editor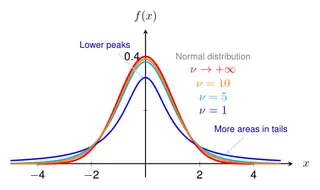
Student’s t vs normal distribution
MIT licence, © Xinyu Chen · xinychen/awesome-latex-drawing
Open in the TikZ editor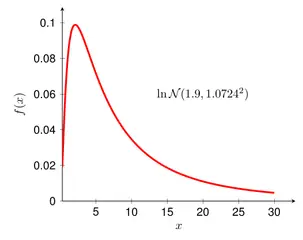
Log-normal distribution
MIT licence, © Xinyu Chen · xinychen/awesome-latex-drawing
Open in the TikZ editor
Numerical methods
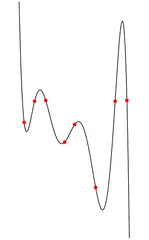
Polynomial interpolation (Runge)
MIT licence, © Martin Thoma · MartinThoma/LaTeX-examples
Open in the TikZ editor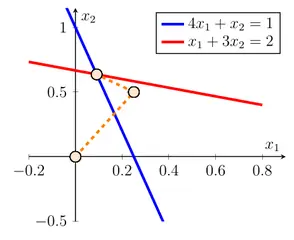
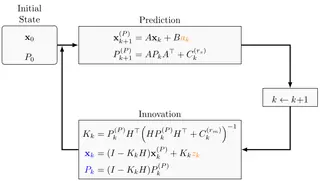
Conjugate gradient steps
MIT licence, © Xinyu Chen · xinychen/awesome-latex-drawing
Open in the TikZ editor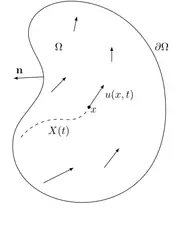
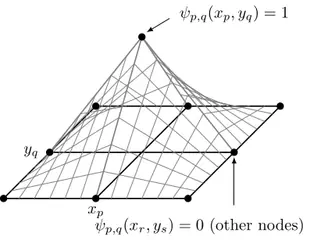
Q1 finite element basis function
MIT licence, © Ed Bueler · bueler/tikz-examples
Open in the TikZ editor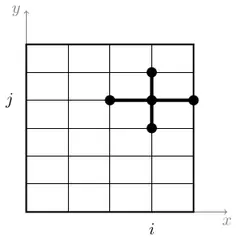
Using these figures
Every figure keeps its own licence: MIT or CC0 1.0, both of which allow use, change and sharing, commercial use included. The MIT licence asks that its copyright and permission notice go with copies of the code, so each figure’s code starts with its source, author and licence; keep those lines when you reuse it. The full licence texts are on the sources and licences page.
“Open in the TikZ editor” loads the figure’s complete document into the free TikZ editor, where it is typeset with TeX Live 2026 and you can change it and download a PNG. To compile it on your own computer, save the code as a .tex file and run pdfLaTeX (or the engine the tile names) on it; LabCanvas changed the files only where needed to make each one compile on its own, as its first lines say.