ICP-MS and ICP-OES: elemental analysis with an inductively coupled plasma
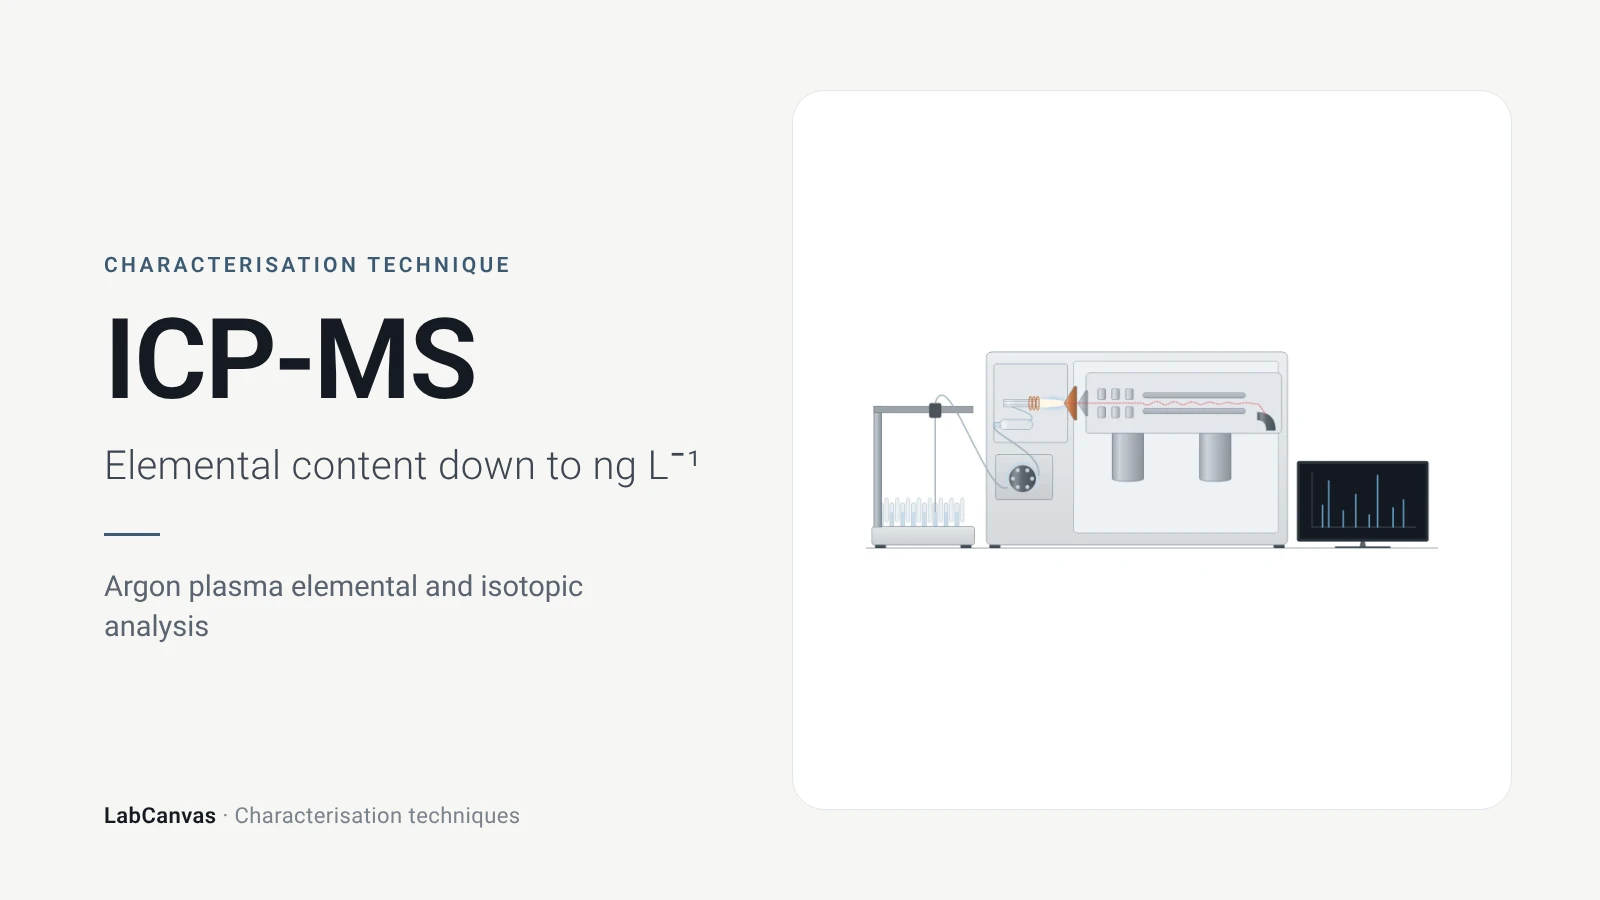
Inductively coupled plasma mass spectrometry (ICP-MS) measures which elements a sample contains and how much: a dissolved sample is nebulised into an argon plasma that vaporises, atomises and ionises it into singly charged positive ions, which a mass spectrometer sorts by mass-to-charge ratio (Mazarakioti et al. 2022). It covers more than 65 elements with detection limits in the ng L⁻¹ range for most of them and also gives isotope ratios (Mazarakioti et al. 2022). ICP-OES uses the same kind of plasma but reads the light emitted at element-specific spectral lines and is normally less sensitive (Provete et al. 2024); chemists use both to measure metal loadings, stoichiometry, impurities and leached metal in catalysts, MOFs and battery materials (Bekmyrza et al. 2025; Recknagel et al. 2025).
Contents
ICP-MS and ICP-OES at a glance
| Ion source | Argon inductively coupled plasma that vaporises, decomposes, atomises and ionises the nebulised sample into mostly singly charged positive ions (Mazarakioti et al. 2022) |
|---|---|
| Signal measured | ICP-MS: ion counts at each mass-to-charge ratio (Mazarakioti et al. 2022); ICP-OES: emission intensity at element spectral lines, e.g. Hg at 253 and 194 nm (Provete et al. 2024) |
| Main information | Elemental composition, concentrations and isotopic abundances (Mazarakioti et al. 2022) |
| Elements | More than 65 elements (Mazarakioti et al. 2022) |
| Detection limit | ng L⁻¹ for most elements by ICP-MS (Mazarakioti et al. 2022); for Hg, 0.0079 µg L⁻¹ by ICP-MS vs 0.54 µg L⁻¹ by cold-vapour ICP-OES (Provete et al. 2024) |
| Typical sample | A solution made by thermally assisted acid digestion, commonly 65–70% HNO₃ in a microwave oven, or HNO₃ with H₂O₂, HCl or HF (Mazarakioti et al. 2022) |
| Mass analysers | Quadrupole, triple quadrupole, time-of-flight and sector field (Mazarakioti et al. 2022; Gregar et al. 2025) |
| Quantification | Calibration curves with internal standards such as Sc or In; also matrix matching, standard additions or isotope dilution (Mazarakioti et al. 2022; Recknagel et al. 2025) |
| Single-particle mode | Pulse intensity gives particle mass and size, pulse frequency gives number concentration (Gregar et al. 2025) |
| Interlaboratory precision | Laboratory means for Li, Ni, Mn and Co in an NMC 111 reference cathode had a relative standard deviation of 1% across the participating laboratories (Recknagel et al. 2025) |
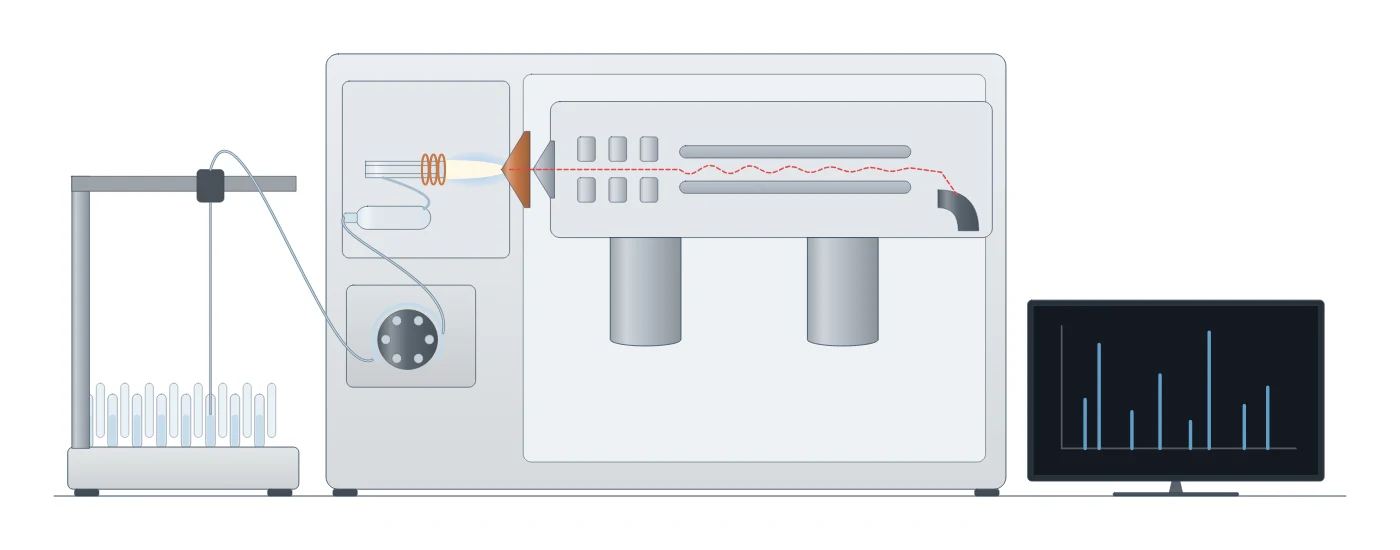
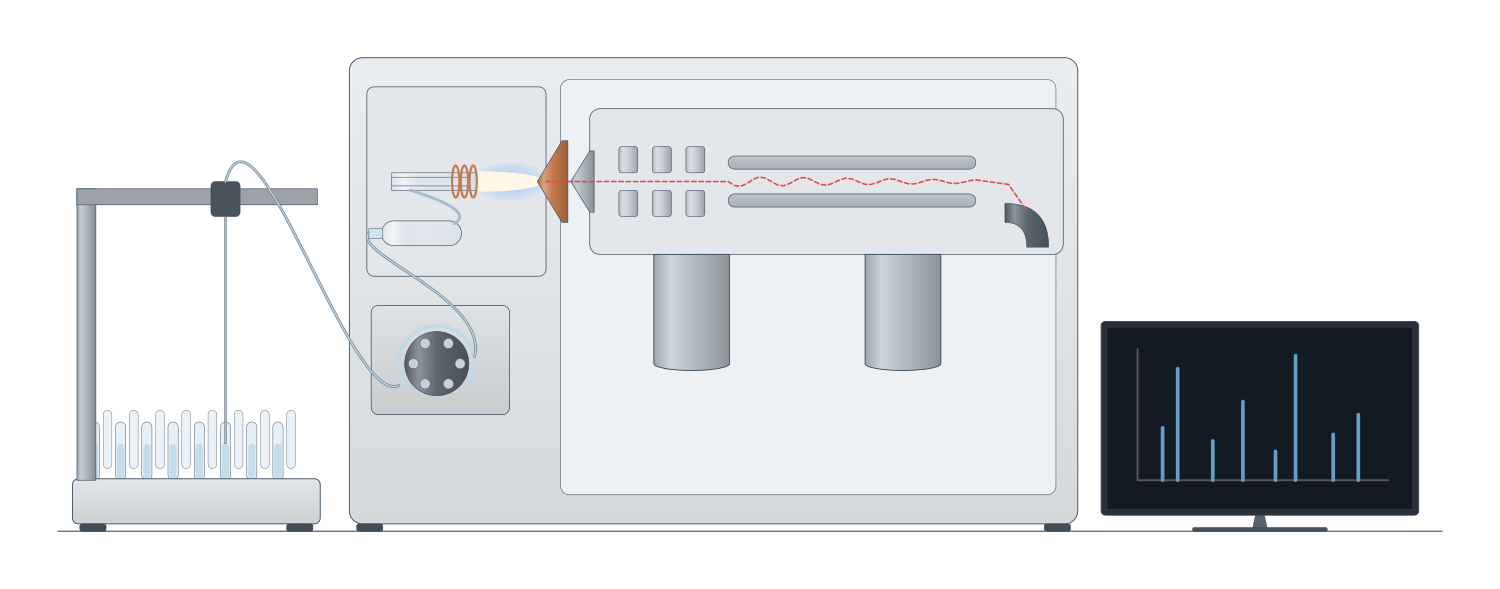
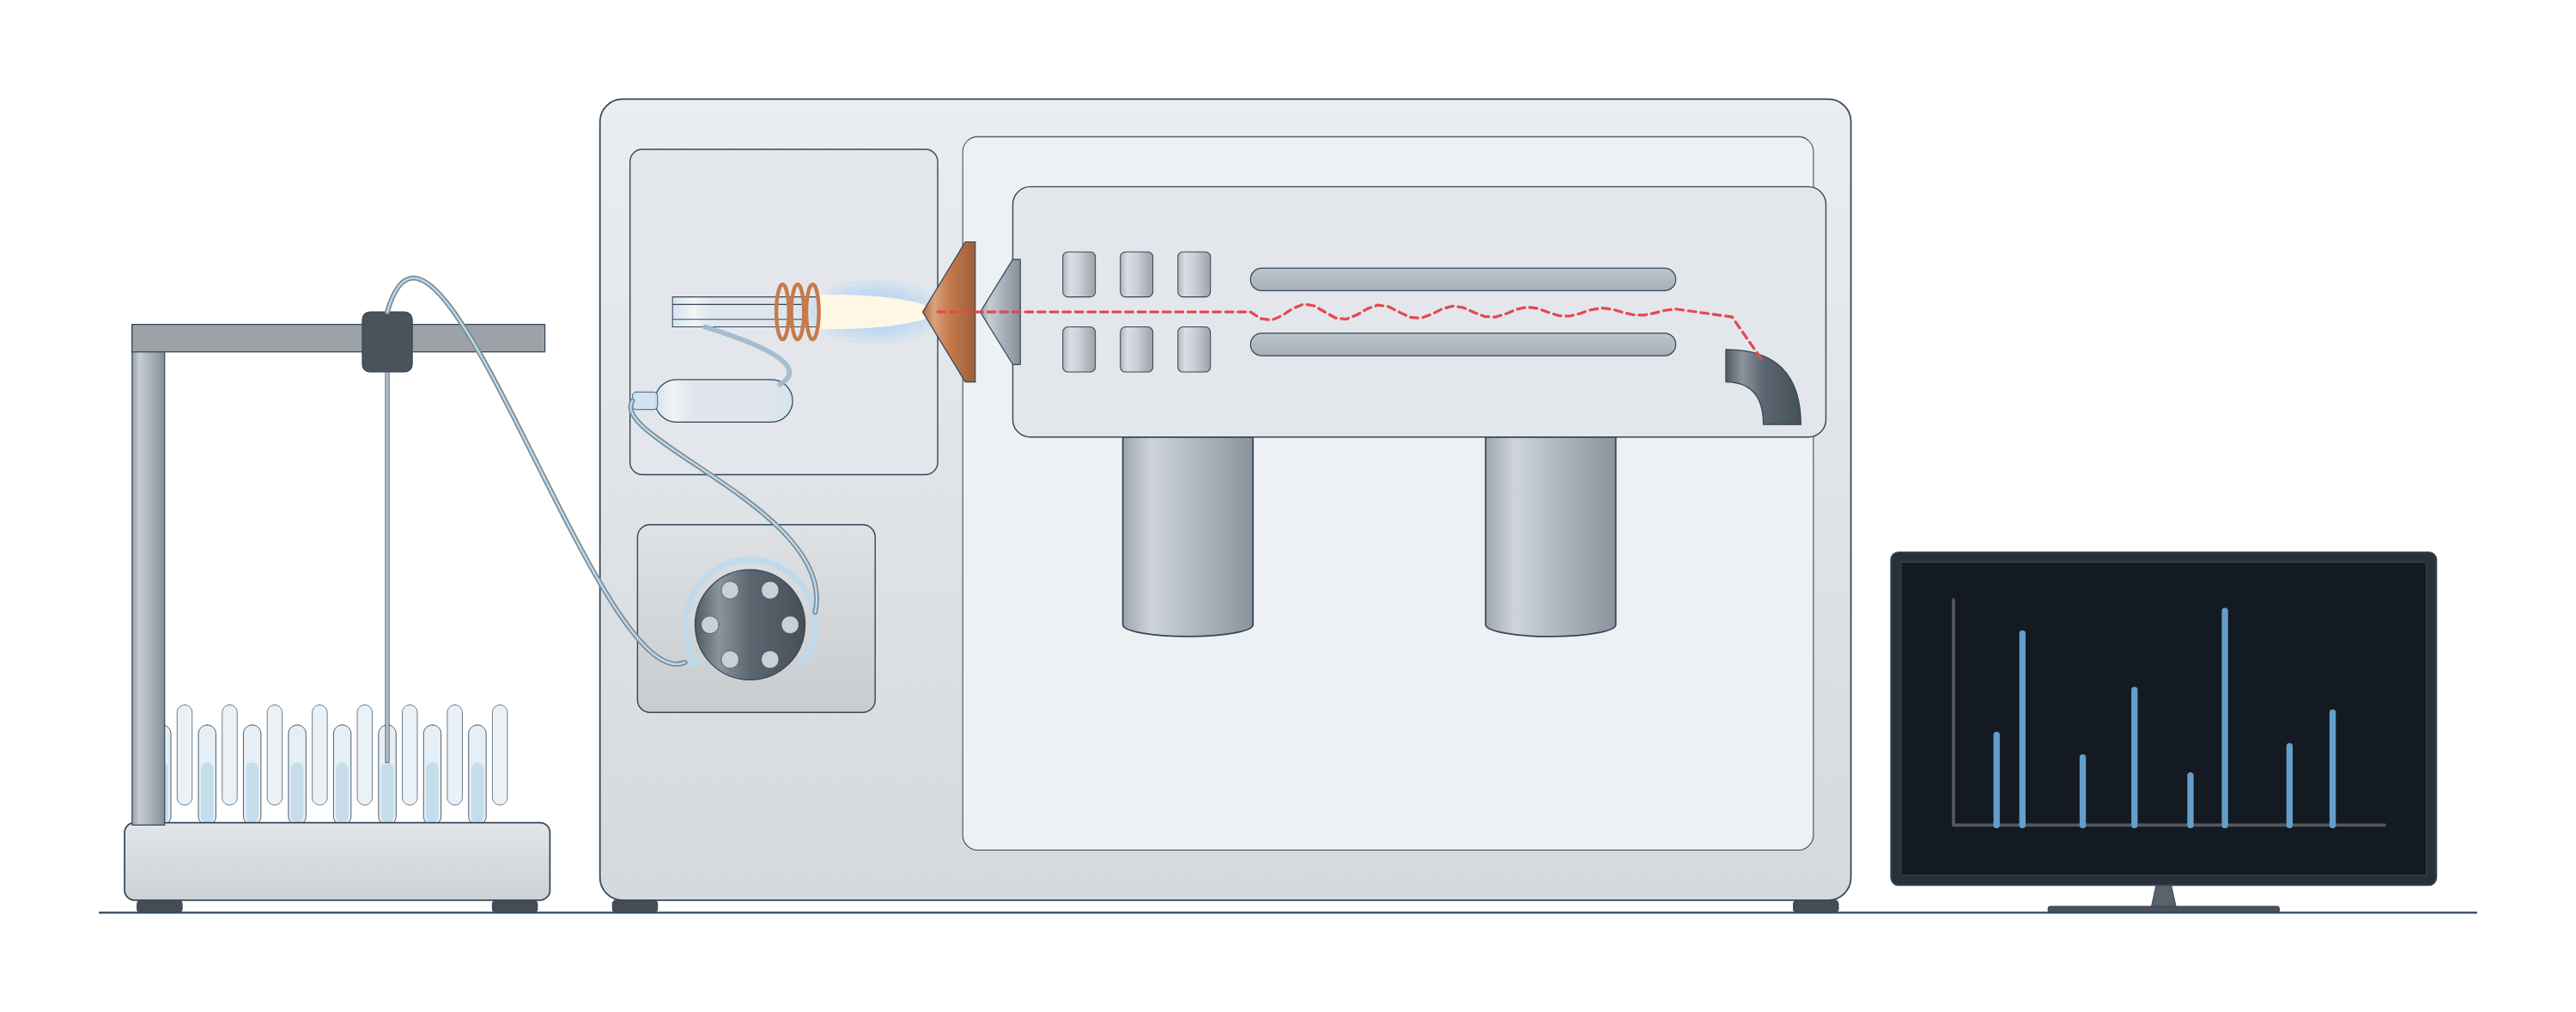
ICP-MS and ICP-OES instrument drawing (high-resolution SVG)
ICP-MS and ICP-OES data: an example plot to edit
How ICP-MS works
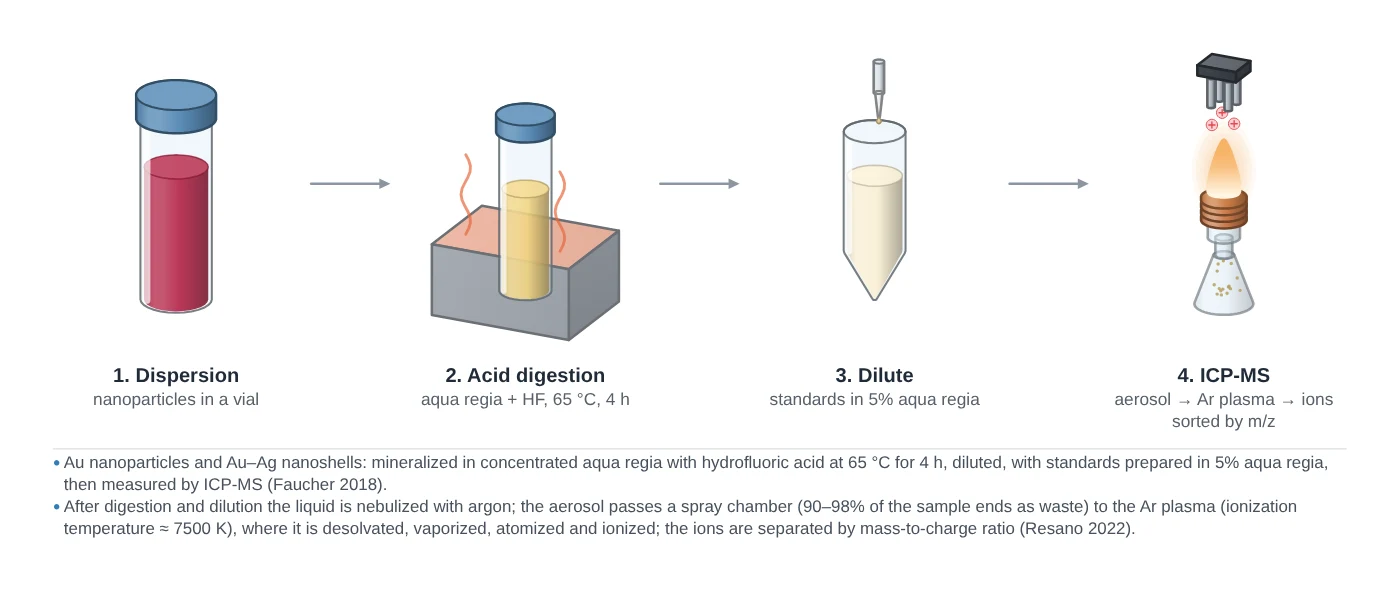
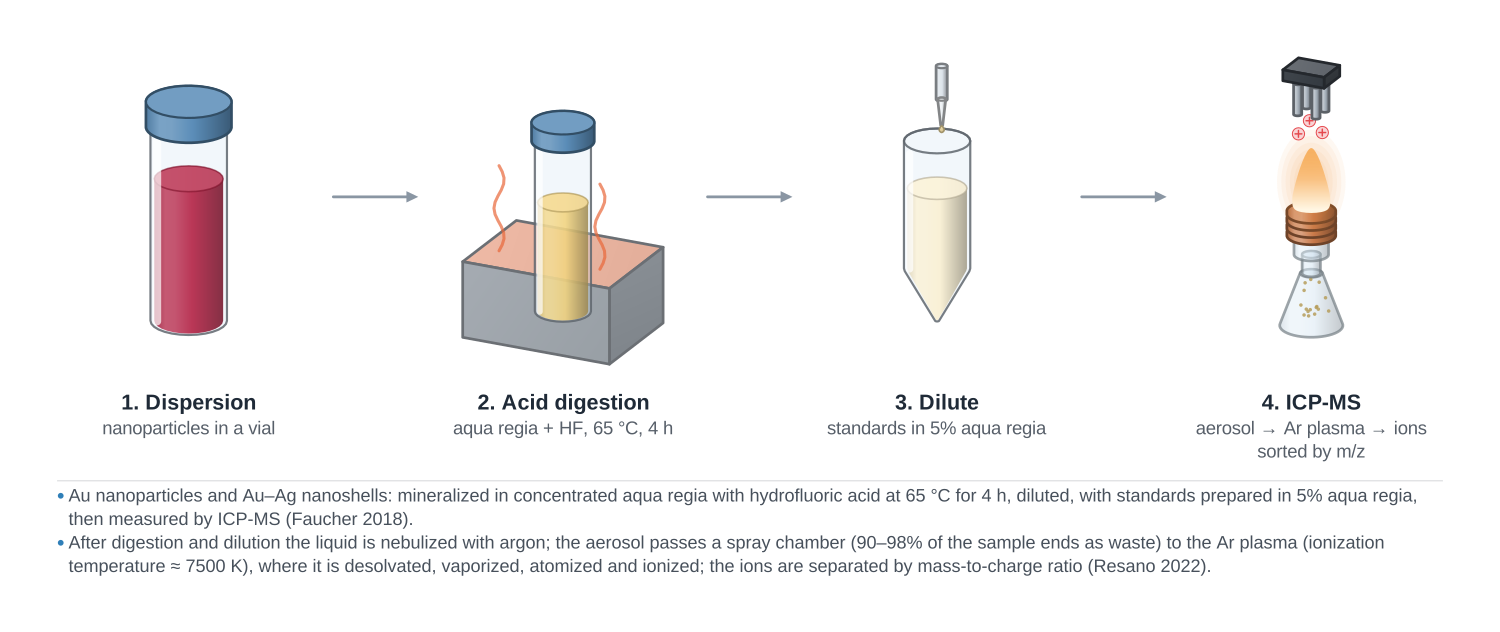
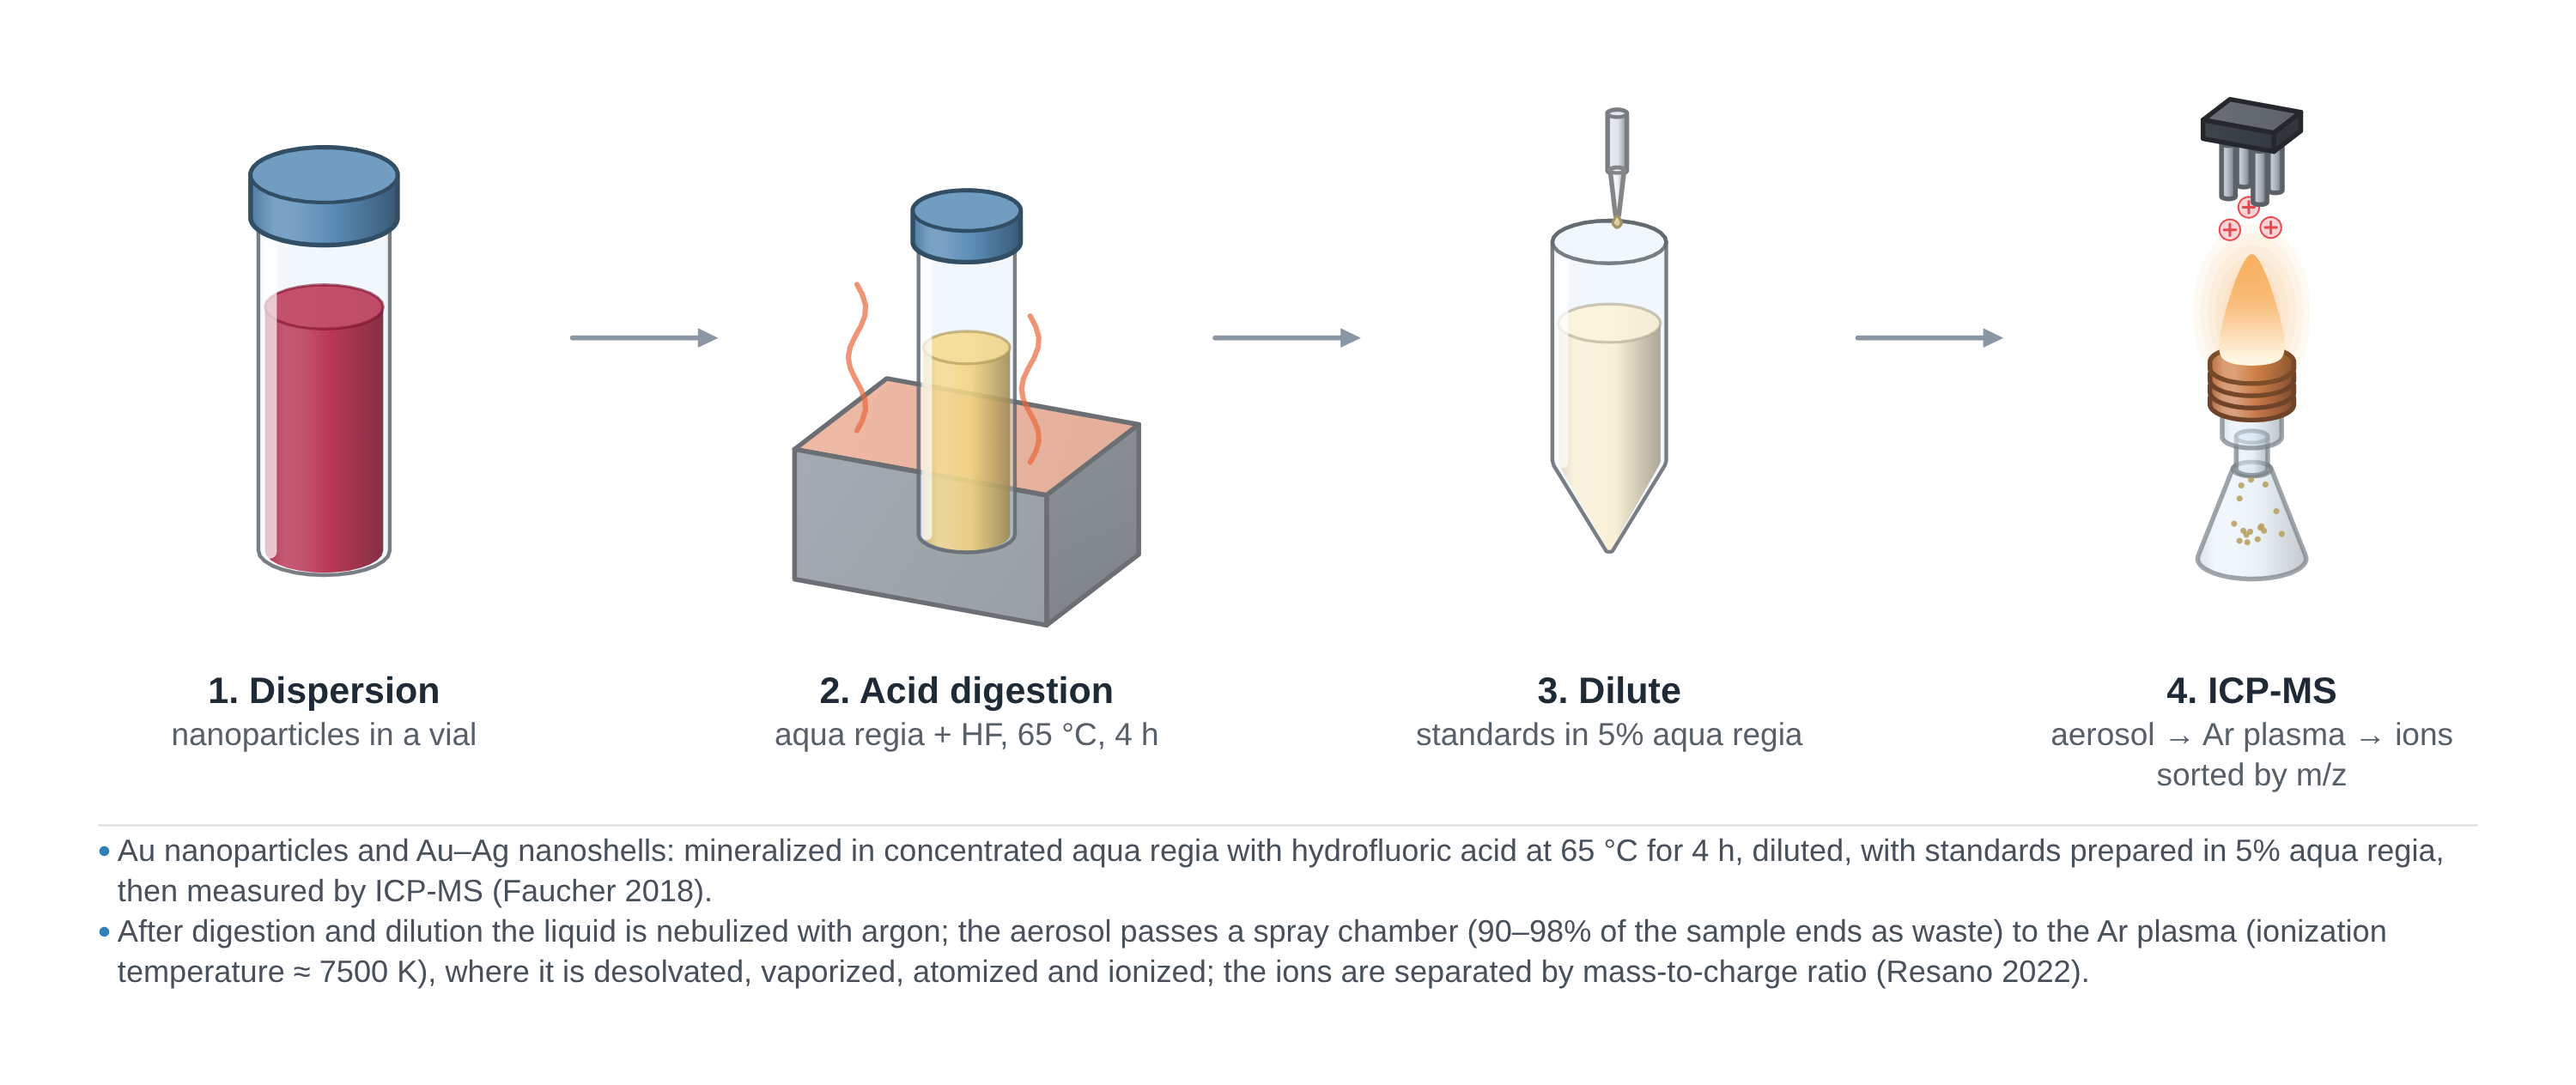
An ICP-MS instrument has six parts: a sample introduction system, the inductively coupled plasma that acts as ion source, an interface, electrostatic lenses, a mass spectrometer and a detector (Mazarakioti et al. 2022). A peristaltic pump feeds the liquid sample to a nebuliser, where it is mixed with argon into an aerosol; the spray chamber removes large droplets, and the fine aerosol passes through the central channel of the argon plasma (Mazarakioti et al. 2022). There the droplets are vaporised, decomposed, atomised and finally ionised. Argon has a higher ionisation potential than most elements, so they are ionised efficiently, mainly to singly charged positive ions (Mazarakioti et al. 2022).
The ions pass through the ~1 mm orifice of the sample cone and the ~0.45 mm orifice of the skimmer cone, with 150–300 Pa between them, into the high vacuum where ion lenses steer them to the mass analyser and away from photons and neutral species (Mazarakioti et al. 2022). A quadrupole (or triple quadrupole, time-of-flight or sector-field analyser) separates them by mass-to-charge ratio, and an electron multiplier counts them (Mazarakioti et al. 2022; Gregar et al. 2025). Counts are converted to concentrations with calibration curves, and internal-standard elements of similar mass and ionisation potential correct for drift and matrix effects (Mazarakioti et al. 2022).
ICP-OES uses an inductively coupled plasma too but measures the light that excited atoms and ions emit at element-specific spectral lines, for example the Hg lines at 253 and 194 nm, instead of counting ions (Provete et al. 2024). Its sensitivity is normally lower than that of ICP-MS (Provete et al. 2024), but it is a standard way to determine major constituents such as lithium in cathode materials (Recknagel et al. 2025).
What the data looks like and how to read it
- Calibration curve. For each element the signal (counts per second for ICP-MS) is plotted against standards of known concentration, and sample concentrations are read from it (Mazarakioti et al. 2022).
- Internal standard recovery. If the analyte-to-internal-standard ratio stays within about ±20% recovery, drift and matrix effects are under control (Mazarakioti et al. 2022).
- From solution to solid. Results for a digested solid are converted back with the sample mass and dilution volume; for marine sediment a 100-fold dilution turned an instrumental Hg LoQ of 0.026 µg L⁻¹ into a method LoQ of 1.9 µg kg⁻¹ (Provete et al. 2024).
- Metal loading. Results are usually reported as wt% and molar ratios: ICP-OES of Pt-doped NiFe MOFs gave 0.52, 1.05, 1.57 and 2.08 wt% Pt for nominal 0.5–2.0 wt% and a Ni:Fe ratio of about 3:2 in every sample (Bekmyrza et al. 2025).
- Isotope ratios. ICP-MS also measures isotopic abundances (Mazarakioti et al. 2022); a multicollector instrument gave a lithium isotope ratio of 12.34 for an NMC reference cathode (Recknagel et al. 2025).
- Single-particle data. In spICP-MS the time trace shows discrete pulses above a continuous ionic background; a statistical threshold separates particle events, pulse height is converted to particle mass and size, and the pulse rate gives particle number concentration (Gregar et al. 2025).
Sample preparation
- Digest the solid. ICP was designed for liquids, so solids are normally dissolved by thermally assisted acid digestion, commonly with 65–70% HNO₃ in a microwave oven, or with HNO₃ plus H₂O₂, HCl or HF (Mazarakioti et al. 2022). A typical microwave programme ramps to 180 °C in 5 min and holds for 10 min (Provete et al. 2024).
- Aqua regia for metals and oxides. NMC cathode powder dissolves in aqua regia on a hotplate at 120–150 °C, and some laboratories add HF (Recknagel et al. 2025); Pt-doped NiFe MOFs were digested in aqua regia (HCl:HNO₃ 3:1) at 80 °C for 12 h (Bekmyrza et al. 2025).
- Dilute and add internal standards. Make up to volume with ultrapure water, add internal standards such as Sc or In, and match the calibration matrix when measuring traces next to large amounts of Li, Ni, Mn and Co (Mazarakioti et al. 2022; Recknagel et al. 2025).
- Weigh enough. Sample intakes of 20–500 mg were used for major elements of NMC and 50–1000 mg for traces (Recknagel et al. 2025).
- Nanoparticle suspensions. For spICP-MS, dilute until individual particles arrive one at a time, and calibrate transport efficiency, usually with gold nanoparticle standards (Gregar et al. 2025).
- Protect reactive powders. NMC 111 takes up CO₂ from air (its carbon content rose from 0.066 to 0.094% in 5 months), which changes the mass fractions, so it is stored under argon (Recknagel et al. 2025).
What ICP-MS tells you about materials
Composition and metal loading. ICP confirms that a synthesis gave the intended stoichiometry or dopant level, as in Pt-doped NiFe metal–organic frameworks whose measured Pt contents matched the nominal loadings (Bekmyrza et al. 2025). The same digest-and-measure approach applies to frameworks such as HKUST-1, ZIF-8 and UiO-66.
Battery materials. Elemental analysis of cathodes is critical for quality, performance and recycling; manufacturers hold Li, Ni, Mn and Co ratios within a narrow margin and limit impurities such as Fe, Na and Cr to the mg kg⁻¹ range, and the first certified reference material for an NMC 111 cathode was characterised mainly by ICP-OES and ICP-MS (Recknagel et al. 2025). See NMC, LiFePO₄ and our overview of battery materials.
Catalyst stability. Metal dissolved into the electrolyte during electrolysis, measured by ICP-MS, gives the stability number (molecules of product per dissolved metal atom) and the activity–stability factor of water-splitting catalysts (Sharma et al. 2026); pair it with cyclic voltammetry and EIS.
Nanoparticles. Single-particle ICP-MS gives element-specific core size, size distribution and particle number concentration, complementing TEM, SEM and DLS (Gregar et al. 2025). In the Pt-doped MOF study, ICP-OES gave the composition while XPS probed the electronic structure of Pt, Ni and Fe (Bekmyrza et al. 2025). All are covered in our guide to characterisation techniques.
Common mistakes and limits
- Spectroscopic interferences. Isobaric isotopes of other elements, doubly charged ions, polyatomic ions and tailing from neighbouring peaks can sit at the analyte's mass (Mazarakioti et al. 2022). Reaction gases such as H₂, O₂, NH₃ or CH₃F in tandem ICP-MS/MS remove many of them (Balcaen et al. 2015).
- Matrix effects. Sample introduction, plasma and space-charge effects suppress or enhance signals, and dissolved salts gradually deposit on the cones and narrow their orifices (Mazarakioti et al. 2022). Use internal standards and matrix-matched or standard-addition calibration.
- Forgetting the dilution. Digestion and dilution raise the method detection limit well above the instrumental one (Provete et al. 2024).
- Losses and memory. Hg can be lost during digestion or stick in the introduction system, and high standards leave a memory effect that needs long rinses (Provete et al. 2024).
- spICP-MS assumptions. Sizes assume a known composition, density and spherical shape; quadrupole instruments see one element at a time; and dissolved ions raise the background, which limits detection of particles below roughly 10 nm; for Ti and Si the smallest detectable particles in biological samples were as large as 48.6 and 350 nm (Gregar et al. 2025).
- Cost. ICP-MS and ICP-OES are expensive instruments that consume large volumes of argon and need sample treatment (Provete et al. 2024).
How to draw the ICP-MS setup and data in LabCanvas
The LabCanvas figure editor Library has the ICP-MS instrument as an editable object, including a cutaway of the nebuliser, plasma torch, sample and skimmer cones and the ion path to the quadrupole and detector, plus an editable data plot for calibration curves, mass spectra or single-particle time traces. Label the element and isotope on each peak, show the digestion step as a small schematic, and export the panel for a methods figure, SI or graphical abstract.
ICP-MS compared with ICP-OES, AAS and XRF
| Technique | What it measures | Sample | Example detection limit / note |
|---|---|---|---|
| ICP-MS | Ions sorted by mass-to-charge ratio; elements and isotopes | Digested solution | Hg 0.0079 µg L⁻¹; ng L⁻¹ for most elements |
| ICP-OES | Light emitted at element spectral lines | Digested solution | Hg 0.54 µg L⁻¹ (cold vapour); used for Li in cathodes |
| AAS | Absorption by free atoms of one element | Digested solution, or solid for direct Hg analysers | Hg 0.11 µg L⁻¹ by thermal decomposition AAS, no digestion |
| XRF | Characteristic X-rays from the solid | Pressed pellet or borate bead | Used for Co, Ni, Mn in NMC; Li not measurable |
Related techniques
X-ray photoelectron spectroscopy (XPS)
XPS explained: binding energy, 2–10 nm surface sensitivity, survey vs high-resolution spectra, chemical shifts, C 1s charge referencing and depth profiling.
Transmission electron microscopy (TEM)
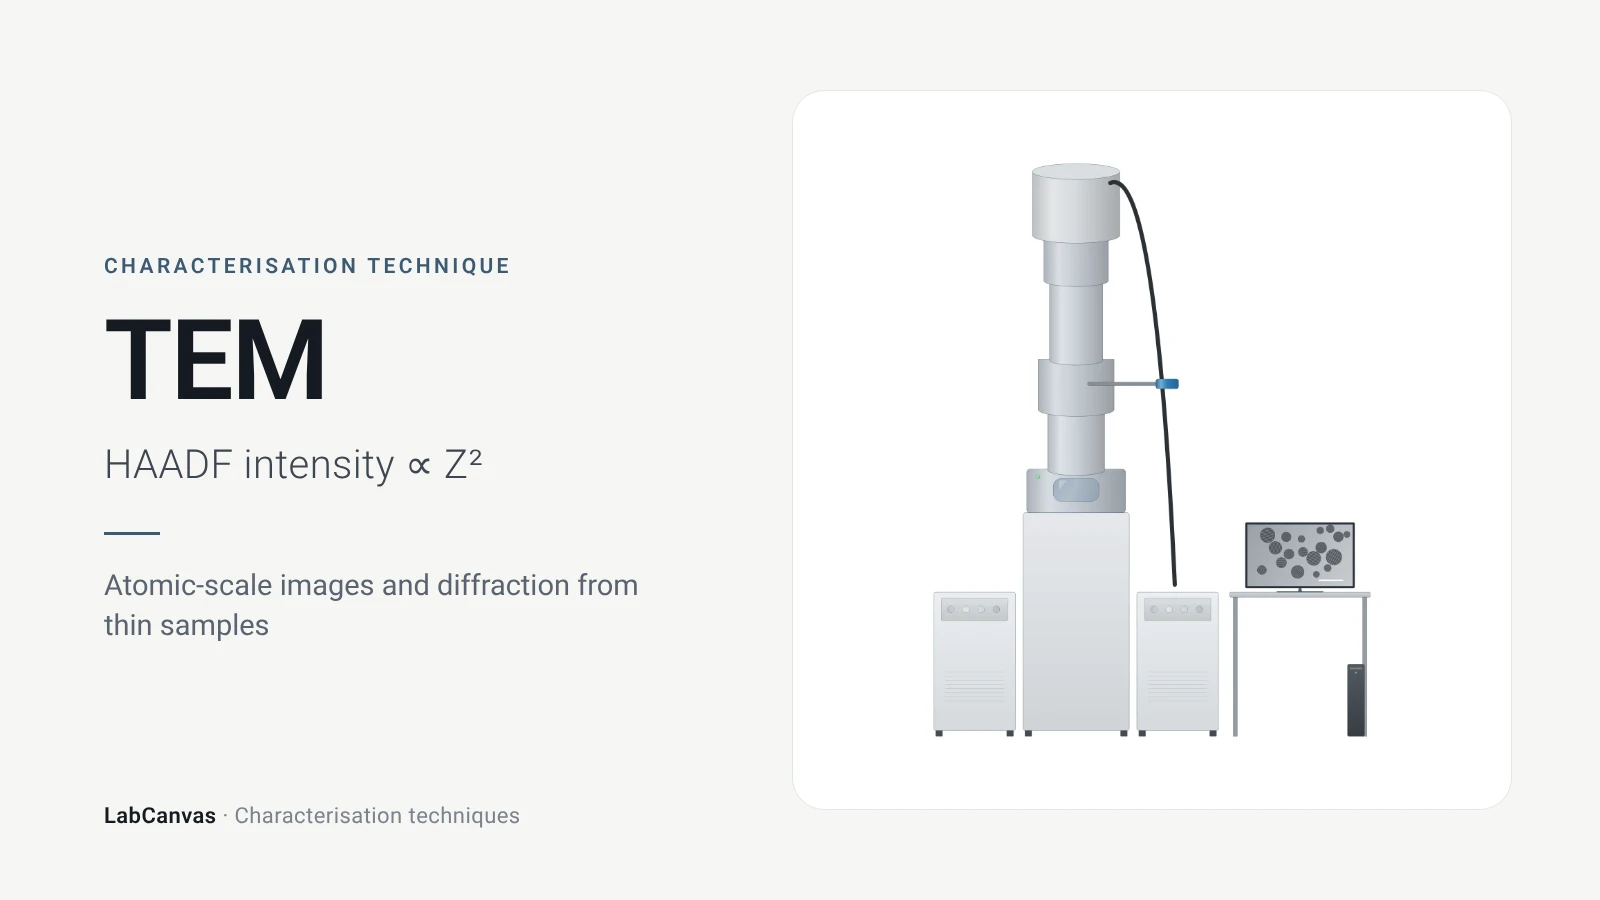
How TEM works: bright field, HRTEM lattice images, SAED diffraction, STEM-HAADF Z-contrast, EDS/EELS, sample thickness and beam damage of MOFs.
Scanning electron microscopy (SEM)
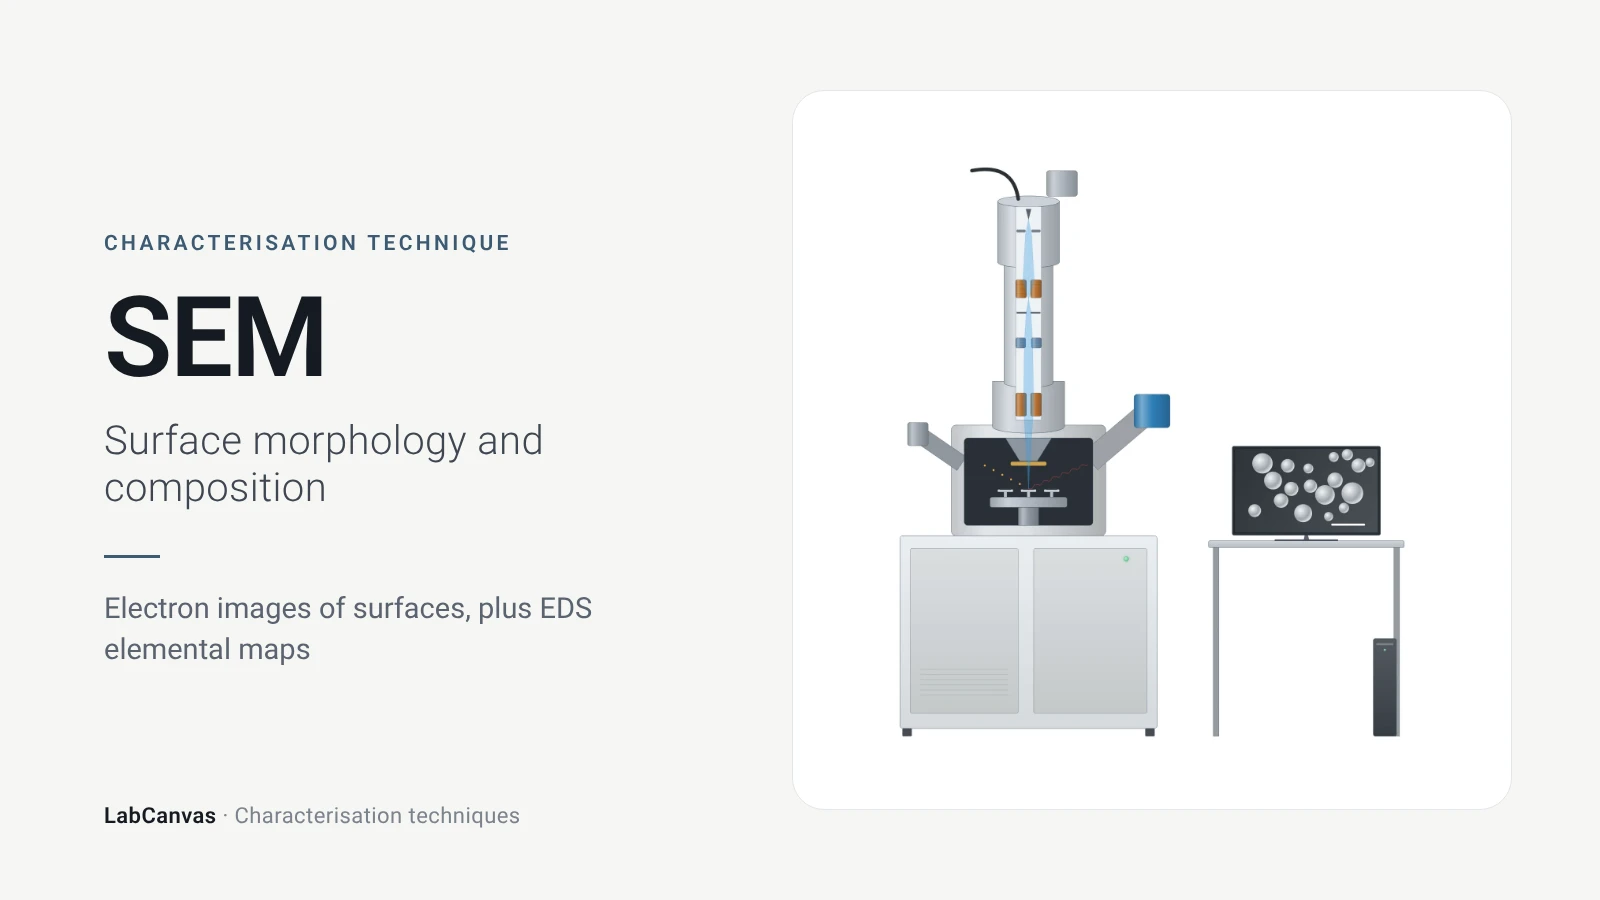
How SEM works: secondary vs backscattered electron images, EDS/EDX elemental analysis, resolution, sample coating, low-vacuum mode and common mistakes.
DLS and zeta potential
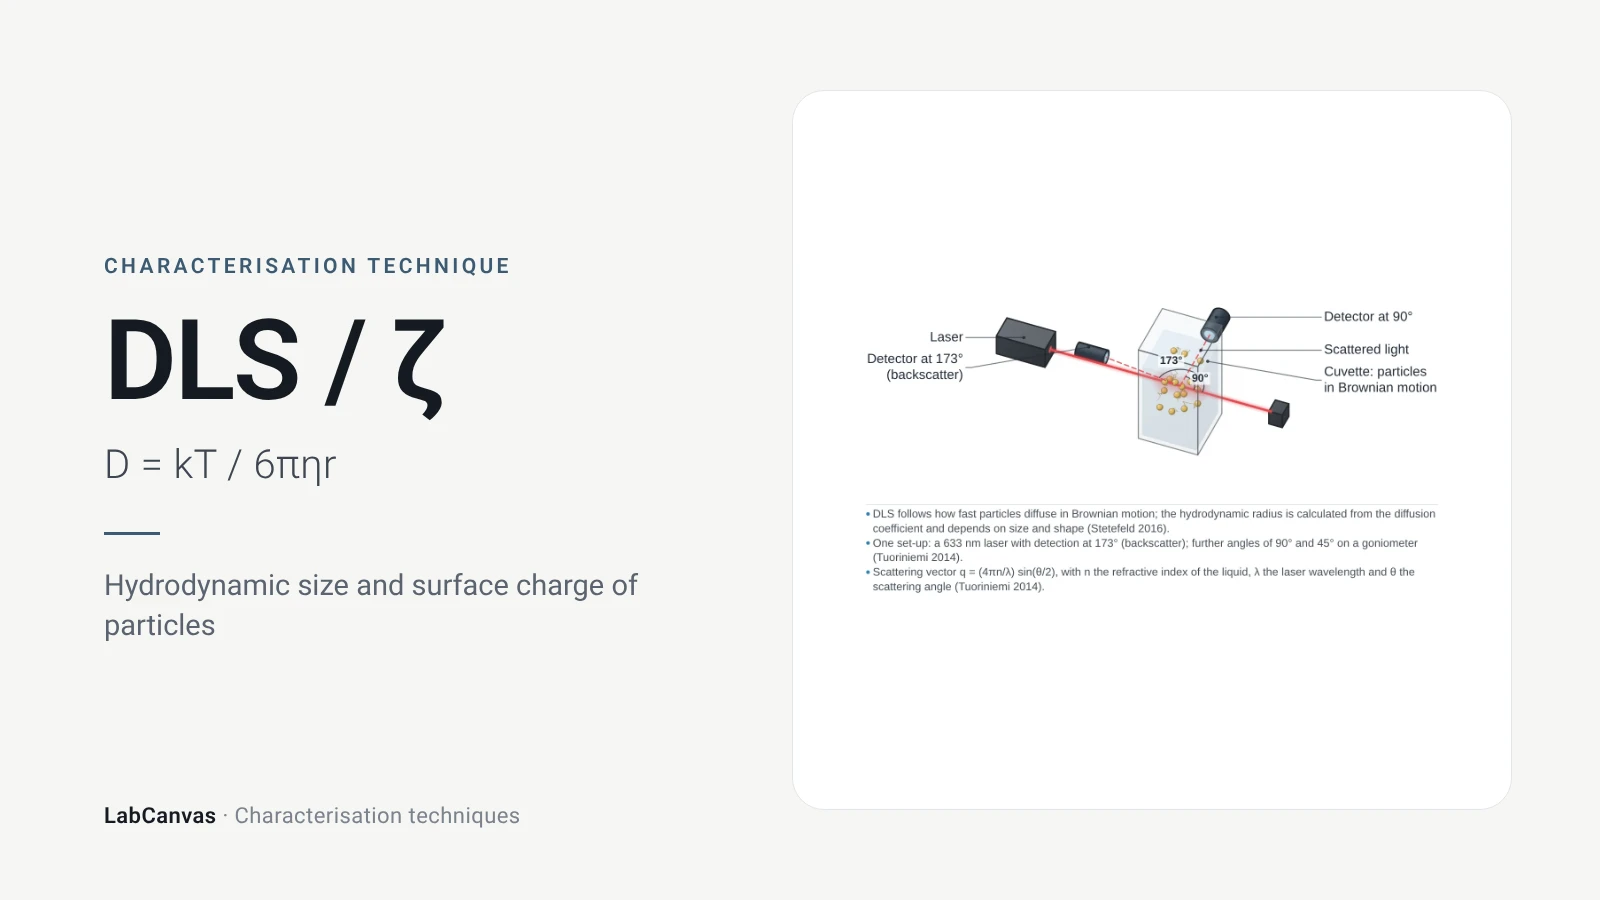
DLS and zeta potential explained: Brownian motion, Stokes–Einstein hydrodynamic size, intensity vs number distributions, PDI and colloidal stability.
Cyclic voltammetry (CV)
Cyclic voltammetry explained: three-electrode cell, scan rate, redox peaks, 59/n mV reversibility, Randles–Ševčík, RHE conversion, ECSA and Tafel pitfalls.
More on LabCanvas
- All characterisation techniques: XRD, XPS, BET, SEM, TEM, NMR, FTIR, Raman and more, explained with cited sources
- Graphical abstract sizes and templates: ACS, Wiley, Angewandte, RSC, Elsevier and Cell Press, with templates at the right size
- Materials explained: MOFs, COFs, 2D materials, perovskites, batteries and zeolites, with cited facts
- Journal figure size guide: Column widths and resolutions for 38 journals
Frequently asked questions
What is ICP-MS used for?
ICP-MS determines which elements a sample contains, their concentrations down to ng L⁻¹ and their isotope ratios, for more than 65 elements (Mazarakioti et al. 2022). In materials chemistry it checks metal loadings, stoichiometry, impurities and leached metal (Bekmyrza et al. 2025; Sharma et al. 2026).
ICP-MS vs ICP-OES: what is the difference?
Both atomise and excite the sample in an argon plasma, but ICP-MS counts the ions by mass-to-charge ratio while ICP-OES measures light emitted at element spectral lines (Mazarakioti et al. 2022; Provete et al. 2024). ICP-OES is normally less sensitive: for Hg the detection limits were 0.0079 µg L⁻¹ by ICP-MS and 0.54 µg L⁻¹ by cold-vapour ICP-OES (Provete et al. 2024).
What is the detection limit of ICP-MS?
In the ng L⁻¹ (parts per trillion) range for most elements in solution (Mazarakioti et al. 2022). The limit for a solid is higher because digestion dilutes the sample, for example 100-fold for sediments (Provete et al. 2024).
How do you digest a sample for ICP analysis?
Solids are dissolved by thermally assisted acid digestion, commonly concentrated HNO₃ in a microwave oven or mixtures with H₂O₂, HCl or HF (Mazarakioti et al. 2022). Metal oxides and MOFs are often dissolved in aqua regia (Recknagel et al. 2025; Bekmyrza et al. 2025).
What is single-particle ICP-MS?
A mode in which a very dilute nanoparticle suspension is introduced so each particle gives a separate ion pulse: pulse intensity gives particle mass and size and pulse frequency gives number concentration (Gregar et al. 2025). It assumes known composition, density and spherical shape.
What interferences affect ICP-MS?
Spectroscopic interferences from isobaric isotopes, doubly charged ions and polyatomic ions at the analyte mass, and non-spectroscopic matrix effects that suppress or enhance the signal (Mazarakioti et al. 2022). Collision or reaction gases in ICP-MS/MS remove many spectral overlaps (Balcaen et al. 2015).
How do you measure the metal content of a MOF or catalyst?
Digest a weighed sample completely, for example in aqua regia, dilute it and measure by ICP-OES or ICP-MS against calibration standards; this confirmed Pt loadings of 0.52–2.08 wt% in Pt-doped NiFe MOFs (Bekmyrza et al. 2025).
Can ICP-MS measure isotope ratios?
Yes. ICP-MS measures isotopic abundances as well as concentrations (Mazarakioti et al. 2022); a multicollector ICP-MS measured a lithium isotope ratio of 12.34 in an NMC cathode reference material (Recknagel et al. 2025).
References
- E. C. Mazarakioti, A. Zotos, A.-A. Thomatou, A. Kontogeorgos, A. Patakas, A. Ladavos. Inductively coupled plasma-mass spectrometry (ICP-MS), a useful tool in authenticity of agricultural products’ and foods’ origin. Foods 2022, 11, 3705. doi:10.3390/foods11223705
- C. S. Provete, B. M. Dalfior, R. Mantovaneli, M. T. W. D. Carneiro, G. P. Brandão. Comparison of the performance of ICP-MS, CV-ICP-OES, and TDA AAS in determining mercury in marine sediment samples. ACS Omega 2024, 9, 49229–49238. doi:10.1021/acsomega.4c06144
- F. Gregar, D. Baron, T. Pluháček. Advances in ICP-MS-based nanoparticle characterization: techniques and challenges in biological sample analysis. J. Sep. Sci. 2025, 48, e70259. doi:10.1002/jssc.70259
- S. Recknagel, S. Richter, M. Hoppe, A. Meckelburg, C. Prinz, J. Roik, C. Abad. Powering precision: development of a certified reference material for elemental composition analysis of lithium nickel manganese cobalt oxide (Li-NMC) cathode material for lithium-ion batteries. Anal. Bioanal. Chem. 2025, 417, 2643–2653. doi:10.1007/s00216-025-05766-7
- K. Zh. Bekmyrza, K. A. Kuterbekov, A. M. Kabyshev, M. M. Kubenova, A. A. Baratova, N. Aidarbekov, M. D. Chaka, N. E. Benti. High-performance hydrogen energy generation via innovative metal-organic framework catalysts and integrated system design. Sci. Rep. 2025, 15, 28418. doi:10.1038/s41598-025-08306-6
- M. Sharma, C. Prakash, V. K. Singh, A. Dixit. A tutorial on measurement of electrochemical water-splitting performance parameters: methods and best practices. ACS Meas. Sci. Au 2026, 6, 1445–1470. doi:10.1021/acsmeasuresciau.6c00147
- L. Balcaen, E. Bolea-Fernandez, M. Resano, F. Vanhaecke. Inductively coupled plasma – tandem mass spectrometry (ICP-MS/MS): a powerful and universal tool for the interference-free determination of (ultra)trace elements – a tutorial review. Anal. Chim. Acta 2015, 894, 7–19. doi:10.1016/j.aca.2015.08.053
Draw ICP-MS and ICP-OES figures for your paper
LabCanvas is a browser workspace for scientific figures: instruments with their beam and light paths, editable data plots, crystal structures, graphs and graphical abstracts at journal sizes.
Draw ICP-MS and ICP-OES in LabCanvas