Scanning electron microscopy (SEM): how it works, SE vs BSE images and EDS
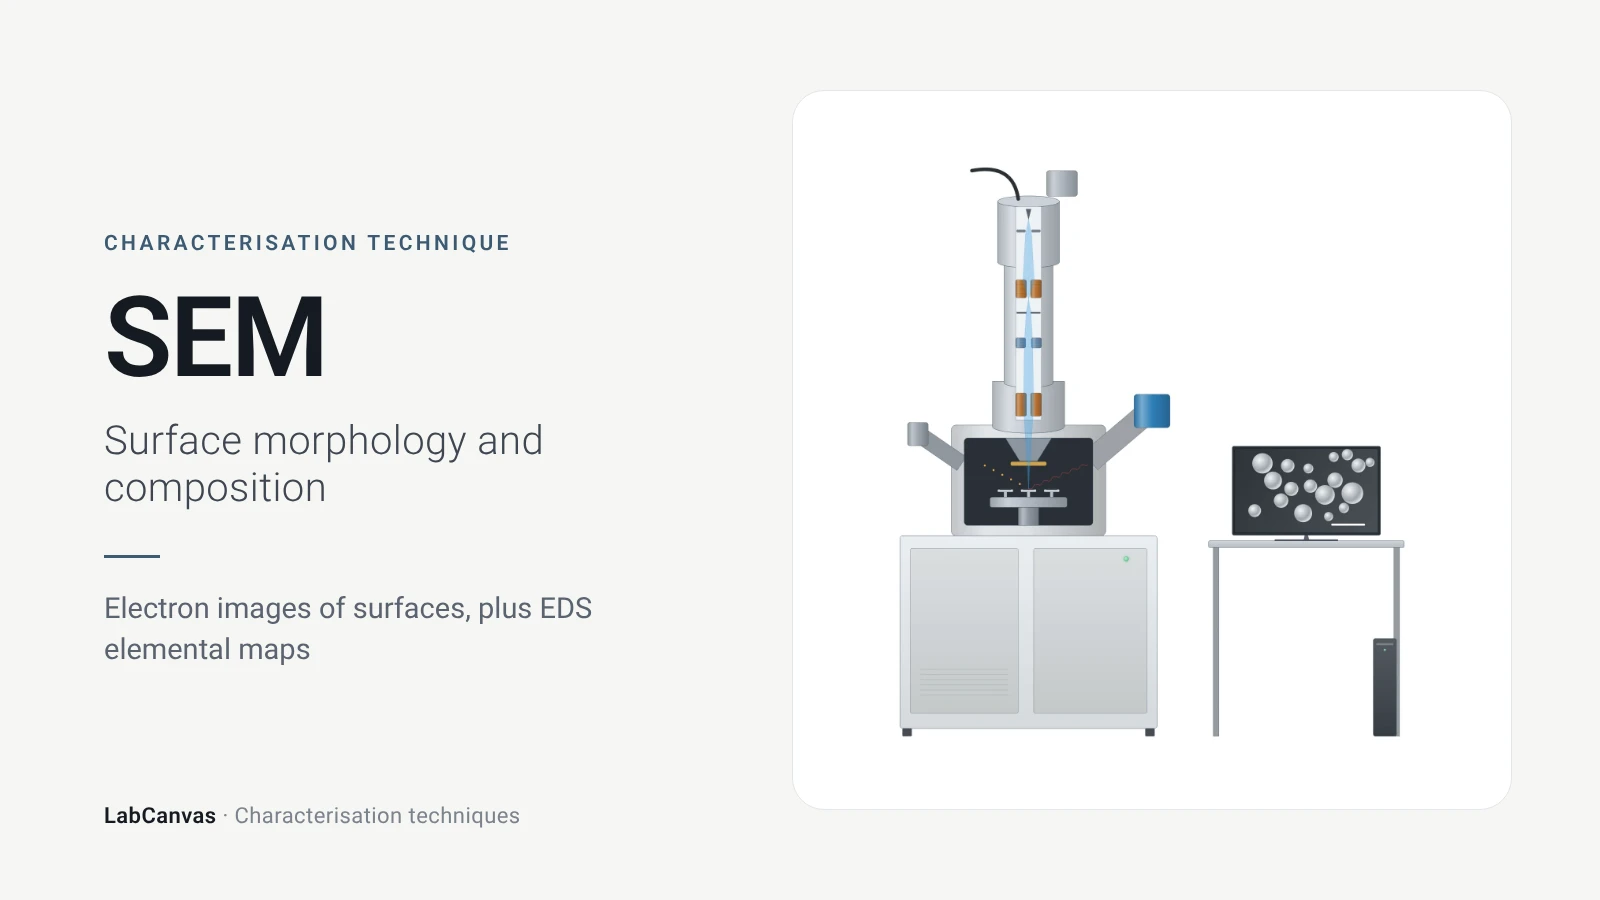
Scanning electron microscopy (SEM) images the surface of a solid by scanning a focused electron beam across it and collecting the signals the beam generates: secondary electrons show topography, backscattered electrons show contrast between elements of different atomic number, and X-rays identify the elements present (Erlich et al. 2020). It is the standard tool for particle size, shape and morphology, with nanometre-scale resolution (Joo et al. 2025; Bijelić et al. 2023). With an energy-dispersive X-ray (EDS) detector it also maps composition, detecting every element except H and He (Newbury & Ritchie 2015).
Contents
Scanning electron microscopy (SEM) at a glance
| Probe | Focused electron beam scanned over the specimen (Erlich et al. 2020) |
|---|---|
| Signals measured | Secondary electrons (topography), backscattered electrons (atomic-number contrast) and characteristic X-rays (elements) (Erlich et al. 2020) |
| Main information | Surface morphology, particle size and shape; composition with EDS (Joo et al. 2025) |
| BSE contrast | Backscattered signal depends on the atomic number of the target and the beam energy (Rau & Zaitsev 2025) |
| Lateral resolution | Nanometre scale; only limited height information, unlike AFM (Joo et al. 2025) |
| Information depth | Set by the accelerating voltage: beam energy controls the depth of the interaction volume (Bijelić et al. 2023; Bromley et al. 2026) |
| Environment | Vacuum chamber; low-vacuum mode neutralises charge on non-conductive specimens with positive gas ions (Sawaguchi 2026) |
| Typical sample | Dry, vacuum-stable solid on a conductive mount; insulators coated with a thin conductor (Belz & Auchterlonie 1995) |
| EDS element range | All elements except H and He (Newbury & Ritchie 2015) |
| EDS detection limit | Below 0.001 mass fraction (1000 ppm) in about 500 s with a silicon drift detector, under careful conditions (Newbury & Ritchie 2015) |
| EDS accuracy | Standardless analysis: about ±30% relative needed to capture 95% of results; standards-based analysis of flat polished samples: a few % (Newbury & Ritchie 2015) |
| 3D variant | FIB-SEM: an ion beam mills slices with nanometre precision for 3D reconstruction (Faber et al. 2024) |
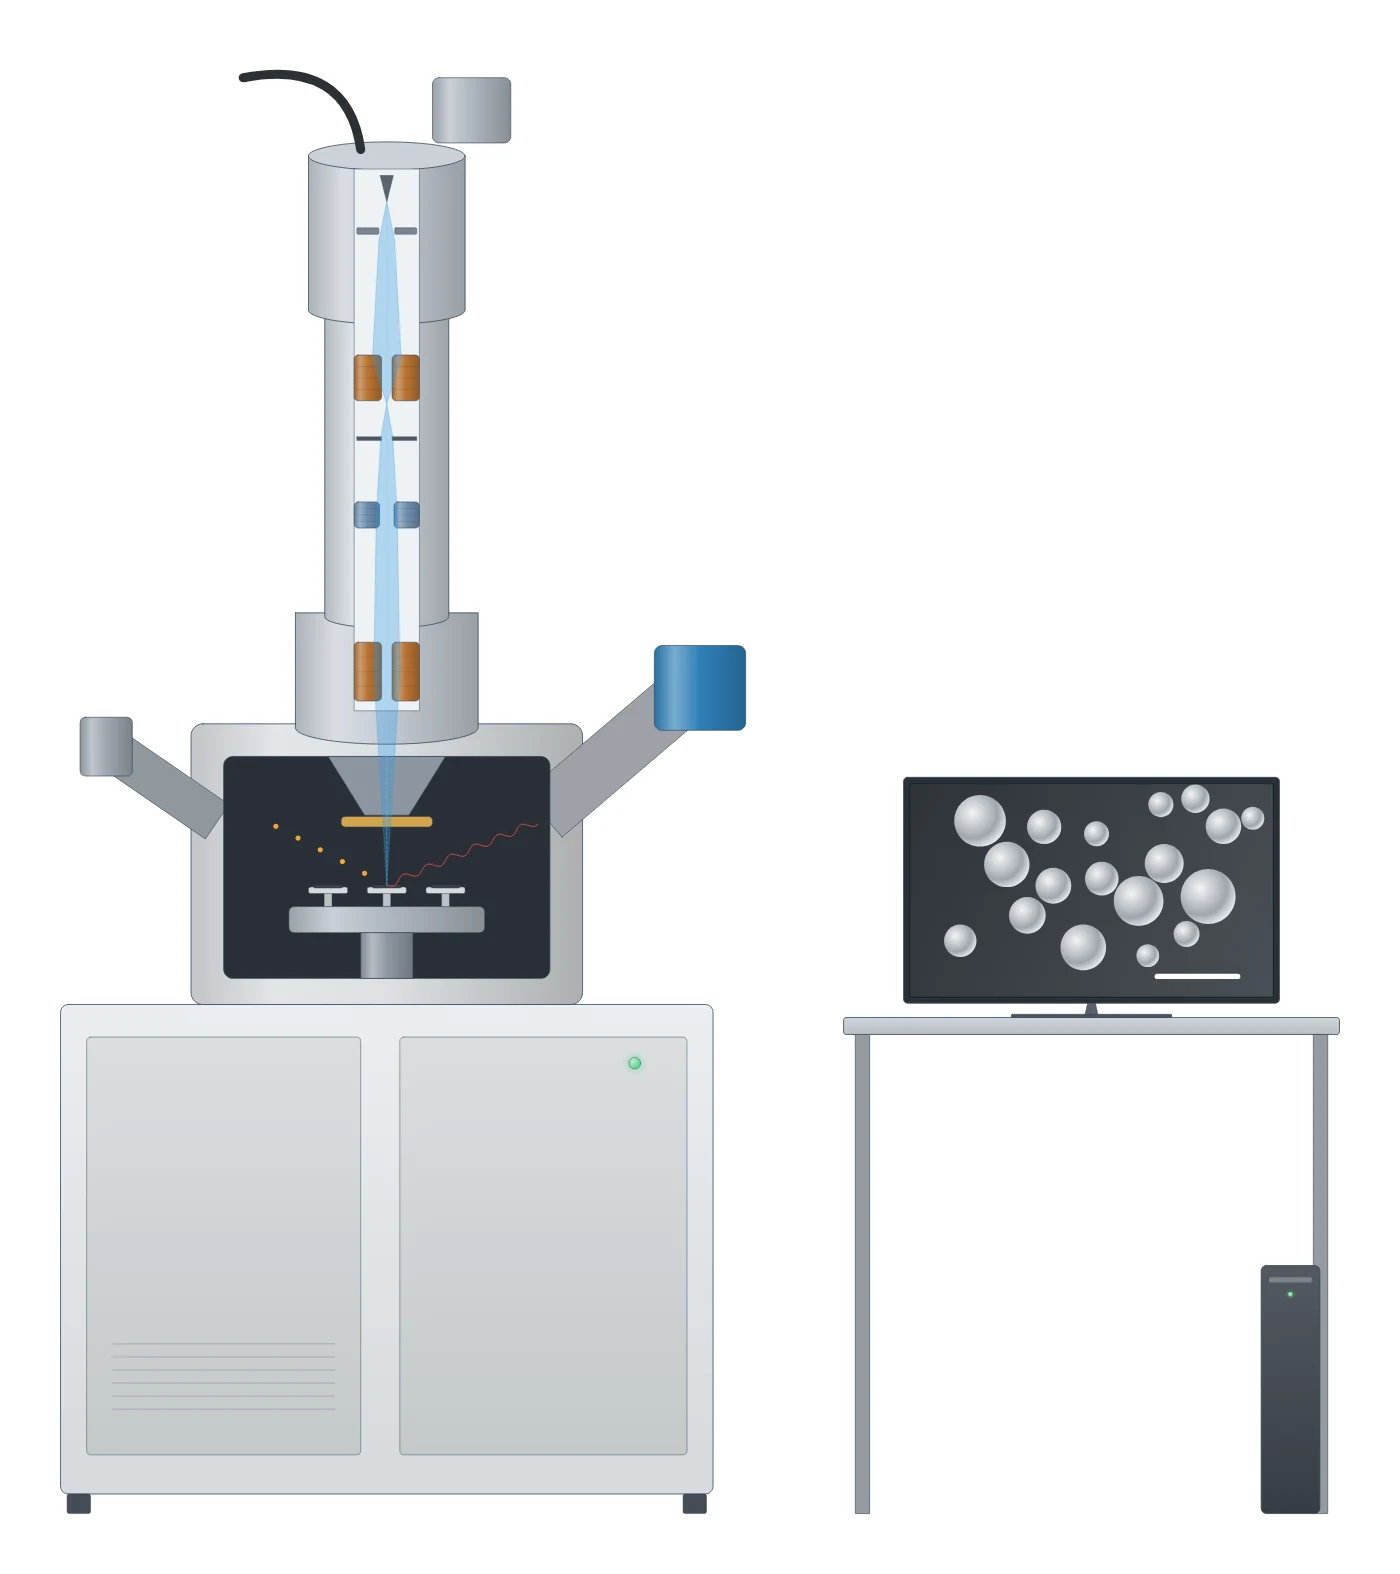
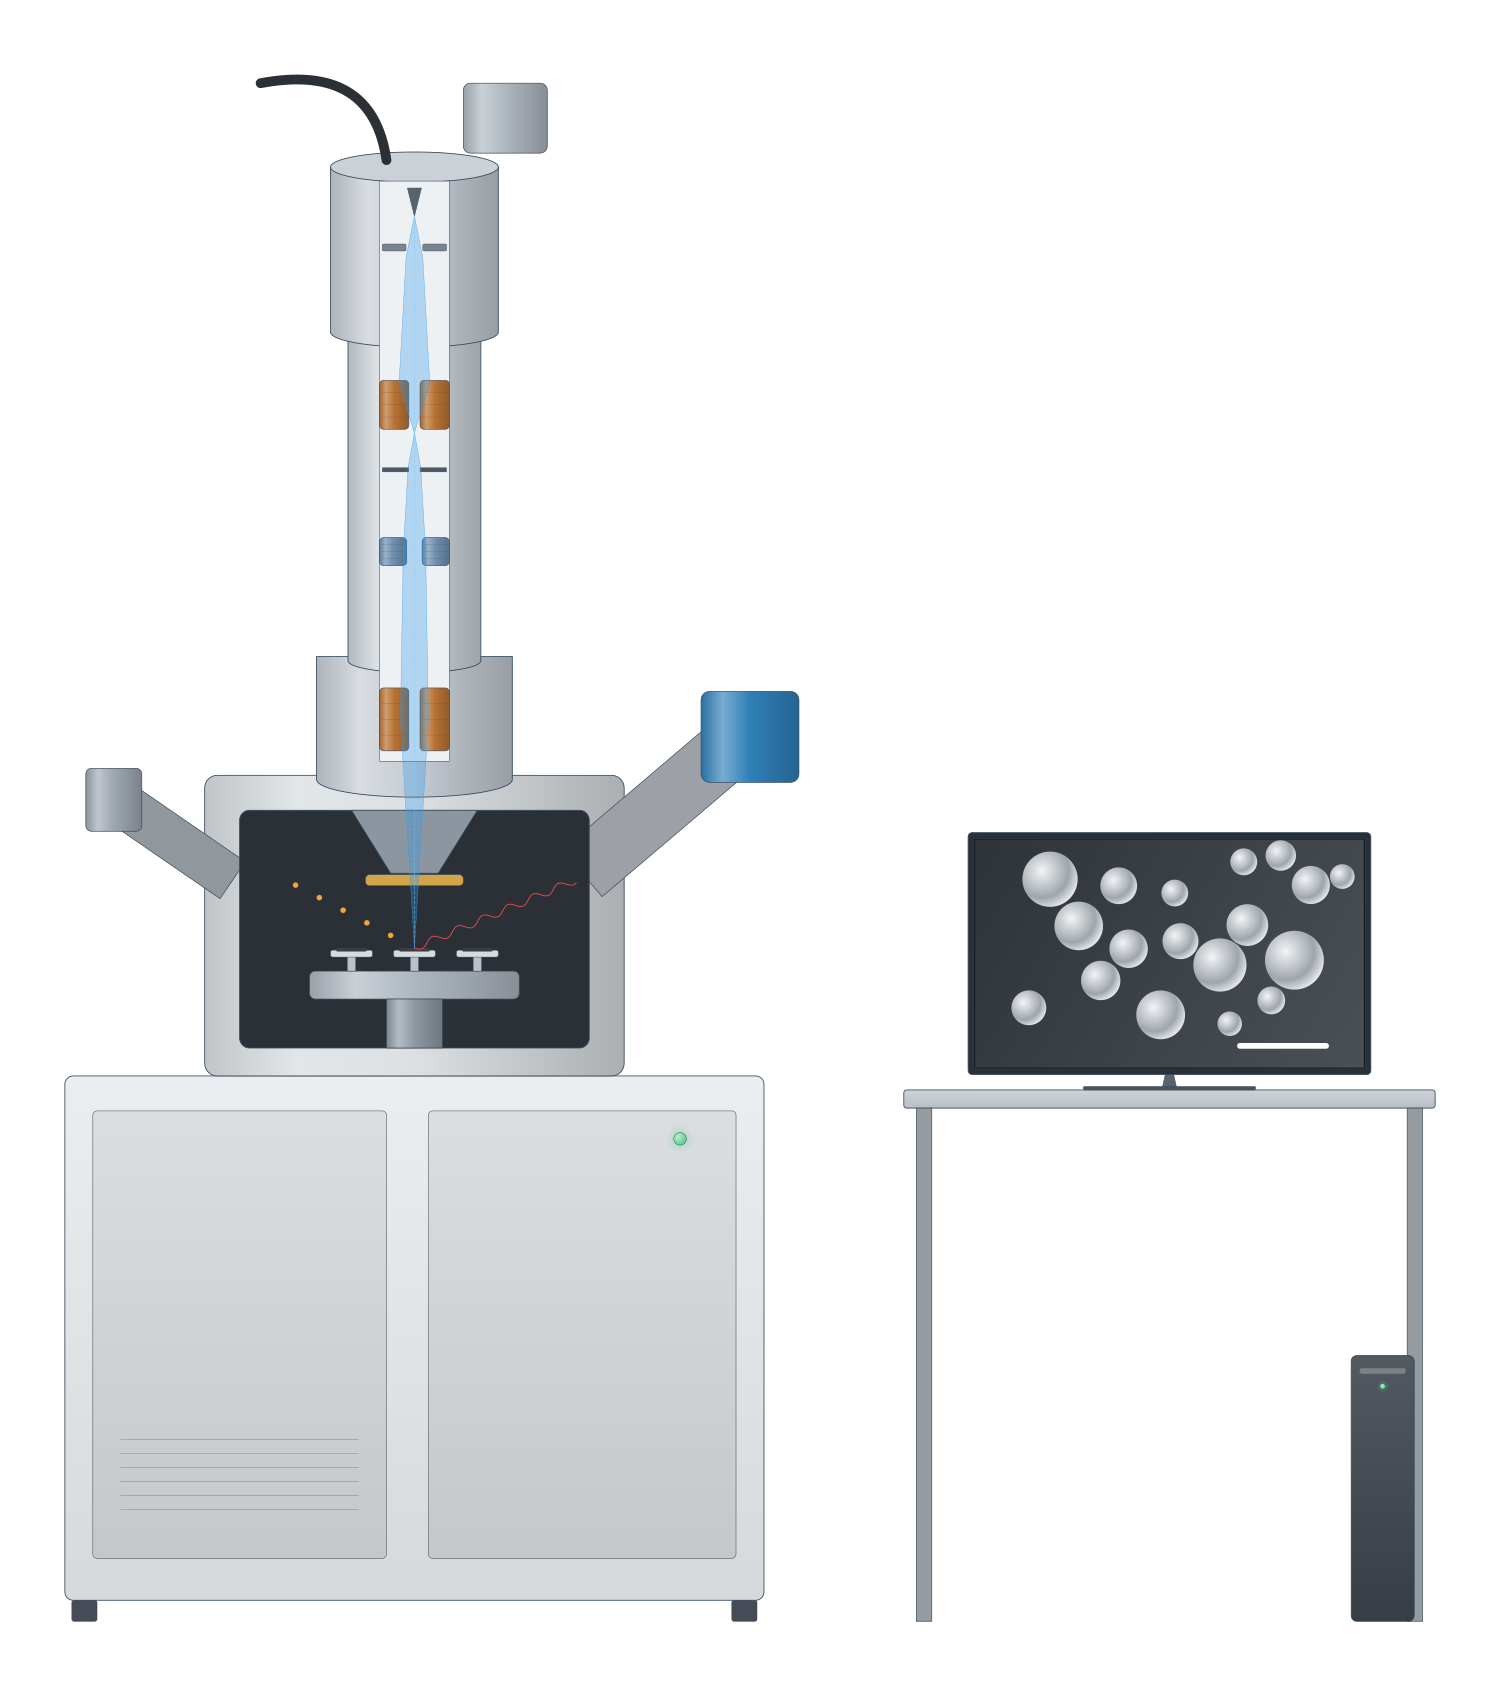
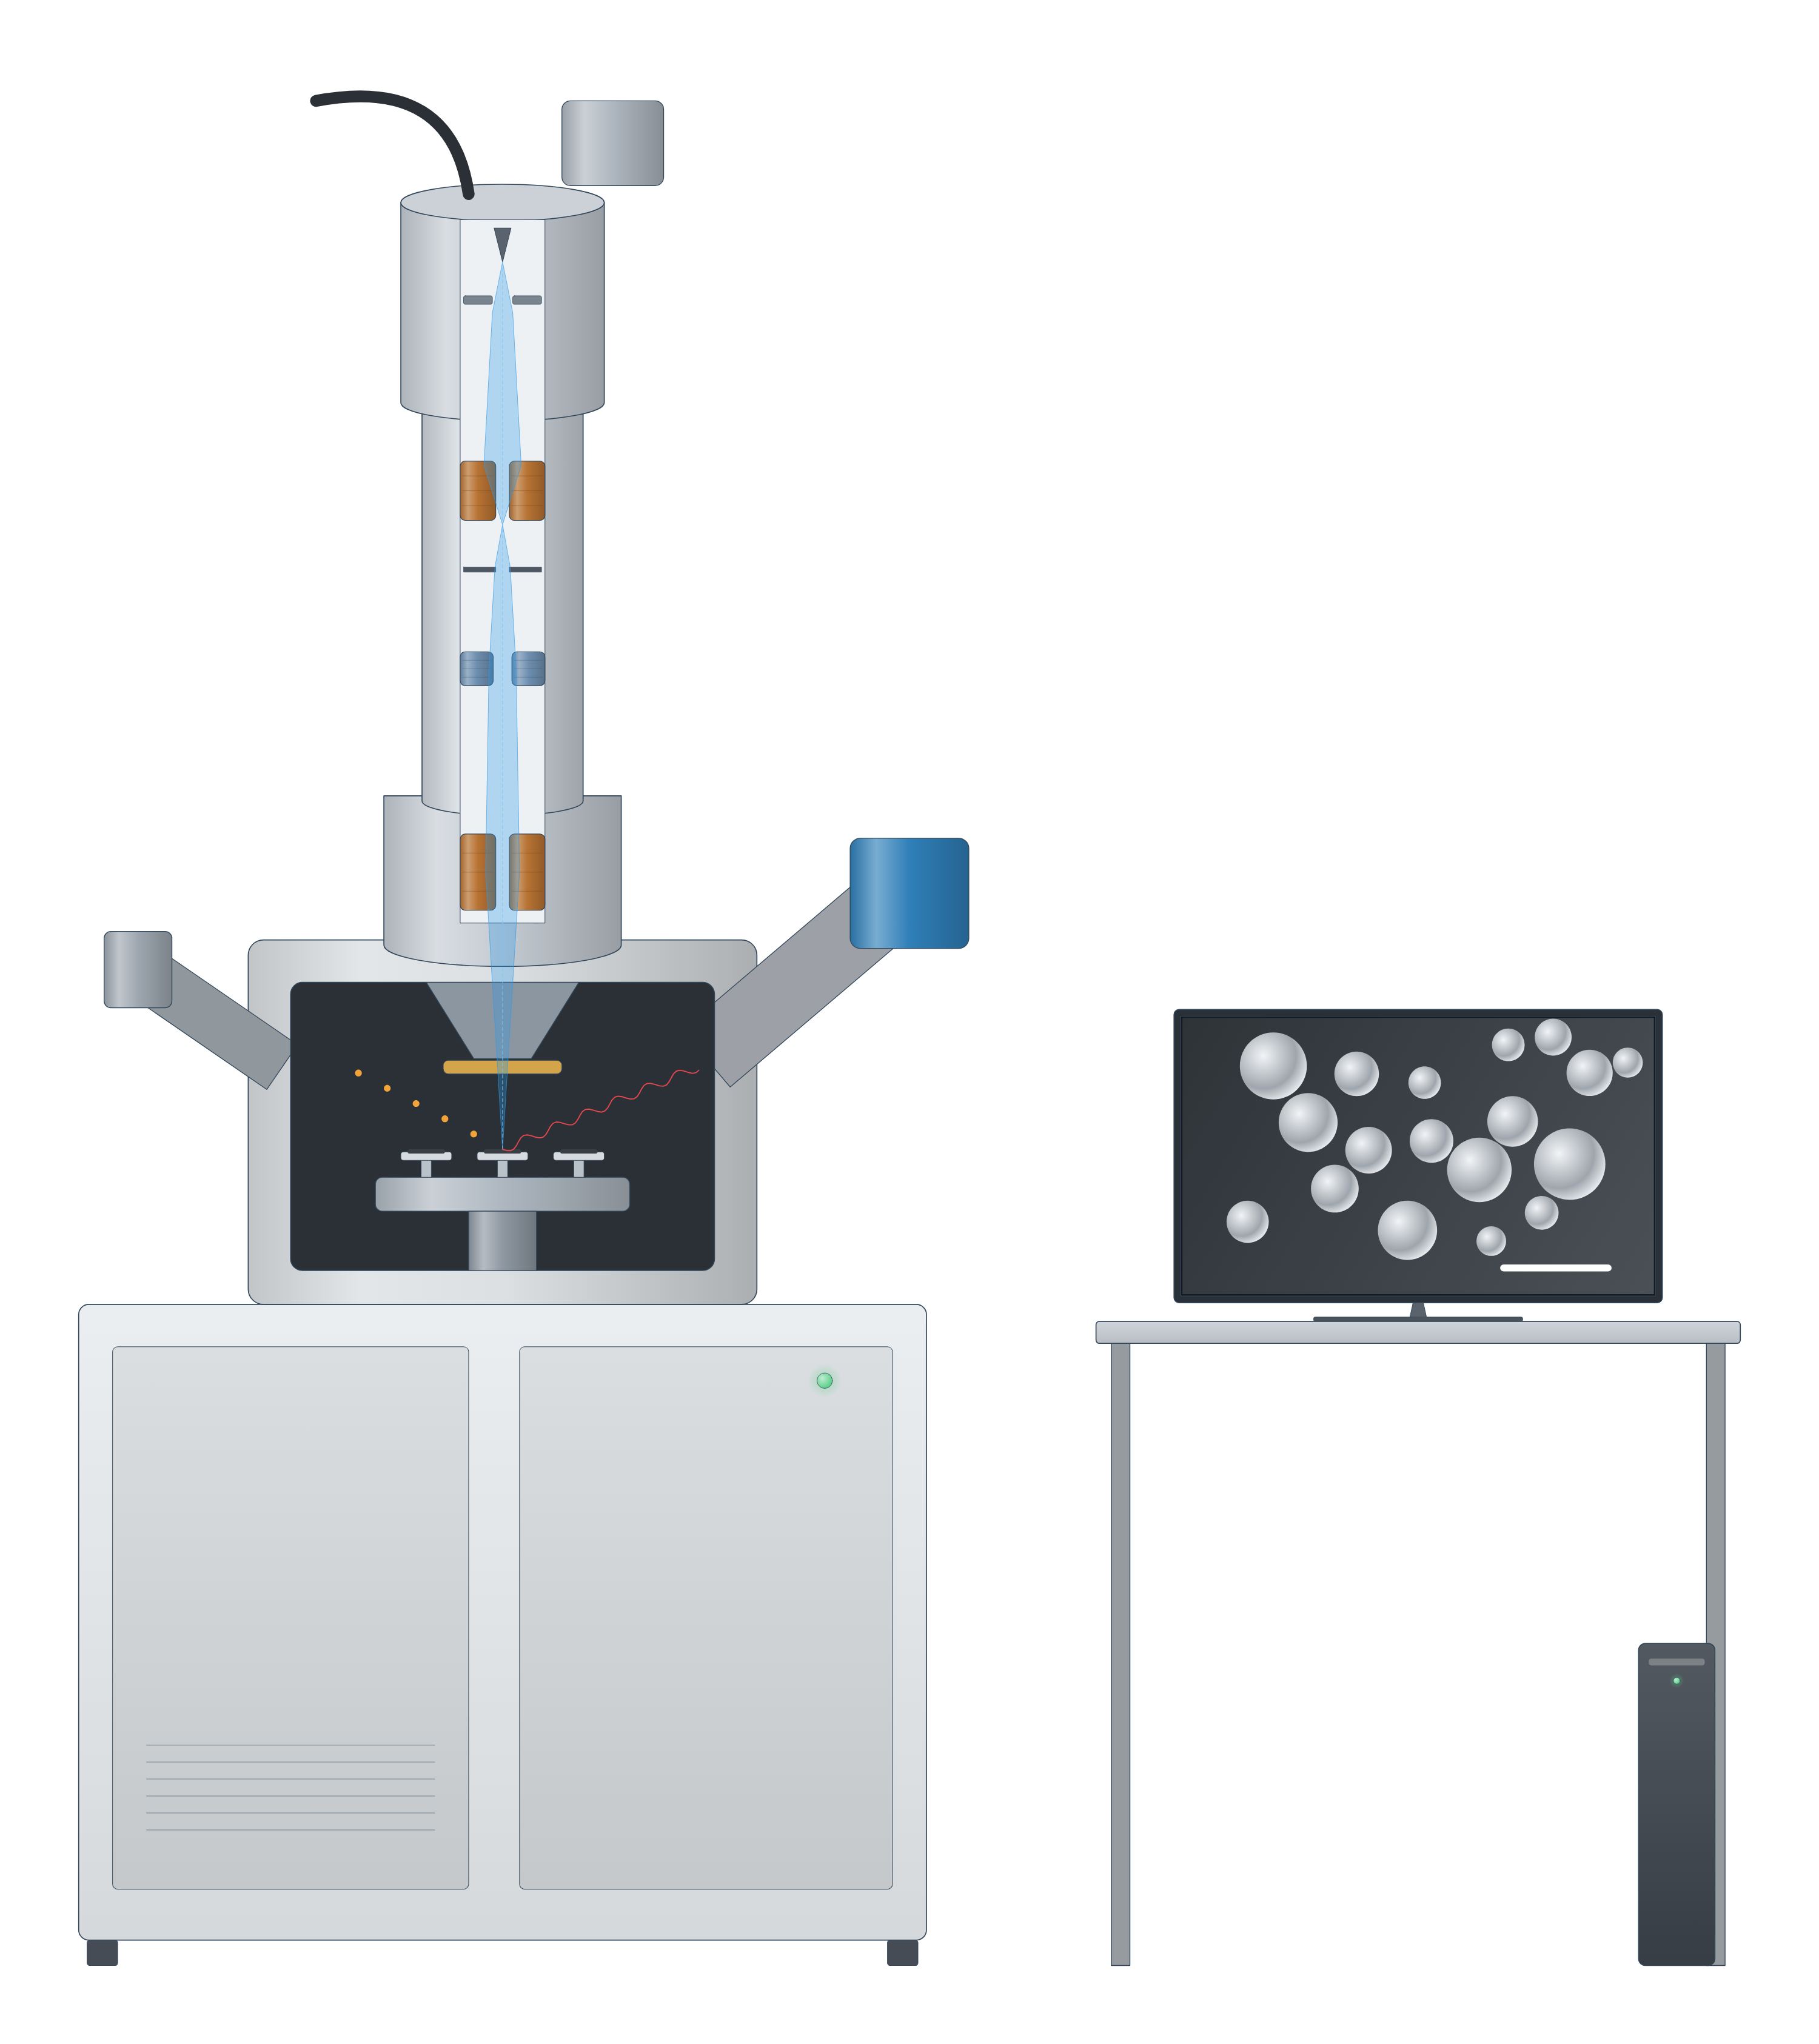
Scanning electron microscopy (SEM) instrument drawing (high-resolution SVG)
Scanning electron microscopy (SEM) data: an example plot to edit
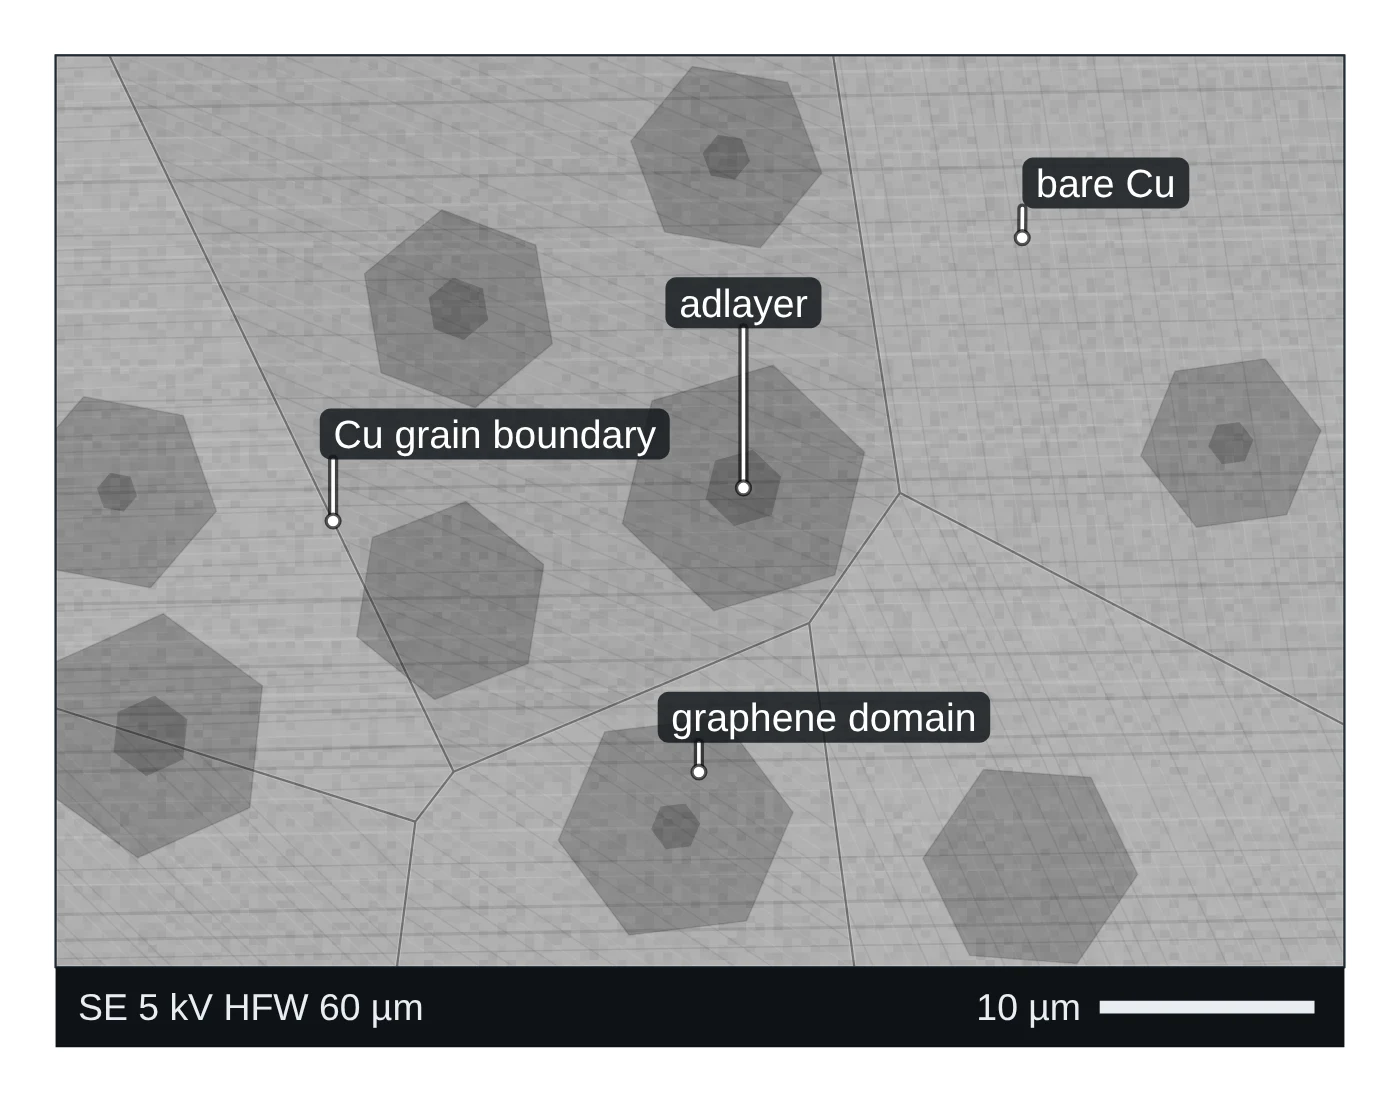
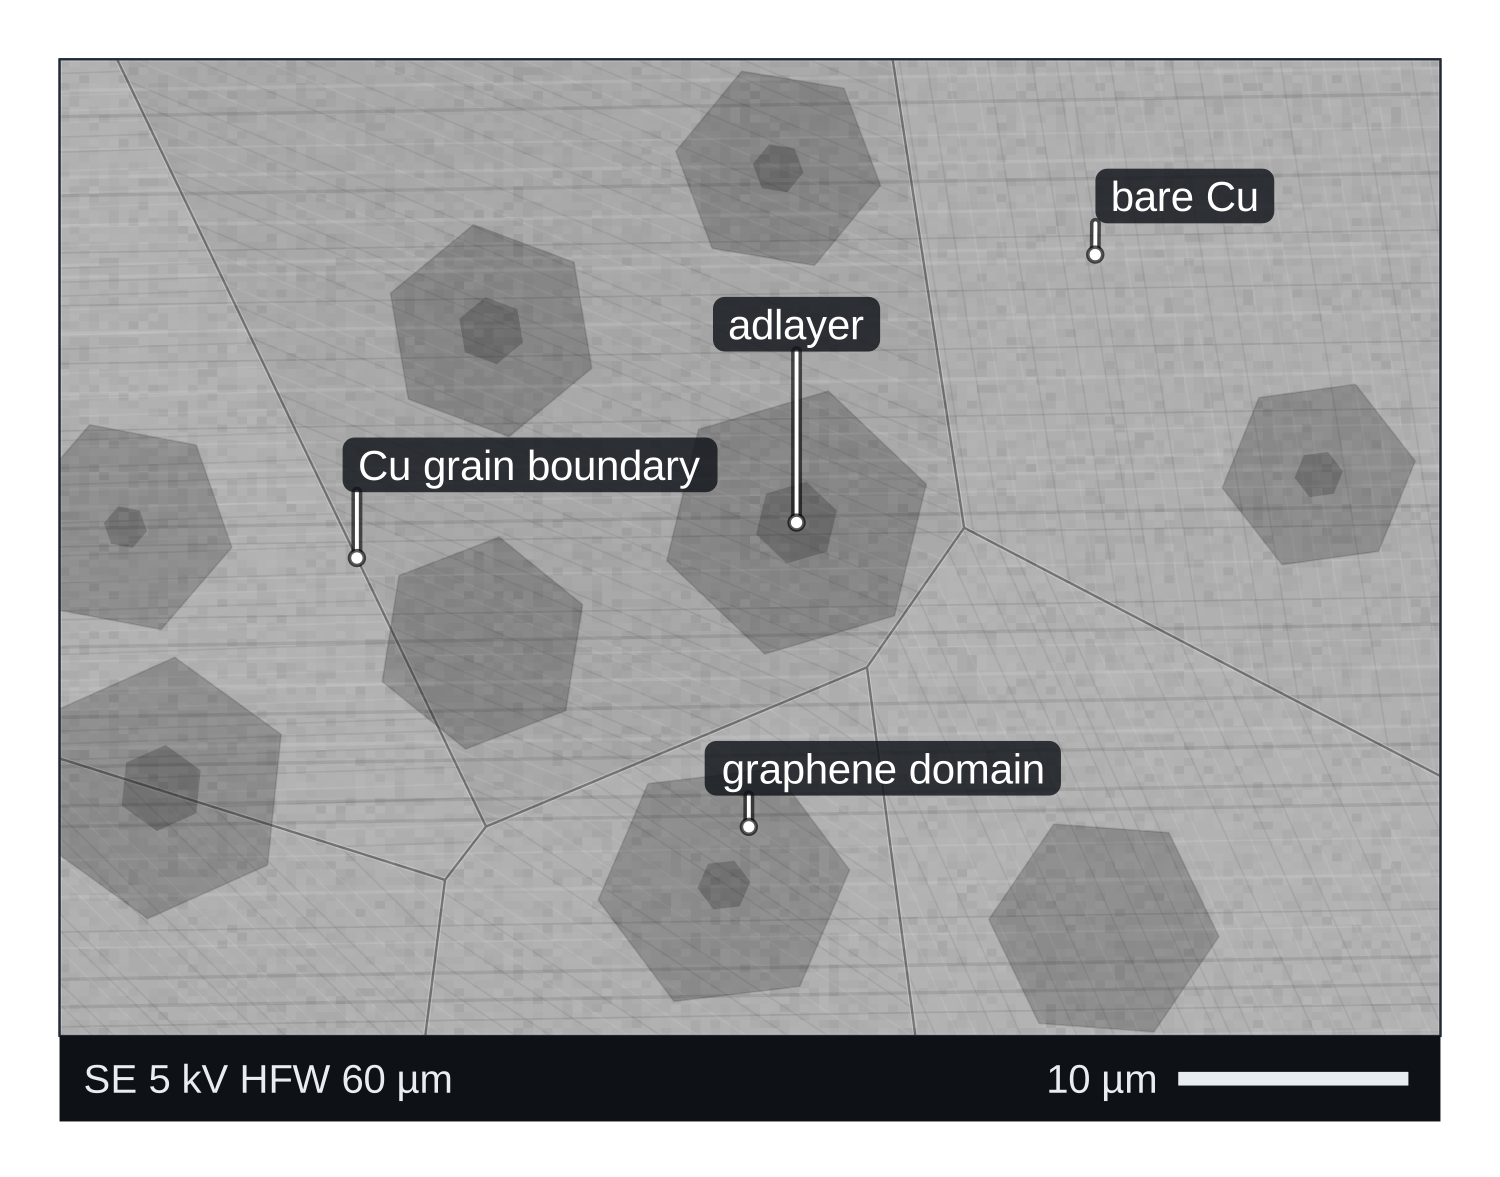
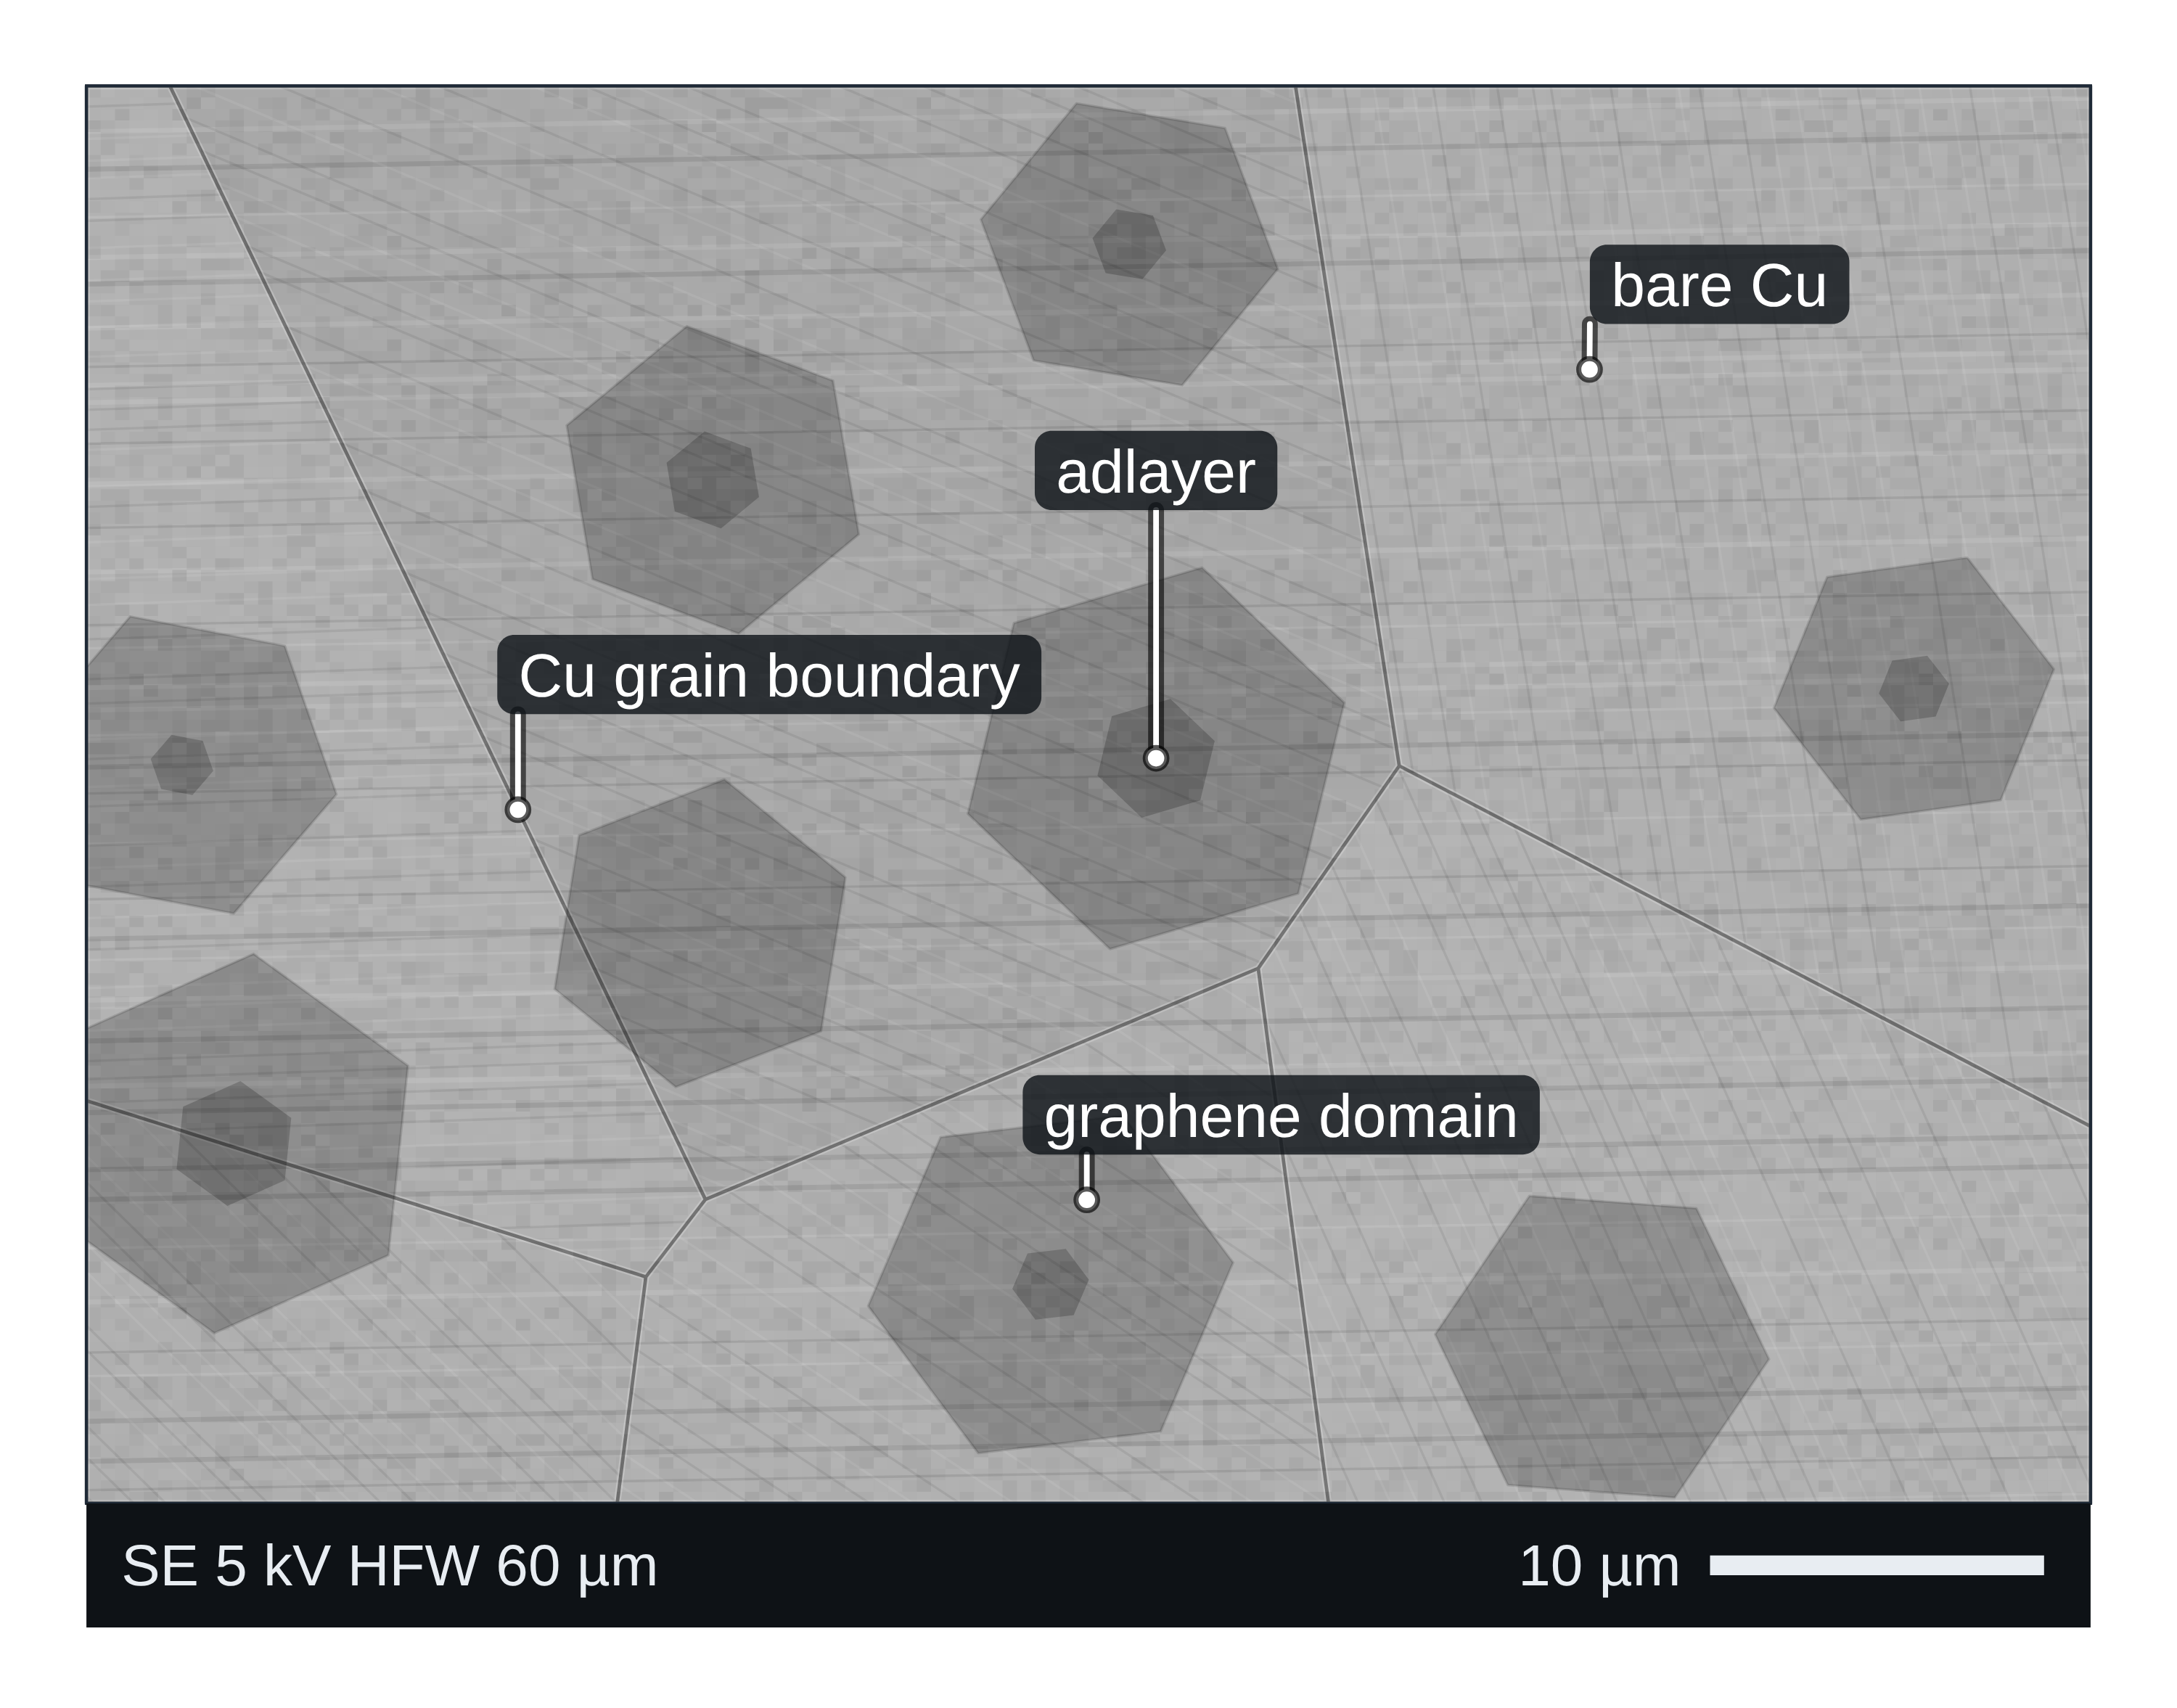
How SEM works
An SEM focuses a beam of electrons into a small spot and scans it line by line over the specimen. At each point the beam generates several signals, and a detector turns one of them into the brightness of the corresponding pixel (Erlich et al. 2020):
- Secondary electrons (SE) come from the surface and give topographic information: edges, steps and pores (Erlich et al. 2020). How much of the surface they report depends on the accelerating voltage (Bijelić et al. 2023).
- Backscattered electrons (BSE) are beam electrons scattered back out of the sample. Their yield depends on the atomic number of the material and on the beam energy, so heavier phases look brighter (Rau & Zaitsev 2025; Erlich et al. 2020).
- Characteristic X-rays identify the elements under the beam; an energy-dispersive spectrometer (EDS or EDX) records the whole spectrum at once and detects every element except H and He (Newbury & Ritchie 2015).
Raising the beam energy drives electrons deeper into the sample and changes both the depth that is sampled and the image contrast (Bromley et al. 2026). For the inside of nanoparticles, or for atomic structure, you need transmission electron microscopy (TEM) instead (Bijelić et al. 2023).
What the data looks like and how to read it
SE images carry the surface topography (Erlich et al. 2020): use them to judge particle shape, size and morphology. Read the scale bar, and for a size distribution count many non-overlapping particles from several regions rather than one field of view (Bijelić et al. 2023).
BSE images are composition maps in shades of grey: brighter regions contain heavier elements on average (Erlich et al. 2020). In a polymer blend, for example, BSE atomic-number contrast is enough to show which phase is dispersed and which is continuous (Zhao et al. 2022).
EDS spectra show peaks at the characteristic X-ray energies of each element on a continuous background. An EDS map shows where each element sits. Check every automatically labelled peak by hand: commercial software occasionally misidentifies even major peaks, and overlapping peaks (as in PbS, MoS₂ or BaTiO₃) need peak fitting (Newbury & Ritchie 2015).
Sample preparation
- Conductivity. Insulating samples charge under the beam. Coat them with a thin conductive layer (carbon, Au, Pt or Cr); coatings that are too thick hide fine surface detail (Belz & Auchterlonie 1995).
- Low-vacuum SEM. If you cannot coat, a low-vacuum (variable-pressure or environmental) SEM lets positive ions in the residual gas neutralise the negative charge that builds up on non-conductive samples (Sawaguchi 2026).
- For quantitative EDS the ideal specimen is flat and highly polished, with a carbon coat under 10 nm thick. Rough surfaces, fracture faces and loose particles change the X-ray intensities and can shift apparent concentrations a great deal (Newbury & Ritchie 2015).
- Cross-sections and 3D. A focused ion beam (FIB) in a dual-beam SEM mills away material with nanometre precision to expose subsurface structure or build 3D volumes slice by slice (Faber et al. 2024).
What SEM tells you about materials
- MOFs and COFs: crystal size and shape of ZIF-8, HKUST-1 or UiO-66 powders. Pair the images with XRD for phase and BET for porosity.
- 2D materials: large-area coverage, wrinkles and folds. In CVD graphene on a Cu/Ni(111) foil, SEM showed folds 10–300 nm wide separated by roughly 20 µm (Huang et al. 2018); AFM gives their height.
- Battery materials: particle morphology in NMC or LiFePO₄ electrodes, and element distribution by EDS (see the battery materials hub).
- Composites and multiphase solids: BSE shows phases by atomic number (Zhao et al. 2022), and EDS maps show which elements are where (Newbury & Ritchie 2015).
For surface chemistry and oxidation states, use XPS; for bulk elemental composition at trace level, ICP-MS. All of these are compared on the characterisation techniques page.
Common mistakes and limits
- Charging artefacts (bright streaks, drifting images) on uncoated insulators; coat thinly or use low vacuum (Belz & Auchterlonie 1995; Sawaguchi 2026).
- Over-thick coatings that hide the fine structure you want to see (Belz & Auchterlonie 1995).
- Treating standardless EDS as exact. Standardless results are normalised to 100%, and about ±30% relative error is needed to capture 95% of results; by the authors’ informal survey probably more than 98% of reported quantitative EDS results are standardless (Newbury & Ritchie 2015).
- Quantifying EDS on rough particles. Shape and surface tilt alter X-ray absorption paths, so apparent Mg and Fe concentrations in one homogeneous glass spanned almost an order of magnitude on irregular specimens (Newbury & Ritchie 2015).
- Reading height from SEM. SEM gives limited height information; measure thickness and roughness with AFM (Joo et al. 2025).
- Small sample statistics. An image covers a tiny fraction of the sample; check with bulk methods such as XRD (Bijelić et al. 2023).
How to draw the SEM setup and data in LabCanvas
For a methods figure, draw the electron column above the sample with the SE and BSE detectors and the EDS detector at an angle, then show an SE image, a BSE image and an EDS spectrum side by side. In LabCanvas the figure editor Library has the SEM as an editable object, including a cutaway of the electron beam path, and an editable data plot for the EDS spectrum. You can label the element peaks, add a scale bar, and export the figure for a methods section or a graphical abstract.
SEM compared with TEM and AFM
| Technique | What it measures | Sample | Resolution | Environment | Source |
|---|---|---|---|---|---|
| SEM | Surface morphology; composition with EDS | Bulk solids and powders; insulators coated | Nanometre scale | Vacuum or low vacuum | Joo et al. 2025 |
| TEM / STEM | Internal and atomic structure, crystal structure; composition with EDS/EELS | Electron-transparent, below about 100 nm thick | Sub-nanometre | High vacuum | Joo et al. 2025; Bijelić et al. 2023 |
| AFM | Surface topography (true height) plus mechanical, electrical and magnetic properties | Flat surfaces, in air, vacuum or liquid | 1–10 nm lateral, below 1 nm vertical | No vacuum needed | Joo et al. 2025 |
Related techniques
Transmission electron microscopy (TEM)
How TEM works: bright field, HRTEM lattice images, SAED diffraction, STEM-HAADF Z-contrast, EDS/EELS, sample thickness and beam damage of MOFs.
Atomic force microscopy (AFM)
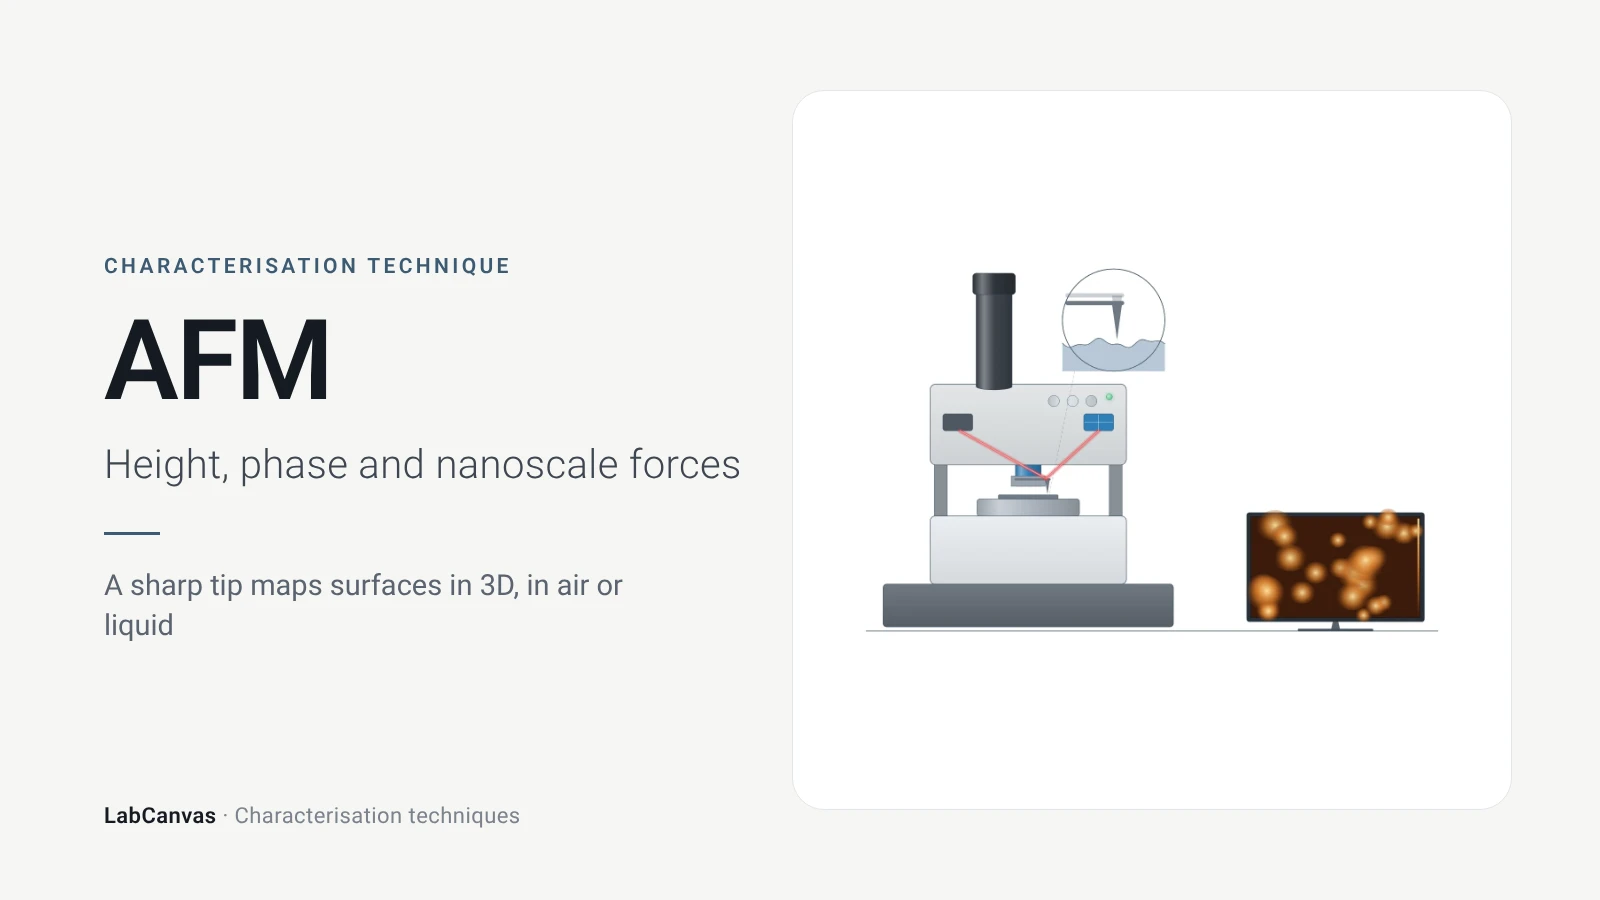
How AFM works: tip, cantilever and laser deflection, contact vs tapping mode, measuring 2D flake thickness from height profiles, and common AFM artefacts.
X-ray diffraction (XRD)
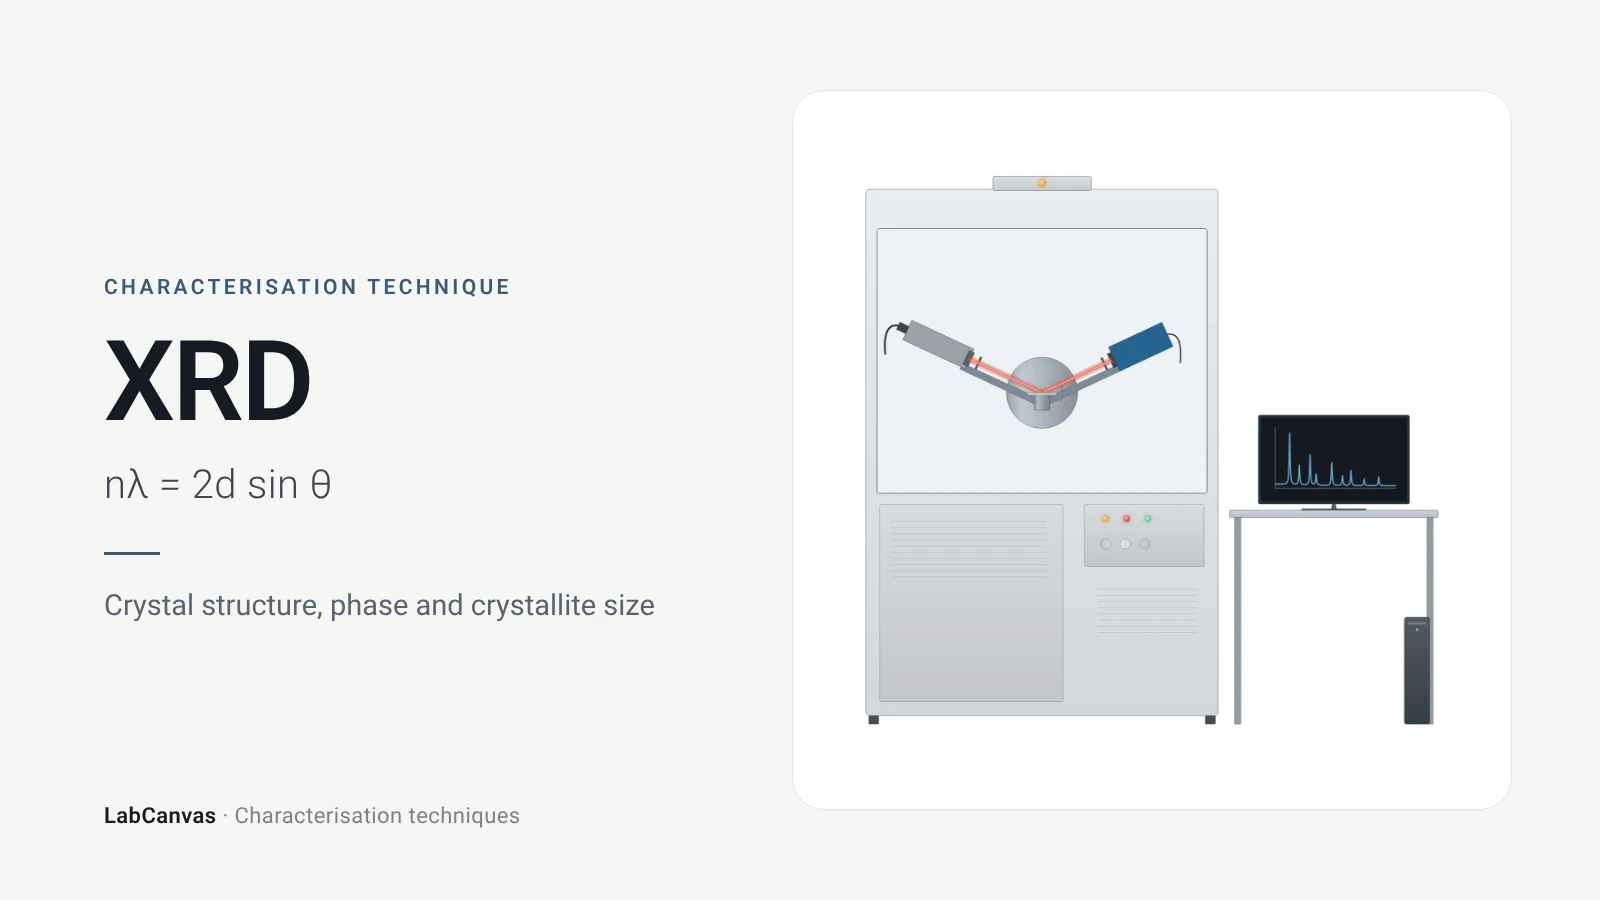
X-ray diffraction explained: Bragg’s law, how to read an XRD pattern, phase identification, Scherrer crystallite size, Rietveld refinement and common mistakes.
X-ray photoelectron spectroscopy (XPS)
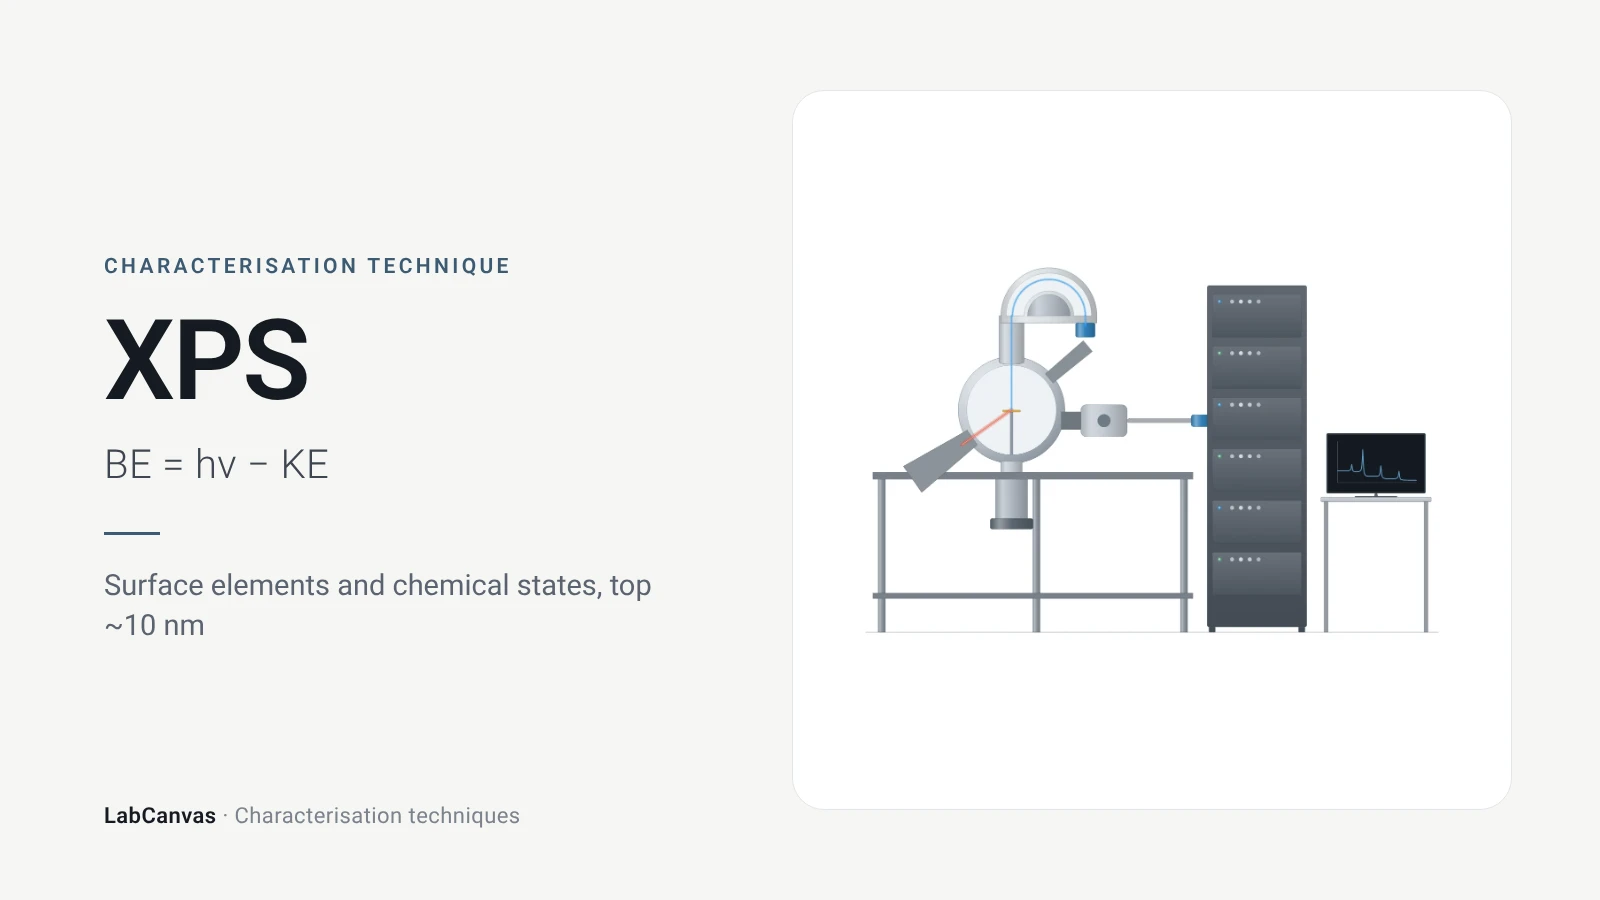
XPS explained: binding energy, 2–10 nm surface sensitivity, survey vs high-resolution spectra, chemical shifts, C 1s charge referencing and depth profiling.
ICP-MS and ICP-OES
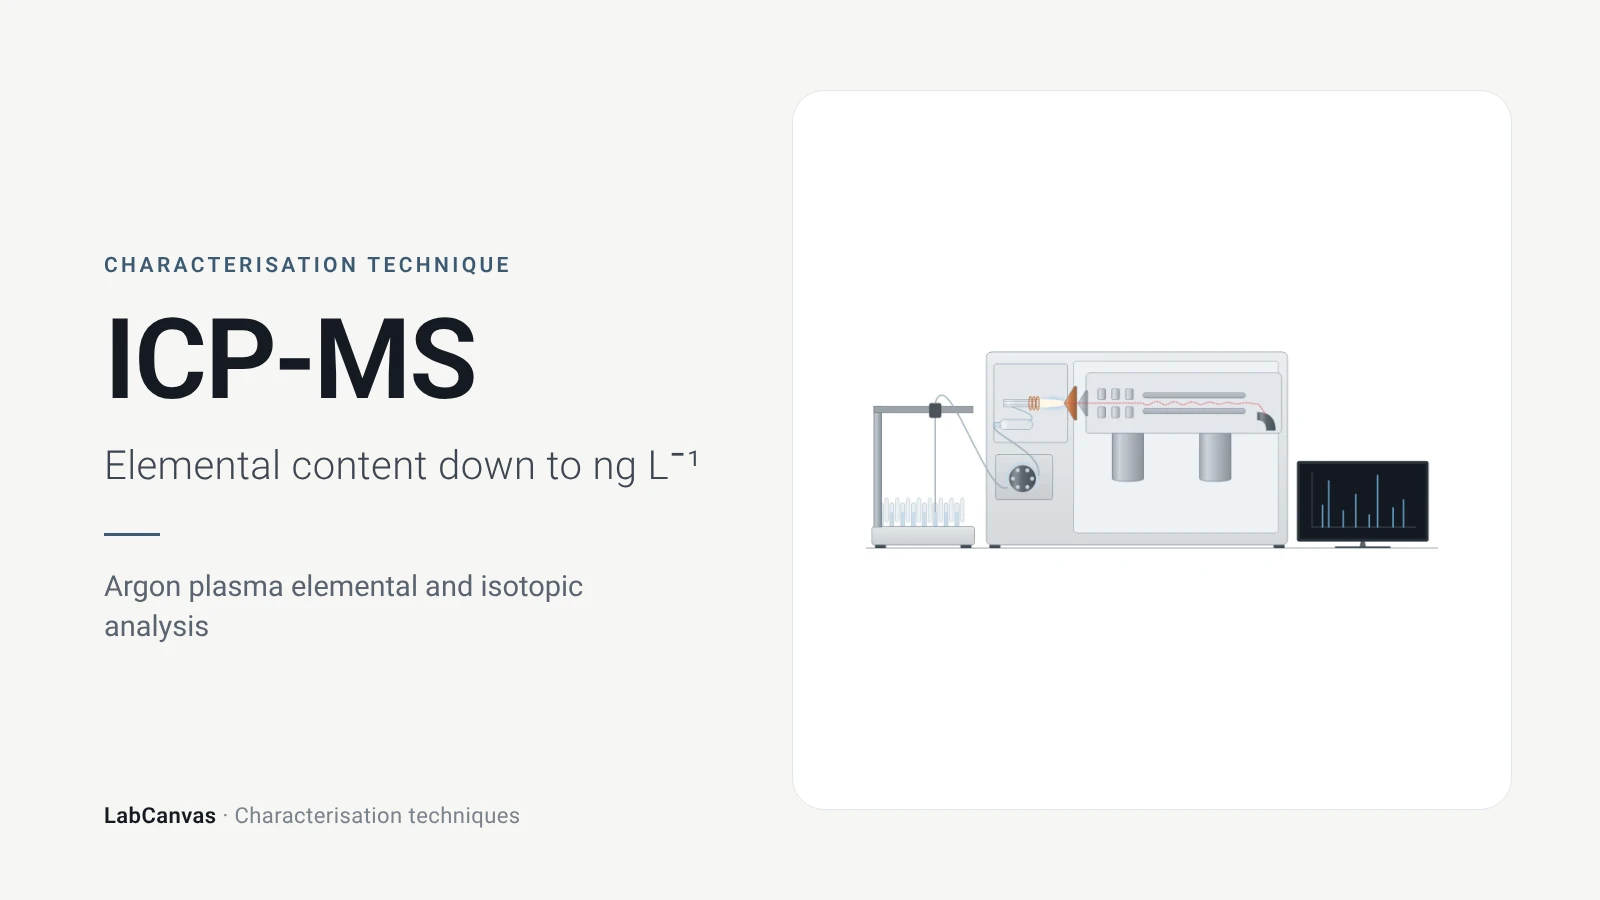
ICP-MS and ICP-OES explained: argon plasma, detection limits, acid digestion, interferences, single-particle ICP-MS and metal content of MOFs.
More on LabCanvas
- All characterisation techniques: XRD, XPS, BET, SEM, TEM, NMR, FTIR, Raman and more, explained with cited sources
- Graphical abstract sizes and templates: ACS, Wiley, Angewandte, RSC, Elsevier and Cell Press, with templates at the right size
- Materials explained: MOFs, COFs, 2D materials, perovskites, batteries and zeolites, with cited facts
- Journal figure size guide: Column widths and resolutions for 38 journals
Frequently asked questions
What is SEM used for?
SEM images the surface of solids to show particle size, shape and morphology at the nanometre scale, and with an EDS detector it maps which elements are present (Erlich et al. 2020; Joo et al. 2025).
What is the difference between secondary and backscattered electrons in SEM?
Secondary electrons give topographic information about the surface, while backscattered electrons give contrast between elements of different atomic number, so heavier phases appear brighter (Erlich et al. 2020; Rau & Zaitsev 2025).
What is SEM-EDS (EDX)?
Energy-dispersive X-ray spectrometry in the SEM records the characteristic X-rays emitted where the beam hits, identifying and mapping all elements except H and He (Newbury & Ritchie 2015).
How accurate is EDS quantification?
Standards-based EDS on flat, polished samples can reach errors of a few percent relative, but the common standardless method needs about ±30% relative to capture 95% of results, and rough specimens add large geometric errors (Newbury & Ritchie 2015).
Why are SEM samples coated with gold or carbon?
Insulating samples charge under the electron beam; a thin conductive coating prevents charging and gives enough secondary-electron signal, but a coating that is too thick hides fine structure (Belz & Auchterlonie 1995).
What is low-vacuum SEM?
An SEM mode with gas in the chamber whose positive ions neutralise the negative charge that accumulates on non-conductive specimens, so they can be imaged without coating (Sawaguchi 2026).
SEM vs TEM: what is the difference?
SEM scans a beam over the surface of a bulk sample and gives morphology at nanometre resolution; TEM sends electrons through a sample thinner than about 100 nm and gives internal and atomic structure at sub-nanometre resolution (Joo et al. 2025; Bijelić et al. 2023).
What is the resolution of SEM?
Nanometre scale; AFM reaches a comparable 1–10 nm laterally and measures height below 1 nm, which SEM cannot (Joo et al. 2025).
References
- M. Erlich, T. Arie, N. Koifman, Y. Talmon. Structure elucidation of silica-based core-shell microencapsulated drugs for topical applications by cryogenic scanning electron microscopy. J. Colloid Interface Sci. 2020, 579, 778–785. doi:10.1016/j.jcis.2020.06.114
- D. E. Newbury, N. W. M. Ritchie. Performing elemental microanalysis with high accuracy and high precision by scanning electron microscopy/silicon drift detector energy-dispersive X-ray spectrometry (SEM/SDD-EDS). J. Mater. Sci. 2015, 50, 493–518. doi:10.1007/s10853-014-8685-2
- E. I. Rau, S. V. Zaitsev. Electron backscattering coefficient, material contrast and response function of BSE-detectors in scanning electron microscopy. Ultramicroscopy 2025, 276, 114196. doi:10.1016/j.ultramic.2025.114196
- C. Zhao, B. He, X. Chen. Influence of curing agent amount on properties of dynamic vulcanized phenyl silicone rubber-SEBS-SBS system. Polymers 2022, 14, 5443. doi:10.3390/polym14245443
- L. Bijelić, F. Ruiz-Zepeda, N. Hodnik. The role of high-resolution transmission electron microscopy and aberration corrected scanning transmission electron microscopy in unraveling the structure–property relationships of Pt-based fuel cells electrocatalysts. Inorg. Chem. Front. 2023, 11, 323–341. doi:10.1039/d3qi01998e
- J. Bromley et al.. Liquid phase backscattered scanning electron microscopy of Bacillus subtilis spores. Small Methods 2026, e71135. doi:10.1002/smtd.71135
- S. Joo et al.. Atomic force microscopy for cross-disciplinary materials research. Small Methods 2025, 9, e2500514. doi:10.1002/smtd.202500514
- A. Sawaguchi. Low-vacuum scanning electron microscopy for informative three-dimensional imaging of cell/tissue architectures and biomedical target localization. Microscopy 2026, 75, 307–317. doi:10.1093/jmicro/dfag012
- G. T. Belz, G. J. Auchterlonie. An investigation of the use of chromium, platinum and gold coating for scanning electron microscopy of casts of lymphoid tissues. Micron 1995, 26, 141–144. doi:10.1016/0968-4328(95)00055-9
- T. Faber, J. T. McConville, A. Lamprecht. Focused ion beam-scanning electron microscopy provides novel insights of drug delivery phenomena. J. Control. Release 2024, 366, 312–327. doi:10.1016/j.jconrel.2023.12.048
- M. Huang et al.. Highly oriented monolayer graphene grown on a Cu/Ni(111) alloy foil. ACS Nano 2018, 12, 6117–6127. doi:10.1021/acsnano.8b02444
Draw Scanning electron microscopy (SEM) figures for your paper
LabCanvas is a browser workspace for scientific figures: instruments with their beam and light paths, editable data plots, crystal structures, graphs and graphical abstracts at journal sizes.
Draw Scanning electron microscopy (SEM) in LabCanvas