Cancer biology figure templates
12 publication-quality cancer-biology figure templates and graphical abstracts, built from live generators and 3D models: the hallmarks of cancer, the tumour microenvironment, checkpoint blockade, CAR-T therapy, the metastatic cascade, antibody–drug conjugates, nanomedicine and the EPR effect, liquid biopsy, organoid and CRISPR screens, immunotherapy resistance and the colorectal adenoma–carcinoma sequence. Every figure cites its papers.
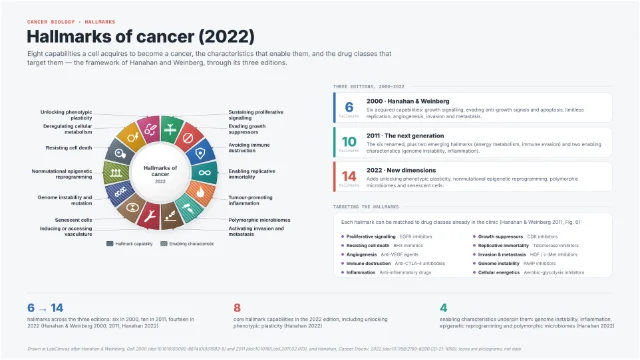 Hallmarks of cancer (2022)
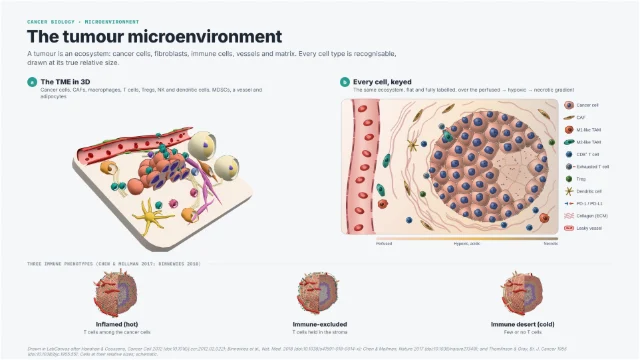 The tumour microenvironment
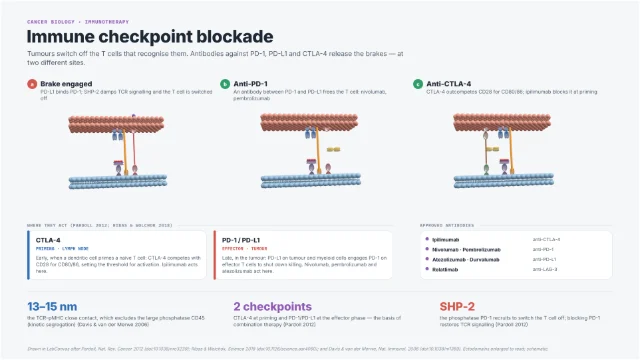 Immune checkpoint blockade
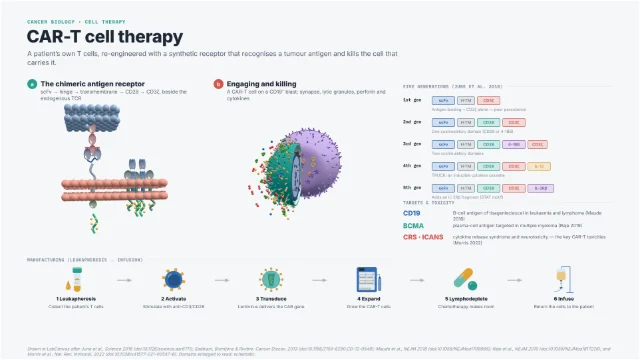 CAR-T cell therapy
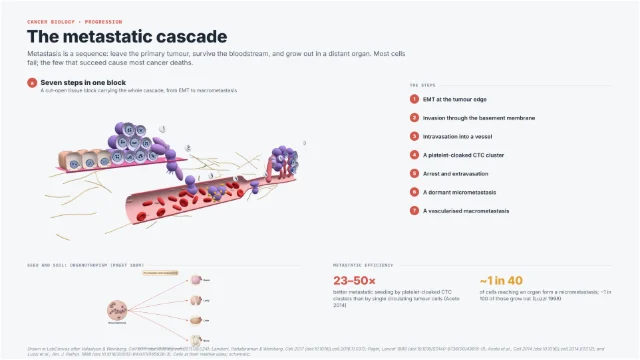 The metastatic cascade
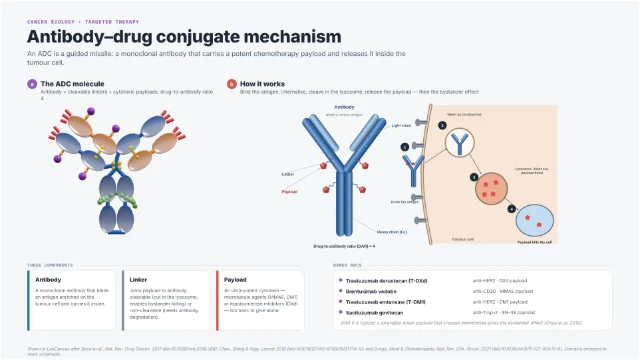 Antibody–drug conjugate mechanism
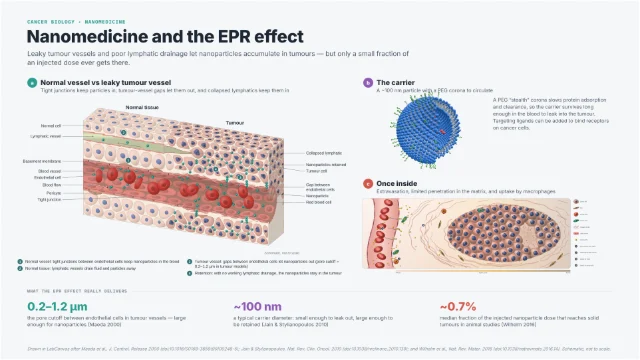 Nanomedicine and the EPR effect
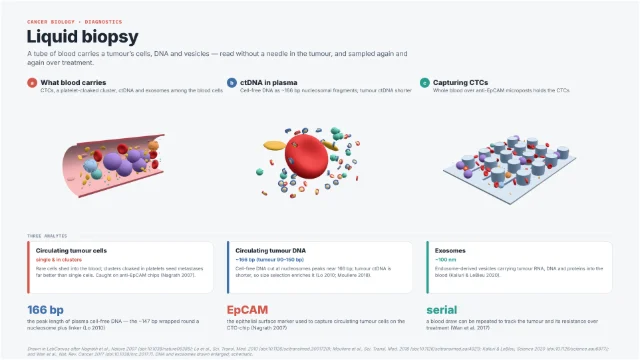 Liquid biopsy
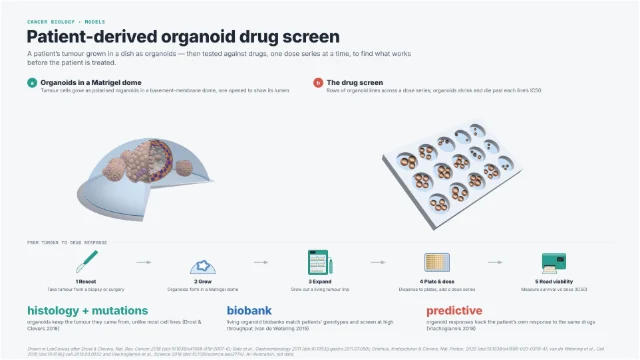 Patient-derived organoid drug screen
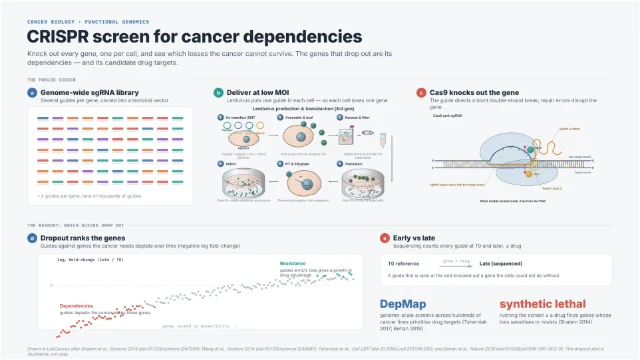 CRISPR screen for cancer dependencies
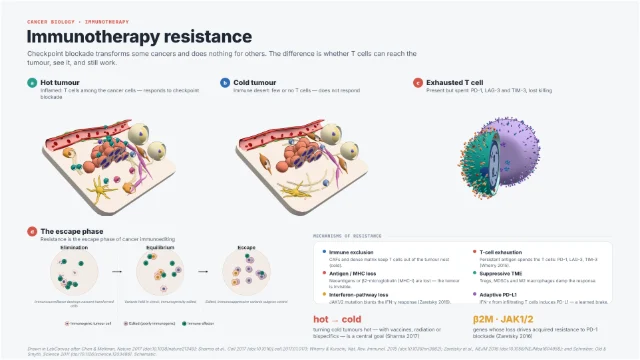 Immunotherapy resistance
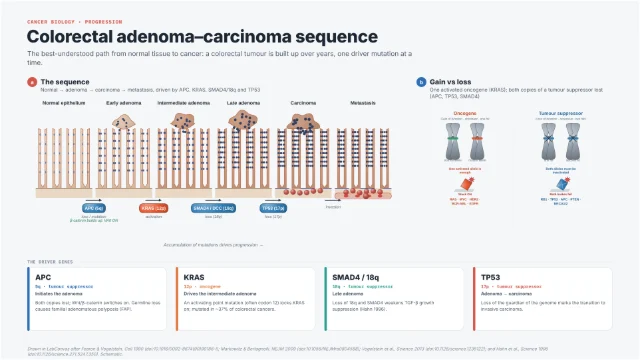 Colorectal adenoma–carcinoma sequence
Drawing cancer biology figures
These templates cover the ideas a cancer-biology figure most often has to carry: the hallmarks of cancer, the tumour microenvironment, the immune mechanisms behind checkpoint blockade and CAR-T therapy, the metastatic cascade, the main therapeutic modalities (antibody–drug conjugates, nanomedicine), and the models and liquid biopsies used to study and monitor tumours. Each is built for review figures, graphical abstracts, teaching slides and talks, where a mechanism has to be shown accurately and legibly rather than as a generic cartoon.
Every panel is a live generator or a 3D Studio model drawn from the papers the template cites, and every number on the figure is quoted from those papers. Cells are drawn at their real relative sizes; molecules, vessels and fragments are schematic where the caption says so. The science and the references sit on each template’s page, with checked DOIs.
Get the numbers and the names right
- Cell sizes. A CD8⁺ T cell is about 7–10 µm, a macrophage about 15–20 µm and a red cell about 7.5 µm. Keeping these ratios makes a microenvironment panel read correctly at a glance.
- Oxygen and necrosis. Oxygen reaches only about 100–200 µm from a capillary before tissue turns hypoxic and then necrotic (Thomlinson & Gray, Br. J. Cancer 1955); draw a spheroid’s necrotic core at that distance, not at random.
- Current nomenclature. Use the 2022 hallmarks (Hanahan, Cancer Discov. 2022), the CAR generations as defined in June et al., Science 2018, and the real drug names (nivolumab and pembrolizumab for PD-1, atezolizumab for PD-L1, ipilimumab for CTLA-4, relatlimab for LAG-3).
- Molecular dimensions. An IgG is about 150 kDa with twelve Ig domains and N-glycans at Asn297; the TCR–pMHC close contact spans about 13–15 nm, which excludes the large phosphatase CD45; plasma cell-free DNA peaks at about 166 bp. These are what make a molecular panel look expert.
Be honest about what therapies deliver
It is easy to overstate a mechanism in a graphical abstract. Two cases recur. The enhanced permeability and retention (EPR) effect is real but inefficient: a meta-analysis by Wilhelm and colleagues (Nat. Rev. Mater. 2016) found a median of about 0.7% of an injected nanoparticle dose reaches solid tumours in published animal studies, so a figure that floods a tumour with particles misleads. And checkpoint blockade works only where T cells can reach the tumour, recognise it and still function; the nanomedicine and immunotherapy-resistance templates draw these limits rather than hiding them.
Where a figure shows a trend rather than measured data — a dropout curve in a CRISPR screen, a dose response in an organoid screen — say so in the caption. The templates mark these panels as illustrations, not data.
Keep scales readable
- Use insets and keys. A tumour spans centimetres, its cells tens of micrometres and an antibody a few nanometres. Zoom between scales with boxes and lines, and give every cell type a colour in a key that stays the same across panels.
- Separate schematic from data. Keep cartoon panels free of numbers that look like measurements; put real measurements in a plot with units. The Graphs app has the oncology plots (waterfall, spider, swimmer, tumour-growth curves) for the quantitative panels.
- One colour per player. Give the cancer cell, the T cell, the drug and the payload one colour each throughout the figure, so a reader can follow them from panel to panel.
Questions
What templates are there for cancer biology?
12: Hallmarks of cancer (2022); The tumour microenvironment; Immune checkpoint blockade; CAR-T cell therapy; The metastatic cascade; Antibody–drug conjugate mechanism; Nanomedicine and the EPR effect; Liquid biopsy; Patient-derived organoid drug screen; CRISPR screen for cancer dependencies; Immunotherapy resistance; Colorectal adenoma–carcinoma sequence.
Which papers are these templates based on?
Together they follow 48 published papers; each template’s page lists its own, with DOIs, and the figure credit names them too.
How do I use one of these templates?
Open its page and click Open in the editor. Sign in, or create an account, and it opens in the LabCanvas figure editor as your own design, with every layer editable.
Which edition of the hallmarks of cancer should I use?
The current one is Hanahan 2022 (Cancer Discov.), with eight hallmark capabilities, four enabling characteristics and the new dimensions of phenotypic plasticity, epigenetic reprogramming, polymorphic microbiomes and senescent cells. The hallmarks template also draws the 2000 and 2011 editions for historical context.
Are the structures and scenes in these templates real?
The 3D models and generators are built from the cited papers at real dimensions and relative cell sizes, but the specific arrangements are schematic examples to replace with your own. Numbers in the captions are quoted from the papers; panels that show a trend rather than data say so.
Can I use these figures in a publication?
Yes. Open a template in the LabCanvas editor, change anything, and export PNG, TIFF or PDF at journal sizes and DPI. Cite the primary papers listed on the template’s page, and keep the “schematic” and “not to scale” notes where the biology is simplified.
Make it your own figure
Start from a template and change anything: the text, the colours, the structures.
Create an account Sign in